The handle
http://hdl.handle.net/1887/18643
holds various files of this Leiden University
dissertation.
Author
: Voort, Frederieke van de
their gaseous haloes
their gaseous haloes
P
roefschrift
ter verkrijging van
de graad van Doctor aan de Universiteit Leiden,
op gezag van de Rector Magnificus prof. mr. P. F. van der Heijden, volgens besluit van het College voor Promoties
te verdedigen op woensdag 28 maart 2012 klokke 16:15 uur
door
Frederieke van de Voort geboren te Eindhoven
Promotor: Prof. dr. J. Schaye
Overige leden: Prof. dr. M. Franx Prof. dr. K. H. Kuijken Dr. J. Brinchmann
1 Introduction 1
1.1 Structure formation in the Universe . . . 2
1.2 Cosmological simulations . . . 7
1.3 This thesis . . . 9
1.4 Outlook . . . 12
2 The rates and modes of gas accretion onto galaxies and their gaseous haloes 13 2.1 Introduction . . . 15
2.2 Simulations . . . 17
2.2.1 Model variations . . . 21
2.2.2 Maximum past temperature . . . 22
2.3 The temperature-density distribution . . . 24
2.4 Defining gas accretion . . . 25
2.4.1 Identifying haloes and galaxies . . . 25
2.4.2 Selecting gas particles accreted onto haloes . . . 26
2.4.3 Selecting gas particles accreted onto galaxies . . . 27
2.5 Total gas accretion rates . . . 27
2.5.1 Accretion onto haloes . . . 30
2.5.2 Accretion onto galaxies . . . 34
2.6 Hot and cold accretion onto haloes . . . 36
2.6.1 Dependence on halo mass . . . 38
2.6.2 Smooth accretion versus mergers . . . 43
2.6.3 Dependence on redshift . . . 43
2.6.4 Effects of physical processes . . . 44
2.7 Hot and cold accretion onto galaxies . . . 48
2.7.1 Effects of physical processes . . . 52
2.8 Comparison with previous work . . . 54
2.9 Conclusions . . . 56
3 The drop in the cosmic star formation rate below redshift 2 is caused by a change in the mode of gas accretion and by active galactic nucleus feedback 61 3.1 Introduction . . . 62
3.2 Simulations . . . 63
3.2.1 Accretion and mergers . . . 66
3.3 Global accretion and star formation . . . 67
3.4 Effect of AGN feedback . . . 72
4.2 Simulations . . . 80
4.2.1 Variations . . . 83
4.2.2 Identifying haloes . . . 84
4.2.3 Hot- and cold-mode gas . . . 84
4.3 Physical properties: dependence on radius . . . 85
4.3.1 Density . . . 88
4.3.2 Temperature . . . 90
4.3.3 Maximum past temperature . . . 90
4.3.4 Pressure . . . 91
4.3.5 Entropy . . . 92
4.3.6 Metallicity . . . 92
4.3.7 Radial velocity . . . 93
4.3.8 Accretion rate . . . 94
4.3.9 Hot fraction . . . 95
4.4 Dependence on halo mass . . . 96
4.5 Inflow and outflow . . . 101
4.6 Effect of metal-line cooling and outflows driven by supernovae and AGN . . . 104
4.7 Evolution: Milky Way-sized haloes atz=0 . . . 108
4.8 Conclusions and discussion . . . 110
A Resolution tests . . . 114
5 Cold accretion flows and the nature of high column density Hi absorp-tion at redshift 3 119 5.1 Introduction . . . 120
5.2 Simulations . . . 122
5.3 Gas samples . . . 125
5.4 Results . . . 127
5.4.1 Gas and Hifractions . . . 127
5.4.2 Spatial distribution: A visual impression . . . 130
5.4.3 The column density distribution function . . . 132
5.5 Discussion and conclusions . . . 136
6 Soft X-ray and ultra-violet metal-line emission from the gas around galaxies 141 6.1 Introduction . . . 142
6.2 Method . . . 143
6.2.1 Simulations . . . 143
6.2.2 Identifying haloes . . . 145
6.2.3 Emission . . . 145
6.3 Results . . . 148
6.3.4 Low-redshift Hα . . . 166
6.4 Discussion and conclusions . . . 166
Nederlandse samenvatting 169
De groei van sterrenstelsels en hun gasrijke halo’s . . . 169 De inhoud van dit proefschrift . . . 170 De toekomst . . . 173
References 175
Publications 183
Curriculum Vitae 185
1
I
ntroduction
1.1
Structure formation in the Universe
More than thirteen billion years ago the Universe was almost completely homo-geneous. Tiny gas density fluctuations of the order 10−5 grew into everything we can see today. Structure on the largest scales is completely governed by gravity. The matter is concentrated in a ‘cosmic web’ of sheets and filaments that are determined by the original fluctuations and the cosmological parame-ters, principally Ωm, ΩΛ, h, σ8, andn. The values of these parameters can be
derived from accurate observations of the cosmic microwave background, the radiation emitted by recombining protons and electrons and redshifted by a fac-tor of about 1100, and of the large-scale distribution of matter (e.g. Spergel et al., 2003; Komatsu et al., 2011).
The distribution of matter is not spherically symmetric, so the collapse will be different in different directions. First collapse happens in one dimension, form-ing sheets. When collapse happens in two dimenions, filaments form. In the end, collapse occurs in three dimension and haloes are formed. An illustration of the gas distribution in the present-day Universe is shown in Figure 1.1. Assuming spherical collapse, the internal density for collapsed haloes isρcoll ≈ 18π2hρmi (Padmanabhan, 2002), wherehρmiis the cosmic mean matter density:
hρmi=Ωmρcrit =Ωm(1+z)3ρcrit,0 =Ωm(1+z)33H 2 0
8πG, (1.1)
whereH0is thez=0 value of the Hubble parameter andGis the gravitational constant. The mass of this object then isMhalo= 43πρcollR3vir, from which we can derive an expression for the virial radius:
Rvir ≈ 2GMhalo
H20Ωm18π2
!1/3 1
1+z (1.2)
or
Rvir ≈3.4·102kpc
M
1012M ⊙
1/3 Ω
mH02
1.3×10−36s−2 !−1/3
1
1+z. (1.3)
Galaxies form inside their much larger haloes in the highest density peaks and are dominated by baryons, because gas is able to cool, whereas dark matter can only lose energy due to gravitational interactions, e.g. dynamical friction. Galaxy properties therefore depend on other things than just gravity. The gas behaves like an ideal gas. Its pressure increases when its volume decreases or its temperature increases. It can move supersonically and it can therefore experience shocks, converting its kinetic energy into thermal energy.
Figure 1.1: Zoom-in from 50h−1Mpc to 10h−1Mpc to 2h−1Mpc of the gas density in a
2h−1Mpc slice of the Universe atz=0, centred on a massive halo (Mhalo=1013.5M⊙),
showing the filaments of the cosmic web and the haloes embedded within them. The colour bar is logarithmic, the same in all panels, and runs from the mean cosmic density (blue) to 104 times the mean density of the Universe (red). The simulation used is the
reference simulation in a (50h−1Mpc)3 volume from the OWLS project (Schaye et al.,
further and fragment into smaller structures, such as stars and galaxies. The cooling time can be defined as the ratio of the thermal energy density of the gas and the cooling rate, which depends on the density, temperature, and metallicity of the gas, because it may be dominated by metal-line emission.
After virialization, a gas cloud can be in one of three regimes. If the charac-teristic cooling time exceeds the Hubble time-scale, the gas will not be able to radiate away the thermal energy that supports it and will therefore not collapse. If, on the other hand, the cooling time is smaller than the Hubble time, but larger than the dynamical time-scale, then the cloud can adjust its density and temper-ature quasi-statically. It will increase both its density and its tempertemper-ature while maintaining hydrostatic equilibrium. Finally, if the cooling time is shorter than the dynamical time, the cloud will cool faster than it can collapse, lowering the Jeans mass and possibly leading to fragmentation. This is the regime in which galaxies are thought to form (Rees & Ostriker, 1977; Silk, 1977).
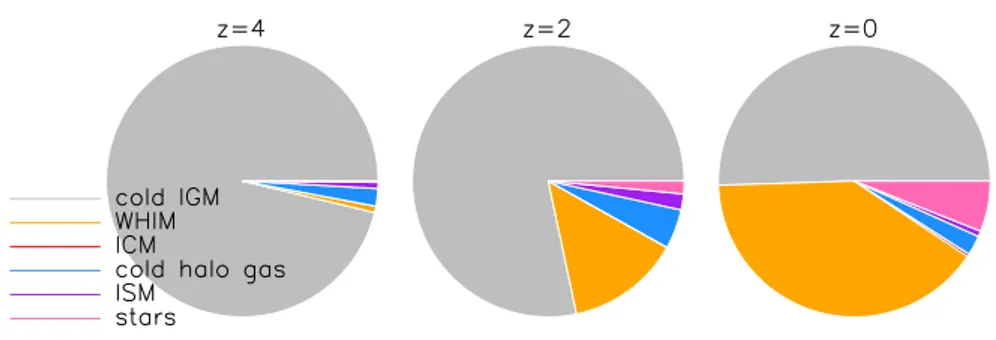
We can divide the gas in the Universe into a couple of different phases in temperature-density space. Their relative importance atz=4, 2, and 0 is shown in Figure 1.2. Gas with densities up to ∼ 102 times the cosmic average den-sity represents the intergalactic medium (IGM). In the beginning, there was no structure and all gas had densities very close to the cosmic mean and therefore all gas started out in the IGM. At later times, a significant fraction of this gas resides in filamentary structures. The gas can be heated to temperatures above 105 K when kinetic energy, generated by gravitational infall or galactic winds, is converted into thermal energy. We refer to this tenuous, shock-heated gas as the warm-hot intergalactic medium (WHIM). The WHIM also includes denser halo gas. The intracluster medium is the very hot T > 107 K gas located in
galaxy groups and clusters. Gas at overdensitiesρ/hρi>102, but at much lower
temperature (T < 105K), resides mostly in the densest parts of filaments and
low-mass haloes. Gas at very high densities nH > 0.1 cm−3 is located inside
galaxies, in the interstellar medium (ISM).
Although the IGM completely dominates the mass budget at high redshift, byz=0 the WHIM carries about the same amount of mass (Davé et al., 2001). The ICM is never very important, because the highest-mass objects are rare (e.g. Shull et al., 2011). The amount of gas in the ISM and in low-temperature halo gas peaks atz=3−2 and declines thereafter (e.g. van de Voort et al., 2011b)
In the low-density IGM, the dominant cooling process is the expansion of the Universe. As the gas reaches higher densities, radiative cooling becomes more important. The cooling timetcoolis shorter at higher redshift, because the density, ρ, is higher and tcool ∝ ρ−1. The Hubble time tH is also shorter, but with a weaker dependence,tH ∝ρ1/2. Hence, galaxy formation will depend on
redshift. The so-called cooling radius is the radius, from the halo centre, where
Figure 1.2: Distribution of baryonic matter amongst the different gas phases and stars.
The cold IGM (grey) dominates, but becomes less important towards lower redshift. The WHIM (orange) becomes more important towards lower redshift. The ICM (red) is never very important. The amount of cold halo gas (blue) and ISM (purple) is largest atz≈2. The stellar mass keeps building up down toz=0. The simulation used is the reference simulation in a (50h−1Mpc)3volume from the OWLS project (Schaye et al., 2010).
radius is larger than the virial radius, then there will be no hot halo and the gas will not go through an accretion shock at the virial radius. The rapid cooling of gas in low-mass haloes was already shown by Rees & Ostriker (1977) and White & Rees (1978). The accretion rate onto the central galaxy then depends on the infall rate, but not on the cooling rate (White & Frenk, 1991).
Because haloes are not spherical, the cooling radius will not be the same for the entire halo. Gas can accrete onto a halo from the low-density IGM or along filaments of the cosmic web. The different gas densities will impact the temperature of the gas. As mentioned before, the gas needs to radiate away its energy to reach higher densities and thus to be able to enter a galaxy. Metal-line emission dominates the cooling function for metallicitiesZ/Z⊙&0.1, which
peaks atT≈105−5.5K (Wiersma et al., 2009a). Gas at much higher temperatures will cool slowly. This gives rise to a bimodal temperature distribution for gas that accretes onto a massive halo (Kereš et al., 2005; Dekel & Birnboim, 2006).
et al., 2008; Dekel et al., 2009a; Kereš et al., 2009a; van de Voort et al., 2011a; Powell et al., 2011).
After gas has become part of the multiphase ISM of a galaxy, stars can form out of it. Star formation in galaxies is observed to follow a close relation between the gas surface density and the star formation rate surface density (Kennicutt, 1998). The gas surface density can be related to the gas volume density and both are a function of the total thermal pressure (Schaye & Dalla Vecchia, 2008). The observed gas consumption time-scale, i.e. the gas mass divided by the star formation rate, is of the order of a Gyr.
In the absence of any feedback mechanism, gas accretion and star formation happen too efficiently and the amount of baryons in stars would greatly exceed the observed amount. Outflows are routinely detected in the form of blueshifted interstellar absorption lines in the spectra of star-forming galaxies (e.g. Steidel et al., 2010; Rubin et al., 2010; Rakic et al., 2011a), in X-ray emission and in hydro-gen Balmer-α line emission (e.g. Lehnert et al., 1999; Cecil et al., 2001; Veilleux
et al., 2005). Single supernova explosions can temporarily outshine their host galaxy. The material from the star that is expelled at high velocity, sweeps up material in front of it, thus evacuating a bubble of hot gas around the original star. When many supernovae occur in the same region, the bubbles can over-lap and form superbubbles, which can lead to large-scale galactic outflows (e.g. Weaver et al., 1977; Mac Low & Ferrara, 1999).
Supermassive black holes are present in all massive galaxies (e.g. Kormendy & Richstone, 1995; Ferrarese & Merritt, 2000). Material accreting onto these black holes is thought to release some of its rest mass energy to power active galac-tic nuclei (AGN) (Salpeter, 1964). AGN are invoked as a mechanism powerful enough to quench star formation in the most massive galaxies by driving gas out at high velocities.
Stars produce heavy elements, which can be distributed in their surroundings by stellar winds and supernova explosions. These metals are ejected from the galaxy by galactic winds driven by supernovae or AGN and enrich the halo gas as well as part of the IGM (e.g. Wiersma et al., 2011). The enrichment enhances the cooling rate of the gas and previously ejected gas can be reaccreted by the same object or a different one (Oppenheimer et al., 2010). Because of large-scale outflows, the IGM, haloes, and galaxies are intimately connected and the cycle of baryons becomes complicated as outflows and inflows interact.
is no direct evidence of cold-mode accretion, although there are some possible detections in emission (Rauch et al., 2011) and absorption (Ribaudo et al., 2011; Giavalisco et al., 2011).
Diffuse gas can be detected in absorption using a bright background source. UV and X-ray absorption line studies have revealed cold, neutral gas and the WHIM. Their interpretation is not easy, as there is only information along the line of sight and no information about the spatial extent of the absorbing cloud and often the location of the nearest galaxy is unknown. The neutral hydrogen column density distribution has been measured over ten orders of magnitude in
NHi(e.g. Tytler, 1987; Kim et al., 2002; Péroux et al., 2005; O’Meara et al., 2007; Prochaska & Wolfe, 2009; Noterdaeme et al., 2009; Prochaska et al., 2010). Low column density (NHi < 1017.2 cm2) material is known as the Lyman-α forest and originates mostly in the photo-ionized IGM (e.g. Bi et al., 1992; Cen et al., 1994; Hernquist et al., 1996; Theuns et al., 1998; Schaye, 2001a). Higher column density systems originate from gas in haloes and galaxies. By correlating the Hi absorption in the spectra of background quasars with both the transverse and line of sight separations from foreground galaxies, Rakic et al. (2011b) have recently detected strong evidence for infall of cold gas on scales of∼ 1.4−2.0 proper Mpc atz≈2.4.
The gas emissivity in X-ray and UV scales with the square of the density. The signal is thus dominated by high-density regions. In this way, emission line stud-ies complement the absorption line studstud-ies. They have the added advantage of providing a two-dimensional image, in addition to the third dimension provided by the redshift of the emission line, allowing us to study the three-dimensional spatial distribution. The interpretation of emitting gas would therefore be easier, but because the emission is very faint, detecting it is still a challenge.
How all processes occurring in galaxy formation interact is a field of active research. One can use numerical simulations as a tool to study this interplay and to predict the observational consequences.
1.2
Cosmological simulations
Because the time-scales involved in galaxy formation are generally very long compared to a human life time, numerical simulations are an excellent tool to study structure formation dynamically. Additionally it is possible to study a particular process by running two simulations, one with and one without it. The complex, non-linear behaviour of the density perturbations necessitates the use of supercomputers to perform the calculations. Numerical simulations have significantly improved our understanding of the large-scale structure in the Uni-verse. Even though we know very little about the physical nature of dark matter and dark energy, the standard cosmological constant or vacuum-dominated cold dark matter (ΛCDM) model reproduces the observed large-scale structure and
Despite its many successes, this model is not sufficient to explain the properties of galaxies. Baryonic processes, that are not all well understood, are essential in-gredients. Through feedback they can even impact the dark matter distribution, a process that one should take into account when doing precision cosmology (van Daalen et al., 2011; Semboloni et al., 2011).
Most cosmological simulations, i.e. simulations of structure formation in a representative part of the universe, use particles to discretize the mass, because of the superior spatial resolution to grid-based codes. The spatial resolution is automatically higher in denser regions, where galaxies form. Little time is spent on calculations in low density regions, where properties do not change rapidly anyway. Another advantage of particle-based simulations is that there is no preferred spatial direction and the resolution is increased continuously from low- to high-density regions. An advantage that is particularly important for this thesis is that we can trace the mass back in time to investigate its history.
The advantage of grid-based codes is that they are superior in resolving dis-continuities, such as shocks. Turbulence and instabilities are also more easily resolved. An added advantage is that one can choose a different property than density as a refinement criterion and achieve high resolution in any region of interest.
The expansion of the universe is dealt with by using comoving coordinates. In physical space every volume element expands by an equal amount, set by the cosmological parameters. To deal with the thermodynamic property of baryons, smoothed particle hydrodynamics (SPH) can be used, in which some properties of particles, e.g. density and metallicity, are smoothed over space by a spline kernel function. Unfortunately, in SPH simulations shocks are not resolved as true discontinuities, but they are smeared out over a few smoothing lengths, leading to in-shock cooling (Hutchings & Thomas, 2000). This problem can be avoided by using a sufficiently high resolution (Creasey et al., 2011).
Although cosmological simulations can provide sufficiently accurate calcula-tions for diffuse gas, once the gas reaches high densities, that are characteristic of the ISM, the multiphase medium cannot be resolved. The formation of individ-ual stars from molecular clouds is not (yet) possible in cosmological simulations. The effect that stars have, through e.g. ionizing photons, metal production, stel-lar winds, and supernova explosions, has to be modelled with subgrid prescrip-tions. Subgrid models are also needed for radiative cooling, because it happens on the atomic level, and for accretion onto black holes, because the scale of the accretion disc is not resolved.
sim-ulations. There is a reference model and all other simulations are variations on this model, in the sense that only one parameter or one model was varied at a time. Even though there are certainly uncertainties associated with these simulations, their importance can be quantified by comparing simulations with different resolution and different subgrid physics. In this thesis we use a subset of the OWLS runs and will focus on the properties of gas accretion and their consequences, the effect of feedback, and the observational signature of diffuse gas outside galaxies.
1.3
This thesis
Numerical studies of the nature of gas accretion have revealed a bimodality, at least for massive haloes. The temperature of gas accretion onto haloes is either
.105K or close to the virial temperature of the halo (Kereš et al., 2005; Dekel
& Birnboim, 2006; Ocvirk et al., 2008; Dekel et al., 2009a; Kereš et al., 2009a; van de Voort et al., 2011a; Powell et al., 2011). Even though dividing accreting gas into two modes does not change the problem simulations have with reproducing observations, it can shed light on the physical mechanism behind it. In this thesis the following open questions will be addressed:
1. What are the properties of accreting gas? How do the properties of gas accretion onto haloes affect the accretion onto galaxies and subsequently the star formation rates of the galaxies?
2. What is the impact of realistic outflows on the inflowing gas? Is star for-mation quenched by ejecting gas from the ISM or by preventing it from accreting? Which processes set the global star formation rate?
3. Has cold-mode accretion already been observed as Hiabsorption systems? If so, in what kind of objects is it found? Is the cold-mode gas accreting for the first time or reaccreting?
4. Can we observe halo gas in emission in the near future? If so, which metal lines would be most promising and what do they tell us about the physical state of the gas?
A brief summary of the contents of this thesis is given below.
Chapter 2: Gas accretion onto galaxies and haloes
gas from accreting. Galactic winds increase the halo mass at which the central galaxies grow most efficiently by about two orders of magnitude to Mhalo ≈ 1012M
⊙.
Gas accretion is bimodal, with maximum past temperatures either of the order of the virial temperature or . 105 K. We define cold-mode (hot-mode)
accretion as gas that is accreted and whose temperature did not exceed (did exceed) 105.5 K before it accreted onto a galaxy. The fraction of the gas accreted onto haloes in the hot mode is insensitive to feedback and metal-line cooling. It increases with decreasing redshift, but is mostly determined by the halo mass. In contrast, for accretion onto galaxies, the cold mode is always significant and the relative contributions of the two accretion modes are more sensitive to feedback and metal-line cooling. (This work has been completed and published, van de Voort et al. 2011a.)
Chapter 3: The drop in the cosmic SFR below redshift 2
Given that hot- and cold-mode accretion vary with redshift and halo mass, we determine their roles in shaping the global star formation rate density. In-cluding feedback processes is essential to match observations of the global star formation rate density, because it reduces the star formation rate in low- and high-mass galaxies. The cosmic star formation rate is observed to drop sharply afterz = 2. We find that the drop in the star formation rate follows a
corre-sponding decline in the global cold-mode accretion rate density onto haloes, but with a delay of the order of the gas consumption time-scale in the interstellar medium.
In contrast to cold-mode accretion, which peaks at z ≈ 3, the hot mode continues to increase to z ≈ 1 and remains roughly constant thereafter. By
z = 0, the hot mode strongly dominates the global accretion rate onto haloes,
but most of the hot halo gas never accretes onto galaxies. AGN feedback plays a crucial role by preferentially preventing the gas that entered haloes in the hot mode from accreting onto their central galaxies. Consequently, in the absence of AGN feedback, gas accreted in the hot mode would become the dominant source of fuel for star formation and the drop-off in the cosmic star formation rate would be much less steep. (This work has been completed and published, van de Voort et al. 2011b.)
Chapter 4: Gas properties in and around haloes
the inner halo are indistinguishable. Stronger feedback results in larger outflow velocities and pushes hot-mode gas to larger radii. The differences between cold- and hot-mode gas resemble those between inflowing and outflowing gas, although they are somewhat smaller. The gas properties evolve as expected from virial arguments, which can also account for the dependence of many gas properties on halo mass. (This work has been completed and submitted, van de Voort & Schaye 2012.)
Chapter 5: Cold flows as Hiabsorption systems
We use the OWLS reference simulation that has been post-processed with ra-diative transfer to study the contribution of cold flows to the observedz = 3
column density distribution of neutral hydrogen, which our simulation repro-duces. We have found that nearly all of the Hi absorption arises in gas that has remained colder than 105.5 K, at least while it was extragalactic. In addi-tion, the majority of the Hi is rapidly falling towards a nearby galaxy, with non-negligible contributions from outflowing and static gas. Above a column density ofNHi=1017 cm−2, most of the absorbers reside inside haloes, but the interstellar medium only dominates for NHi > 1021 cm−2. Haloes with total mass below 1010 M
⊙ dominate the absorption for 1017 < NHi<1021 cm−2, but the average halo mass increases sharply for higher column densities.
Systems with NHi > 1017 cm−2 are closely related to star formation: most of their Hi either will become part of the interstellar medium beforez = 2 or has been ejected from a galaxy at z > 3. Cold accretion flows are critical for
the success of our simulation in reproducing the observed rate of incidence of damped Lyman-αand particularly that of Lyman limit systems. We therefore
conclude that cold accretion flows exist and have already been detected in the form of high column density Hiabsorbers. (This work has been completed and is in press, van de Voort et al. 2012.)
Chapter 6: Metal-line emission from galaxy haloes
The gas outside of galaxies is diffuse and therefore faint. With current and up-coming instruments we may be able to detect the halo gas in emission, even if only in a statistical sense. We calculate the expected metal-line emission as a function of radius from the central galaxy and compare it to the capabilities of current and future facilities. We found that detecting metal-line emission in the UV from halo gas at high redshift will be a challenge for upcoming instru-ments. When stacking galaxies to reduce the noise, it is in principle possible to observe Ciii, Civ, Ovi, Siiii, and Siivout to 10−20 per cent of the virial ra-dius in haloes larger than 1011M
simula-tions. (This work is in an advanced stage of preparation and will be submitted soon.)
1.4
Outlook
Research will never truly be finished, because there will always be new questions that arise. Significant progress will be made in the near future in the study of galaxy formation, both observationally and theoretically. As observations improve, simulations will have to improve as well. Higher spatial resolution and time resolution will lead to improvements, especially when it goes hand in hand with the development of more advanced subgrid models.
Although we can quantify the uncertainties with the suite of simulations used for this thesis, many of the observed properties of galaxies are not reproduced by a single simulation. The Evolution and Assembly of GaLaxies and their En-vironments (EAGLE) project will be the largest SPH simulation down toz= 0 as of yet, with a resolution high enough to resolve the Jeans scale up to the star formation threshold and a volume large enough to contain a significant amount of massive haloes. The strategy is to tune the feedback parameters to match the observed stellar mass function and the stellar mass-halo mass relation. This will result in a large sample of relatively realistic, well-resolved massive galaxies and will therefore be well-suited for comparing to observations.
Radiative transfer is usually not taken into account in cosmological simu-lations. Instead, all the gas is assumed to be optically thin and is exposed to the same ionizing UV background radiation. In reality, inhomogeneous ionizing radiation from local sources and self-shielding of the gas can change the tem-perature and density of gas in haloes and in the IGM, so it should be included. Recent progress in radiative transfer modelling will make this feasible.
Numerical simulations help us investigate what is happening outside of galaxies, but we need to observe the material to confirm our ideas. Future instru-ments that have been designed for the detection of UV and X-ray emission will certainly aid our understanding. In particular, next year MUSE, an integral field spectrograph, will be installed on the VLT, which is expected to detect many sources, in emission and absorption (Bacon et al., 2010). Additionally, proposed X-ray missions would be ideal for detecting metal-line emission from the WHIM in the centres and outskirts of massive haloes and studying the gas properties (e.g. den Herder et al., 2011).
Lyman-α radiation is an important tool for observing the distant Universe,
because it is much brighter than metal-line emission. Its interpretation is still a challenge, because the Lyman-α line is a resonant line and photons scatter
many times before escaping, which strongly affects the line profile.
Lyman-α radiative transfer simulations will allow us to disentangle radiative transfer
2
T
he rates and modes of gas
accretion onto galaxies and their
gaseous haloes
We study the rate at which gas accretes onto galaxies and haloes and investigate whether the accreted gas was shocked to high temperatures before reaching a galaxy. For this purpose we use a suite of large cosmological, hydrodynami-cal simulations from the OWLS project, which uses a modified version of the smoothed particle hydrodynamics code gadget-3. We improve on previous work by considering a wider range of halo masses and redshifts, by distin-guishing accretion onto haloes and galaxies, by including important feedback processes, and by comparing simulations with different physics.
Gas accretion is mostly smooth, with mergers only becoming important for groups and clusters. The specific rate of gas accretion onto haloes is, like that for dark matter, only weakly dependent on halo mass. For halo massesMhalo≫ 1011 M
⊙ it is relatively insensitive to feedback processes. In contrast, accretion rates onto galaxies are determined by radiative cooling and by outflows driven by supernovae and active galactic nuclei. Galactic winds increase the halo mass at which the central galaxies grow the fastest by about two orders of magnitude toMhalo∼1012 M⊙.
Gas accretion is bimodal, with maximum past temperatures either of order the virial temperature or . 105 K. The fraction of gas accreted onto haloes in
the hot mode is insensitive to feedback and metal-line cooling. It increases with decreasing redshift, but is mostly determined by halo mass, increasing gradually from less than 10% for∼1011M
⊙to greater than 90% at∼1013M⊙. In contrast, for accretion onto galaxies the cold mode is always significant and the relative contributions of the two accretion modes are more sensitive to feedback and metal-line cooling. On average, the majority of stars present in any mass halo at any redshift were formed from gas accreted in the cold mode, although the hot mode contributes typically over 10% forMhalo&1011M⊙.
predominantly fed by gas that did not experience an accretion shock when it entered the host halo.
Freeke van de Voort, Joop Schaye, C. M. Booth, Marcel R. Haas, and Claudio Dalla Vecchia
2.1
Introduction
In the standard cosmological constant or vacuum dominated cold dark mat-ter (ΛCDM) model mass assembles hierarchically, with the smallest structures
forming first. While the collapse of dark matter halts as it reaches virial equilib-rium in haloes, baryons can radiate away their binding energy, allowing them to collapse further and fragment into smaller structures, such as stars and galaxies. These galaxies then grow through mergers and gas accretion.
After virialization, a gas cloud can be in one of three regimes. If the charac-teristic cooling time exceeds the Hubble time-scale, the gas will not be able to radiate away the thermal energy that supports it and will therefore not collapse. If, on the other hand, the cooling time is smaller than the Hubble time, but larger than the dynamical time-scale, then the cloud can adjust its density and temperature quasi-statically. It will increase both its density and temperature while maintaining hydrostatic equilibrium. Finally, if the cooling time is shorter than the dynamical time, the cloud will cool faster than it can collapse, lower-ing the Jeans mass and possibly leadlower-ing to fragmentation. This is the regime in which galaxies are thought to form (Silk, 1977; Rees & Ostriker, 1977). In reality the situation must, however, be more complicated as the density, and thus the cooling and dynamical times, will vary with radius.
Gas falling towards a galaxy gains kinetic energy until it reaches the hydro-static halo. If the infall velocity is supersonic, it will experience a shock and heat to the virial temperature of the halo. According to the simplest picture of spher-ical collapse, all gas in a dark matter halo is heated to the virial temperature of that halo, reaching a quasi-static equilibrium supported by the pressure of the hot gas. Gas can subsequently cool radiatively and settle into a rotationally sup-ported disc, where it can form stars (e.g. Fall & Efstathiou, 1980). We call this form of gas accretion‘hot accretion’(Katz et al., 2003; Kereš et al., 2005).
Within some radius, the so-called cooling radius, the cooling time of the gas will, however, be shorter than the age of the Universe. If the cooling radius lies well inside the halo, which is the case for high-mass haloes, a quasi-static, hot atmosphere will form. Accretion onto the galaxy is then regulated by the cooling function. If, on the other hand, this radius is larger than the virial radius, then there will be no hot halo and the gas will not go through an accretion shock at the virial radius. Because gas accreted in this manner may never have been heated to the virial temperature, we refer to this mode of accretion as‘cold accretion’
(Katz et al., 2003; Kereš et al., 2005). The rapid cooling of gas in low-mass haloes was already shown by Rees & Ostriker (1977) and White & Rees (1978). The accretion rate onto the central galaxy then depends on the infall rate, but not on the cooling rate (White & Frenk, 1991). Simulations confirmed the existence of gas inside haloes which was never heated to the virial temperature of the halo (Katz & Gunn, 1991; Kay et al., 2000; Fardal et al., 2001; Katz et al., 2003).
dependence, tH ∝ ρ−1/2. Hence, the mode of gas accretion onto galaxies will depend on redshift, with cold accretion more prevalent at higher redshifts for a fixed virial temperature. The mode of gas accretion will also depend on halo mass. Higher-mass haloes have higher virial temperatures and thus, at least for
T & 106 K, longer cooling times. Hence, hot accretion will dominate for the
most massive haloes. The dominant form of accretion will thus depend on both the mass of the halo and on the accretion redshift (Katz et al., 2003; Birnboim & Dekel, 2003; Kereš et al., 2005; Ocvirk et al., 2008; Kereš et al., 2009a; Brooks et al., 2009; Crain et al., 2010a).
Although both analytic and semi-analytic studies of galaxy formation usually assume spherical symmetry (e.g. Binney, 1977; White & Frenk, 1991; Birnboim & Dekel, 2003), numerical simulations show different geometries. As the matter in the Universe collapses, it forms a network of sheets and filaments, the so-called ‘cosmic web’. Galaxies form in the densest regions, the most massive galaxies where filaments intersect. These structures can have an important effect on gas accretion. If a galaxy is being fed along filaments, the average density of the accreting gas will be higher. The cooling time will thus be smaller and it will be easier to radiate away the gravitational binding energy. Filaments may therefore feed galaxies preferentially through cold accretion. Both modes can coexist. Especially at high redshift, cold streams penetrate the hot virialized haloes of massive galaxies (Kereš et al., 2005; Dekel & Birnboim, 2006; Ocvirk et al., 2008; Kereš et al., 2009a; Dekel et al., 2009a).
Galaxy colours and morphologies are observed to be roughly bimodal. They can be divided into two main classes: blue, star forming spirals and red, passive ellipticals (e.g. Kauffmann et al., 2003; Baldry et al., 2004). The latter tend to be more massive and to reside in clusters. It has been suggested by Dekel & Birnboim (2006) that this observed bimodality is caused by the two different mechanisms for gas accretion. If, for example, feedback from active galactic nuclei (AGN) were to prevent the hot gas from cooling, massive galaxies with little cold accretion would have very low star formation rates. If, on the other hand, cold accretion flows were less susceptible to such feedback, then low-mass haloes could host discs of cold gas, which could form stars efficiently. However, this cannot be the whole story, because suppressing star formation from gas accreted in the hot mode is not nearly sufficient to reproduce the observations (Kereš et al., 2009b).
feedback. Some of these processes had been ignored by earlier studies. For ex-ample, Kereš et al. (2005, 2009a,b) ignored metal-line cooling and SN feedback. Using a semi-analytic model, Benson & Bower (2010) emphasized the impor-tance of including the effect of feedback. Brooks et al. (2009) did not include metal-line cooling, but did include SN feedback. Ocvirk et al. (2008) included both metal-line cooling and weak SN feedback, but could only study the high-redshift behaviour as their simulation was stopped atz ≈ 1.5. AGN feedback was not included by any previous study, although Khalatyan et al. (2008) did show the existence of cold accretion in a simulation of a single group of galaxies with AGN feedback. In contrast to previous work, we distinguish between ac-cretion onto haloes and acac-cretion onto galaxies (i.e. the interstellar medium, or ISM). We find that while hot mode accretion dominates the growth of high-mass haloes, cold mode accretion is still most important for the growth of the galaxies in these haloes. The different physical models give similar results for accretion onto haloes, implying that the results are insensitive to feedback processes, but the inclusion of such processes is important for accretion onto galaxies.
This paper is organized as follows. The simulations are described in Sec-tion 2.2, including all the model variaSec-tions. In SecSec-tion 2.3 we describe some properties of the gas in the temperature-density plane for our fiducial simula-tion. The ways in which haloes are identified and gas accretion is determined is discussed in Section 2.4. The accretion rates for all simulations can be found in Section 2.5, for accretion onto haloes as well as for accretion onto galaxies. In Section 2.6 we compare hot and cold accretion onto haloes for the different sim-ulations and we do the same for accretion onto galaxies in Section 2.7. Finally, we compare our results with previous work in Section 2.8 and summarize our conclusions in Section 2.9.
2.2
Simulations
To investigate the temperature distribution of accreted gas, we use a modified version ofgadget-3 (last described in Springel, 2005b), a smoothed particle hy-drodynamics (SPH) code that uses the entropy formulation of SPH (Springel & Hernquist, 2002), which conserves both energy and entropy where appropriate. This work is part of the OWLS (Schaye et al., 2010) project, which consists of a large number of cosmological simulations, with varying (subgrid) physics. We first summarize the subgrid prescriptions for the reference simulation. The other simulations are described in Section 2.2.1. As the simulations are fully described in Schaye et al. (2010), we will only summarize their main properties here.
The cosmological simulations described here assume a ΛCDM cosmology
with parameters as determined from the Wilkinson microwave anisotropy probe year 3 (WMAP3) results, Ωm = 1−ΩΛ = 0.238, Ωb = 0.0418, h = 0.73,
σ8 = 0.74, n = 0.951. These values are consistent1 with the WMAP year 7
G
as
ac
cr
et
io
n
on
to
g
al
ax
ie
s
an
d
h
al
oe
s
final simulation redshift, number of resolved haloes (containing more than 250 dark matter particles) atz=2 (Nhalo(z=2)), and number of resolved haloes (containing more than 250 dark matter particles) atz=0 (Nhalo(z=0)).
simulation Lbox N mDM mgas zfinal Nhalo(z=2) Nhalo(z=0)
(h−1Mpc) (M
⊙) (M⊙)
L100N512 100 5123 5.56×10⁸ 1.19×10⁸ 0 10913 18463 L100N256 100 2563 4.45×10⁹ 9.84×10⁹ 0 838 2849 L050N512 50 5123 6.95×10⁷ 1.48×10⁷ 0 12648 15884 L025N512 25 5123 8.68×10⁶ 1.85×10⁶ 2 12768
-L025N256 25 2563 6.95×10⁷ 1.48×10⁷ 2 1653
-L025N128 25 1283 5.56×10⁸ 1.19×10⁸ 0 159 338
data (Komatsu et al., 2011).
A cubic volume with periodic boundary conditions is defined, within which the mass is distributed over N3 dark matter and as many gas particles. The
box size (i.e. the length of a side of the simulation volume) of the simulations used in this work is 25, 50, or 100 h−1Mpc, with N = 512, unless stated oth-erwise. The (initial) particle masses for baryons and dark matter are 1.2× 10⁸( Lbox
100 h−1Mpc)3(512N )−3M⊙ and 5.6×10⁸(100 hLbox−1Mpc)3(512N )−3M⊙, respectively, and are listed in Table 2.1, as are the number of resolved haloes atz = 2 and
z= 0. We use the notation L***N###, where*** indicates the box size and ###
the number of particles per dimension. The gravitational softening length is 7.8( Lbox
100 h−1Mpc)(512N )−1h−1kpc comoving, i.e. 1/25 of the mean dark matter par-ticle separation, but we imposed a maximum of 2 ( Lbox
100 h−1Mpc)(512N )−1 h−1kpc
proper.
The primordial abundances are X = 0.752 andY = 0.248, where X and Y
are the mass fractions of hydrogen and helium, respectively. The abundances of eleven elements (hydrogen, helium, carbon, nitrogen, oxygen, neon, magnesium, silicon, sulphur, calcium, and iron) released by massive stars (type II SNe and stellar winds) and intermediate mass stars (type Ia SNe and asymptotic giant branch stars) are followed as described in Wiersma et al. (2009b). We assume the stellar initial mass function (IMF) of Chabrier (2003), ranging from 0.1 to 100 M⊙. As described in Wiersma et al. (2009a), radiative cooling and heating are com-puted element-by-element in the presence of the cosmic microwave background radiation and the Haardt & Madau (2001) model for the UV/X-ray background from galaxies and quasars.
Star formation is modelled according to the recipe of Schaye & Dalla Vecchia (2008). The Jeans mass cannot be resolved in the cold ISM, which could lead to artificial fragmentation (e.g. Bate & Burkert, 1997). Therefore a polytropic equa-tion of statePtot∝ ρ4/3gas is implemented for densities exceeding nH =0.1 cm−3, where Ptot is the total pressure and ρgas the density of the gas. It keeps the Jeans mass fixed with respect to the gas density, as well as the ratio of the Jeans length and the SPH smoothing kernel. Gas particles with proper den-sitiesnH ≥0.1 cm−3and temperaturesT ≤105K are moved onto this equation of state and can be converted into star particles. The star formation rate (SFR) per unit mass depends on the gas pressure and is set to reproduce the observed Kennicutt-Schmidt law (Kennicutt, 1998).
Feedback from star formation is implemented using the prescription of Dalla Vecchia & Schaye (2008). About 40 percent of the energy released by type II SNe is injected locally in kinetic form. The rest of the energy is assumed to be lost radiatively. Each gas particle within the SPH smoothing kernel of the newly formed star particle has a probability of being kicked. For the reference model, the mass loading parameterη = 2, meaning that on average the total mass of
G
as
ac
cr
et
io
n
on
to
g
al
ax
ie
s
an
d
h
al
oe
s
and particle number, from Table 2.1, used with these simulation parameters (LboxandN).
simulation Z cool vwind η AGN Lboxand N
(km/s)
REF yes 600 2 no all listed in Table 2.1
NOSN yes 0 0 no L100N512atz=2
NOSN_NOZCOOL no 0 0 no L100N512, L025N512
NOZCOOL no 600 2 no L100N512, L025N512
WML4 yes 600 4 no L100N512, L025N512
WML1V848 yes 848 1 no L100N512, L025N512
DBLIMF- yes 600 & 1618 2 no L100N512, L025N512 CONTSFV1618
WDENS yes density dependent no L100N512, L025N512
AGN yes 600 2 yes L100N512, L025N512
the winds sweep up surrounding material, the effective mass loading can be higher. The initial wind velocity is 600 km/s for the reference model, which is consistent with observations of starburst galaxies, both locally (Veilleux et al., 2005) and at high redshift (Shapley et al., 2003). Schaye et al. (2010) showed that these parameter values yield a peak, global star formation rate density that agrees with observations.
The simulation data is saved at discrete output redshifts with interval∆z=
0.125 at 0≤z≤0.5,∆z=0.25 at 0.5<z≤4, and∆z=0.5 at 4<z≤9. This is
the time resolution used for determining accretion rates.
2.2.1
Model variations
To see whether or not our results are sensitive to specific physical processes or subgrid prescriptions, we have performed a suite of simulations in which many of the simulation parameters are varied. These are listed in Table 2.2.
The importance of metal-line cooling can be demonstrated by comparing the reference simulation (REF) to a simulation in which primordial abundances are
assumed when calculating the cooling rates (NOZCOOL). Similarly, the effect of
including SN feedback can be studied by comparing a simulation without SN feedback (NOSN) to the reference model. Because the metals cannot be expelled
without feedback, they pile up, causing efficient cooling and star formation. To limit the cooling rates, we performed a simulation in which both cooling by metals and feedback from SNe were ignored (NOSN_NOZCOOL). Simulation NOSN_L025N512was stopped just below z = 4 and the z= 0.125 snapshot is missing forNOSN_L100N512. We therefore cannot always show results for this
simulation.
In massive haloes the pressure of the ISM is too high for winds with velocities of 600 km/s to blow the gas out of the galaxy (Dalla Vecchia & Schaye, 2008). Keeping the wind energy per unit stellar mass constant, we increased the wind velocity by √2 tovwind =848 km/s, while halving the mass loading to η = 1 (WML1V848). To enable the winds to eject gas from haloes with even higher
masses, the velocity and mass loading can be scaled with the local sound speed, while keeping the energy injected per unit stellar mass constant (WDENS).
To investigate the dependence on SN energy given to the ISM, we ran a simulation using almost all of the energy available from SNe. The wind mass loadingη=4, a factor of two higher than in the reference simulation. The wind velocity is the same,vwind=600 km/s (WML4).
There is some evidence that the IMF is top-heavy in extreme environments, like starburst galaxies (e.g. Padoan et al., 1997; Klessen et al., 2007; Dabring-hausen et al., 2009). We have performed a simulation in which the IMF is top-heavy for stars formed at high pressures,Ptot/kB >1.7×105cm−3K, wherekB
winds. More energy is therefore put into the winds blown by these star parti-cles,vwind =1618 km/s andη=2 (DBLIMFCONTSFV1618).
Finally, we have included AGN feedback (AGN). Black holes inject 1.5% of
the rest-mass energy of the accreted gas into the surrounding matter in the form of heat. The model is described and tested in Booth & Schaye (2009), who also demonstrate that it reproduces the observed mass density in black holes and the observed scaling relations between black hole mass and both central stellar velocity dispersion and stellar mass. McCarthy et al. (2010) have shown that our model AGN reproduces the observed stellar mass fractions, SFRs, stellar age distributions and thermodynamic properties of galaxy groups.
2.2.2
Maximum past temperature
The Lagrangian nature of the simulation is exploited by tracing each fluid el-ement back in time, which is particularly convenient for this project, in which we are studying the temperature history of accreted gas. During the simula-tions the maximum temperature,Tmax, and the redshift at which it was reached,
zmax, were stored in separate variables. The variables were updated for each SPH particle at every time step for which the temperature was higher than the previous maximum temperature. The artificial temperature the particles obtain when they are on the equation of state (i.e. when they are part of the unresolved multiphase ISM) was ignored in this process. This may cause us to underesti-mate the maximum past temperature of gas that experienced an accretion shock at higher densities. Ignoring such shocks is, however, consistent with our aims, as we are interested in the maximum temperature reachedbeforethe gas entered
the galaxy.
Shock heating could be missed if the particle heats and cools rapidly in a sin-gle time step. In SPH simulations, a shock is smeared out over a few smoothing lengths, leading to in-shock cooling (Hutchings & Thomas, 2000). We find the average value for the infall velocity to be∼5×10² M
1013 M⊙
1/3
(1+z)1/2km/s. On average the SPH smoothing length at halo accretion is ∼ 102 kpc (comov-ing) for all L100N512 simulations and at all redshifts. The particle will take
108 M 1013 M⊙
−1/3
(1+z)−3/2years to traverse this distance. A shock will there-fore take at least a few times 108years. In reality the accretion shock will pro-ceed almost instantaneously, minimizing radiative losses. In the simulations described here gas cools at each time step, so also while it is being shocked. The finite spatial resolution can thus result in lower maximum temperatures than the actual post-shock temperatures. If this effect were important, increasing the resolution would increase the hot fraction, i.e. the fraction of the gas that is ac-creted in the hot mode, because the accretion shocks would be less broadened. The opposite is the case, as we will show in Figure 2.9.
S
im
u
la
tio
n
s
the different phases of the gas. Gas withT&10 K has been shock heated. TheT−ρrelation for cold, low-density gas (T.10 K and ρ.10hρiis set by heating by the UV background and adiabatic cooling. Atρ/hρi>101.5radiative cooling dominates over cooling by the
expansion of the Universe. Gas withnH>0.1 cm−3(ρ/hρi>104.3atz=2) is assumed to be part of the unresolved, multiphase ISM and
is put on an effective equation of state. The ‘temperature’ of this gas merely reflects the pressure of the multiphase ISM and is therefore not used to updateTmax. The scatter in the equation of state is caused by adiabatic cooling of inactive particles in between time steps. Gas that is condensing onto haloes or inside haloes hasTmax&104.5K, which reflects the peak in the T-ρrelation (atρ/hρi>101.5,T∼104.5K)
visible in the left panel.
temperatures in the post-shock gas, because they differ in mass, an effect that we have not included. It will take a short while before they equilibrate through collisions or plasma effects. Another effect, which is also not included in our simulations, is that shocks may be preceded by radiation from the shock, which may affect the temperature evolution.
2.3
The temperature-density distribution
The left-hand panel of Figure 2.1 shows the mass-weighted distribution of gas in the temperature-density plane atz=2 for simulationREF_L050N512. Gas with
densities up to∼102times the cosmic average density represents the diffuse in-tergalactic medium (IGM). A significant fraction of this gas resides in filamentary structures. It can be heated to temperatures above 105K when kinetic energy, generated by gravitational infall or galactic winds, is converted into thermal en-ergy. We refer to this tenuous, shock-heated gas as the warm-hot intergalactic medium (WHIM). The intracluster medium (ICM) is the very hotT&107K gas
located in galaxy groups and clusters. Gas at overdensities ρ/hρi & 102, but
much lower temperatures (T∼104K) resides mostly in filaments and low-mass haloes.
Most of the gas is located in the purple region, withρ/hρi<10. The
temper-ature of this gas is determined by the combination of photoheating by the UV background and adiabatic cooling by the expansion of the Universe. Although the slope of this temperature-density relation is close to adiabatic, it is actually determined by the temperature dependence of the recombination rate (Hui & Gnedin, 1997).
The turnover density, above which the typical gas temperatures decrease, occurs when radiative cooling starts to dominate over adiabatic cooling. The overdensity at which this happens depends on redshift. At z = 2 it occurs
at ρ/hρi ≈ 101.5. The distribution of the WHIM (broad red region, with T > 105K) is set in part by the cooling function, to which especially heavier atoms, like oxygen, contribute. In particular, the lack of dense gas (ρ/hρi&103) with
105K.T.107K is due to radiative cooling.
Gas with proper hydrogen number density nH > 0.1 cm−3, corresponding
at this redshift to overdensity ρ/hρi > 104.3, represents the ISM. This
high-density gas is put on an equation of state if its temperature was below 105 K when it crossed the density threshold, because the cold and warm phases of this dense medium are not resolved by the simulations. Therefore, the temperature merely reflects the imposed effective pressure and the density should be inter-preted as the mean density of the unresolved multi-phase ISM. The spread in the temperature-density relation on the equation of state is caused by the adiabatic extrapolation of inactive particles between time steps. In addition, the relation is broadened by differences in the mean molecular weight,µ, of the gas, which
reached atz≥2, as a function of thez=2 baryonic overdensity. All dense gas
has reached temperatures of&104.5K at some point. Dense (ρ/hρi>101.5) gas
cannot haveTmaxmuch below 104.5K, because of photoheating2. The maximum past temperature tends to remain constant once the gas has reached densities
& 102hρi, resulting in the horizontal trend in the figure. There is no dense
ρ/hρi ∼ 104gas at the highest maximum temperatures (above 107 K), because the cooling time of gas that is heated to this temperature at lower densities (ρ/hρi ∼102−3) is longer than a Hubble time, preventing it from cooling and reaching higher densities.
The maximum past temperature reached for dense gas depends on whether the gas has been heated to the virial temperature of its halo and on whether it has been shock-heated by galactic winds.
2.4
Defining gas accretion
To see how haloes accrete gas, we first need to find and select the haloes. This can be done in several different ways and we will discuss three of them. Although we choose to use the one based on the gravitational binding energy, our results are insensitive to the halo definition we use. Finally, we link haloes in two subsequent snapshots in order to determine which gas has entered the haloes.
2.4.1
Identifying haloes and galaxies
The first step towards finding gravitationally bound structures is to identify dark matter haloes. These can for example be found using a Friends-of-Friends (FoF) algorithm. If the separation between two dark matter particles is less than 20% of the average separation (the linking length b = 0.2), they are placed in the same group. Because the particles all have the same mass, a fixed value ofbwill
correspond to a fixed overdensity at the boundary of the group of ρ/hρi ≈ 60 (e.g. Frenk et al., 1988). Assuming a radial density profile ρ(r) ∝ r−2,
corre-sponding to a flat rotation curve, such a group has an average overdensity of hρhaloi/hρi ≈180 (e.g. Lacey & Cole, 1994), close to the value for a virialized ob-ject predicted by the top-hat spherical collapse model (e.g. Padmanabhan, 2002). The minimum number of dark matter particles in a FoF group is set to 25. Many of the smallest groups will not be gravitationally bound. Baryonic particles are placed in a group if their nearest dark matter neighbour is part of the group.
Problems arise because unbound particles can be attached to a group, phys-ically distinct groups can be linked by a small (random) particle bridge, and be-cause substructure within a FoF halo is not identified. We usesubfind(Springel et al., 2001; Dolag et al., 2009) on the FoF output to find the gravitationally bound particles and to identify subhaloes. The properties of gas that is being accreted are expected to depend on the properties of the parent (or main) halo in which
2Exceptions are gas that reached high densities before reionization, which happens atz=9 in
the subhaloes are embedded. We therefore only look at accretion onto these main haloes and exclude gas accretion by satellites.
Another way of defining haloes is to use a spherical overdensity criterion. The radiusRvir, centred on the most bound particle of a FoF halo, is found within which the average density agrees with the prediction of the top-hat spherical collapse model in aΛCDM cosmology (Bryan & Norman, 1998). All the particles
withinRvir are then included in the halo.
We chose to use only main haloes identified bysubfind, but we have checked that our results do not change significantly when using FoF groups or spherical overdensities instead.
Except for Figures 2.2, 2.9, and 2.15, we include only main haloes containing more than 250 dark matter particles in our analysis of halo accretion. This cor-responds to a minimum total halo mass ofMhalo≈1011.2M⊙in the 100h−1Mpc box, 1010.3M
⊙ in the 50h−1Mpc box, and 109.4M⊙ in the 25h−1Mpc box. For these limits our mass functions agree very well with the Sheth & Tormen (1999) fit.
For each resolved halo, we identify the ISM of the central galaxy with the star forming (i.e.nH >0.1 cm−3) gas particles in the main halo which are inside 15%
of the virial radius (Sales et al., 2010). We use 15% of the virial radius to exclude small star forming substructures in the outer halo, which are not identified by subfind. Gas accretion onto satellite galaxies is excluded.
Because the galaxy is much smaller than its parent halo, it is not as well resolved. When investigating accretion onto galaxies (as opposed to haloes), we therefore impose a 1000 dark matter particle limit, corresponding to a minimum total halo mass of Mhalo ≈ 1011.8 M⊙ in the 100 h−1Mpc box, 1010.9 M⊙ in the 50 h−1Mpc box, and 1010.0 M⊙ in the 25 h−1Mpc box. The exceptions are Figure 2.2 and 2.15, which show accretion rates and hot fractions down to 1 dex below this limit. See Section 2.5 for more discussion on convergence.
2.4.2
Selecting gas particles accreted onto haloes
We select gas particles accreted onto haloes as follows. For each halo atz= z2 (which we will also refer to as ‘the descendant’) we identify its progenitor at the previous output redshiftz1>z2. We determine which halo contains most of the
descendant’s 25 most bound dark matter particles and refer to this halo as ‘the progenitor’. If the fraction of the descendant’s 25 most bound particles that was not in any halo atz1is greater than the fraction that was part of the progenitor, then we discard the halo from our analysis, which rarely happens above our resolution threshold. If two or more haloes contain the same number of those 25 particles, we select the one that contains the dark matter particle that is most bound to the descendant.
We identify those particles that are in the descendant, but not in its progenitor as having been accreted atz2≤z<z1. The accreted particles have to be gaseous
z2. The accreted gas can have densities exceeding the star formation threshold, in which case it cannot obtain a higher maximum past temperature. Gas can be accreted multiple times.
To distinguish mergers from smooth accretion, we exclude accreted particles that reside in (sub)haloes above some maximum mass at redshiftz1. We would like to have a criterion that is not directly dependent on resolution, so that the same objects are included in runs with different particle numbers if the simula-tions are converged with respect to resolution. We therefore set this maximum allowed halo mass to 10% of the descendant’s (main halo) mass. Thus, smooth accretion excludes mergers with a mass ratio greater than 1:10. We experimented with different thresholds and the results are insensitive to this choice.
2.4.3
Selecting gas particles accreted onto galaxies
We consider particles that are part of the ISM or stellar at z2, and that were gaseous but not part of the ISM at z1, to have been accreted onto a galaxy at
z2 ≤ z < z1. Gas can be accreted multiple times. Accretion onto the ISM and
accretion onto a galaxy are the same in this study and these terms are used interchangeably.
In this way, accretion through galaxy mergers is automatically excluded, be-cause the gas that is part of the ISM of another galaxy atz1is excluded. We can allow for mergers by identifying those particles that are in the galaxy atz2, but were not in the progenitor galaxy atz1.
2.5
Total gas accretion rates
For brevity, accretion between, for example,z=2.25 andz= 2 will be referred
to as accretion just beforez=2.
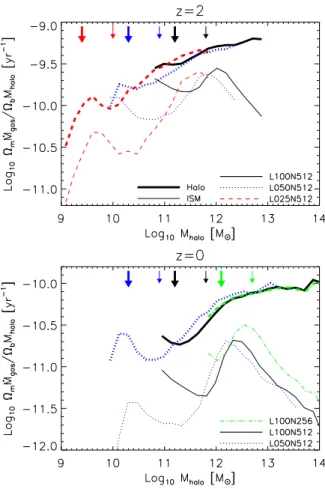
The average total gas accretion rate of a halo depends on its mass. Figure 2.2 shows the average specific accretion rates ΩmM˙gas/ΩbMhalo, where Ωm and
Ωb are the matter and baryon density parameters, respectively, as a function of
halo mass forz=2 (top panel) andz=0 (bottom panel) for haloes containing at least 100 dark matter particles for various simulations using the reference model. Thick curves show the specific accretion rates onto haloes. We have divided the gas accretion rate by the total halo mass and baryon fractionΩb/Ωm, so that the
normalization gives an estimate of the time it would take a halo to grow to its current mass with the current accretion rate.
Figure 2.2: Specific gas smooth accretion rates ontohaloes (higher, thick curves) and
centralgalaxies(lower, thin curves) against total halo mass atz=2 (top panel) andz=0 (bottom panel). The normalization for halo accretion gives an estimate of the time it would take a halo to grow to its current mass at the current accretion rate. The same is not true for galaxy accretion, since we use the same normalization as for halo accretion. Both panels show simulations spanning a factor 64 in mass resolution. Each mass bin contains at least 10 haloes. Big (small) arrows correspond to the adopted resolution limit for accretion onto haloes (galaxies) forL025N512(red),L050N512(blue),L100N512(black)
andL100N256(green). The specific halo accretion rate is converged and increases slightly
with halo mass. The specific galaxy accretion rate is not fully converged at z= 2, but the convergence is better atz = 0. The galaxy accretion rate increases with halo mass forMhalo <1012 M⊙ and decreases with halo mass for higher halo masses. It is much
Comparing the three thick curves in each panel, we see that the specific halo accretion rate is converged with the numerical resolution. It increases with halo mass, especially at low halo masses. The specific galaxy accretion rate (thin curves) is not fully converged atz= 2, but the convergence improves atz= 0 (compare the two highest resolutions, dotted and solid curve, at the high mass end). BelowMhalo < 1012 M⊙ the specific galaxy accretion rate increases more
steeply with halo mass than the specific halo accretion rate. Above this halo mass, the specific galaxy accretion rate decreases steeply, whereas the rate keeps increasing for haloes. The accretion rate onto galaxies is always much lower than the halo accretion rate and this difference is larger atz=0. Hence, only a small fraction of the gas accreted onto haloes ends up in galaxies and the efficiency of galaxy formation is highest in haloes withMhalo≈1012M⊙.
The dynamic range covered by these simulations is very large, because we use different box sizes. The resolution increases with decreasing box size. We have performed box size convergence tests (at fixed resolution), but do not show them as the convergence with box size is excellent for all halo masses. Increasing the resolution shows that the halo accretion rates are not fully converged around the 100 particle resolution threshold adopted in Figure 2.2. In this regime, halo mergers cannot always be identified. In the rest of this paper, we therefore set the minimum halo mass for accretion onto haloes to correspond to 250 dark matter particles, as indicated by the big arrows.
The galaxy accretion rates diverge at the low-mass end. This is expected, because haloes with 100 dark matter particles will have very few star forming gas particles and because 15% of the virial radius is close to the spatial resolution limit. We will therefore only include the haloes where 15% of the virial radius is larger than 5 times the softening length and therefore consisting of at least 1000 dark matter particles, as indicated by the small arrows. The galaxy accretion rates at the high-mass end are not completely converged atz=2. The accretion
rate decreases by up to a factor of two if the mass resolution is increased by a factor of 64. With increasing resolution, more gas reaches higher densities. If this gas becomes star forming before accreting onto the central galaxy, it is not included in the smooth accretion rate. If we instead include galaxy mergers (not shown), which increases the accretion rate for high-mass galaxies slightly, then the results are in fact fully converged for the 50 and 25h−1Mpc box.
The bottom panel shows that the convergence is better atz=0.