Evaluation of Fecal Contamination by Seagulls in an Urban Estuarine Environment Using Microbiological and Molecular Approaches
Jennifer Leigh Murphy
A dissertation submitted to the faculty of the University of North Carolina at Chapel Hill in partial fulfillment of the requirements for the degree of Doctor of Philosophy in the
Department of Environmental Sciences and Engineering.
Chapel Hill 2006
ABSTRACT
JENNIFER LEIGH MURPHY: Evaluation of Fecal Contamination by Seagulls in an Urban Estuarine Environment Using Microbiological and Molecular Approaches
(Under the direction of Mark D. Sobsey, Ph.D.)
Wild birds are important non-point sources of fecal contamination of surface waters, as they have been reported to excrete large amounts of fecal indicator bacteria and occasionally harbor enteric pathogens, such as Campylobacter and Salmonella. Hundreds of waterfowl frequent the sandflats within Talbert Marsh, a constructed wetland in Orange County, CA, on a daily basis for nesting and feeding purposes. The focus of this study was on the role of seagull fecal contamination as a potentially important contributor to the non-point sources of fecal contamination into Talbert Marsh waters, which eventually flow into the recreational surf-zone at Huntington Beach. Using traditional microbiological methods, Salmonella,
TABLE OF CONTENTS
Page
LIST OF TABLES...vii
LIST OF FIGURES...ix
CHAPTER I Introduction Introduction to Study...1
Introduction to Study Site...8
Introduction to Microbes...24
Introduction to Methods Used in this Study...37
Summary...45
References...49
II Evaluation of Fecal Contamination by Seagulls in an Urban Estuarine Environment Using Microbiological Methods Introduction...58
Background...59
Objectives...73
Approaches...74
Data Management and Statistical Analyses...94
Results...95
Discussion...113
Conclusion...127
References...154
III Molecular Analysis of Stored Campylobacter Isolates Originating from Seagull Feces and Water of an Estuarine Environment Introduction...160
Background...161
Objectives...176
Approaches...176
Methods...177
Results...186
Discussion...193
References...211
IV Molecular Analysis of F+ Coliphages Isolated from Seagull Feces and Water of an Estuarine Environment Introduction...215
Background...215
Objectives...227
Approaches...227
Methods...227
Results...233
References...256 V Final Discussion...260
LIST OF TABLES
Table Page
1.1. Isolation rates of Campylobacter from diarrhea specimens
from <5-year-olds in selected developing countries...48
2.1. Reported Salmonella carriage rates in seagull feces...142
2.2. Reported Campylobacter carriage rates in seagull feces...142
2.3. Antimicrobials, dilution ranges, and MIC breakpoints...143
2.4. Seagull feces sample collection data...144
2.5. Microbes isolated from Talbert Marsh seagull feces samples...144
2.6. Antimicrobial susceptibility testing of Salmonella isolates...145
2.7. Intermediately-resistant and resistant Salmonella isolates...145
2.8. PFGE and MIC results for Salmonella isolates...146
2.9. Estimated stored Campylobacter cell counts...147
2.10. Salmonella in Talbert Marsh seagull feces, by season...147
2.11. Campylobacter in Talbert Marsh seagull feces, by season...147
2.12. F+ coliphages in Talbert Marsh seagull feces, by season...147
2.13. Dunn’s post-test on microbial concentrations in seagull feces, by season... ...148
2.14. Occurrence of Salmonella and Campylobacter in seagull feces...148
2.15. Occurrence of Campylobacter and F+ coliphages in seagull feces...148
2.16. Occurrence of F+ coliphages and Salmonella in seagull feces...149
2.18. Microbes isolated from Talbert Marsh water samples...150
2.19. F+ coliphage concentrations in positive water samples...150
2.20. Campylobacter in Talbert Marsh water samples, by season...150
2.21. F+ coliphages in Talbert Marsh water samples, by season...151
2.22. E. coli in Talbert Marsh water samples, by season...151
2.23. Occurrence of E. coli and Campylobacter in water samples...151
2.24. Occurrence of F+ coliphages and Campylobacter in water samples...151
2.25. Occurrence of E. coli and F+ coliphages in water samples...152
2.26. Presence or absence of each microbe in Talbert Marsh water samples... ...152
2.27. Campylobacter in Talbert Marsh water samples, by location...153
2.28. F+ coliphages in Talbert Marsh water samples, by location...153
2.29. E. coli in Talbert Marsh water samples, by location...153
3.1. Presumptive culture-positive Campylobacter in samples analyzed...209
3.2. Multiplex PCR results...209
3.3. C. lari PCR results...209
3.4. Published sequences used for comparison of Campylobacter isolated from Talbert Marsh seagull feces...210
4.1. Oligonucleotides for detection and genotyping of F+ coliphages used in this study...254
4.2. Presumptive positive F+ coliphages in samples analyzed...254
4.3. F-RNA RT-PCR and F-DNA PCR results for samples analyzed...255
LIST OF FIGURES
Figure Page
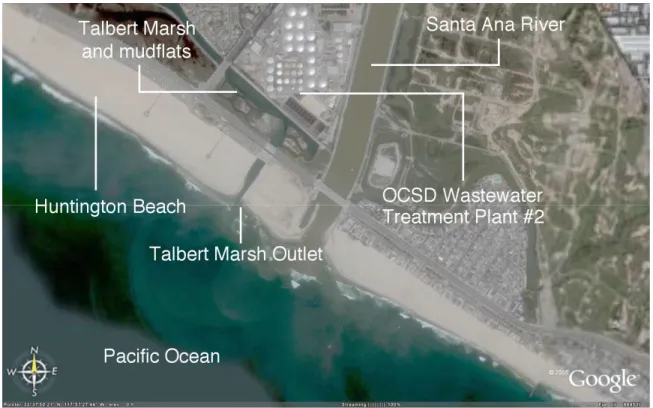
1.1. Talbert Watershed boundaries (D) and schematic of 3 flood control channels, Huntington Beach Channel,
Talbert Channel, and Fountain Valley Channel...46
1.2. Talbert Marsh and surrounding environment...47
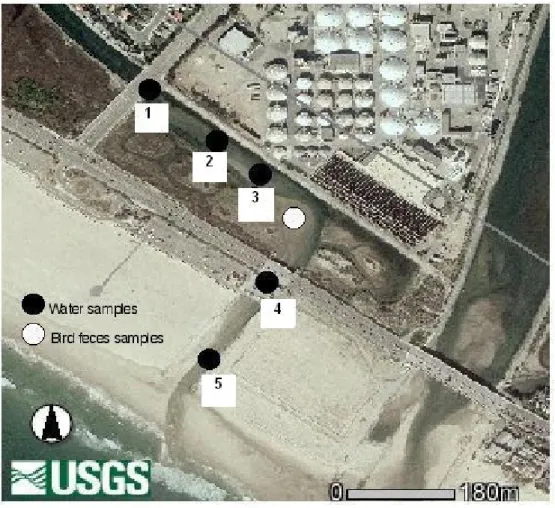
2.1. Sample locations in Talbert Marsh...131
2.2. Schematic of cell counting analysis...132
2.3. Salmonella, Campylobacter, and F+ coliphages in Talbert Marsh seagull feces...133
2.4. Salmonella antimicrobial susceptibility testing results...134
2.5. Salmonella versus Campylobacter concentrations in Talbert Marsh seagull feces (MPN/g...135
2.6. F+ coliphage versus Campylobacter concentrations in Talbert Marsh seagull feces (MPN/g...136
2.7. Salmonella versus F+ coliphage concentrations in Talbert Marsh seagull feces (MPN/g...137
2.8. Campylobacter, F+ coliphages, fecal coliforms, E. coli, and enterococci in Talbert Marsh water samples...138
2.9. E. coli versus F+ coliphage concentrations in Talbert Marsh water samples (MPN/L...139
2.10. Campylobacter versus F+ coliphage concentrations in Talbert Marsh water samples (MPN/L...140
2.11. Campylobacter versus E. coli concentrations in Talbert Marsh water samples (MPN/L...141
3.1. BLAST results for multiplex primers...203
3.3. BLAST results for Therm 4 primer...207
3.4. Phylogenetic tree of a subset of thermotolerant Campylobacter nucleotide sequences...208
4.1. Major families of bacteriophages...249
4.2. Allolevivirus nucleotide sequence analysis...250
4.3. Levivirus nucleotide sequence analysis...251
4.4. Comparison of nucleotide sequences of MS2-like (G I) coliphage isolates from Talbert Marsh seagull feces and water samples...252
CHAPTER 1
Introduction
Introduction to Study
Ocean waters along the U.S. coastline receive pollutants from both point sources and non-point sources. Over the last 30 years, there has been a focus on identifying and controlling pollutants from point sources, such as those in effluent discharges into coastal receiving waters by industries and sewage treatment plants. As a result, concentrations of these pollutants have decreased significantly. However, water quality in and near heavily urbanized areas remains poor due to non-point sources of pollution (National Research Council 1993). Non-point source pollution arises when water in the form of street cleaning, “rainfall, snowmelt, or irrigation runs over land or through the ground, picks up pollutants, and deposits them into rivers, lakes, and coastal waters or introduces them into ground water (U.S. Environmental Protection Agency 2004).” The United States Environmental Protection Agency (US EPA) states that non-point source pollution is the leading reason that 40 percent or more of our Nation’s waters are not clean enough for basic uses such as fishing or swimming (U.S. Environmental Protection Agency 2004).
receiving waters. Recent reports state that urban runoff is the principal source of impairments to estuarine systems and rapid growth in coastal towns and cities will increasingly degrade coastal receiving waters (U.S. Environmental Protection Agency 2004). Urban runoff is not only responsible for pollutants such as increased sediments and nutrients, but it is also an important source of microbial pollution in nearshore regions, wetlands, marshes, and estuaries (Sanders, Horne et al. 1999; U.S. Environmental Protection Agency 2004). Improperly-managed waste and broken or decaying sewage pipes may release large quantities of bacteria, viruses, and protozoans into the surrounding environment. Urban runoff can have great influence on both the fate and transport of these microbes into the water cycle and can adversely affect both the health of coastal ecosystems and human populations found in these environments (Sanders, Horne et al. 1999).
urban runoff but, among a number of other purposes, to create a wildlife habitat (Santa Ana Watershed Project Authority 2004).
Tidally influenced constructed wetlands, such as Talbert Marsh, can be designed and managed to optimize pathogen inactivation. Slow flow velocities (<0.7 m/s) and long residence times of water (10 h) are conditions in which freshwater wetlands have been found to operate most effectively (Grant, Sanders et al. 2001). In marine wetlands, these conditions may further minimize or prevent contamination because of longer exposure to salt water and UV light, both of which have activity against bacteria, viruses, and protozoan parasites. However, Talbert Marsh is highly dynamic system whose water flow is dominated by semidiurnal, unequal tides, so water velocities and residence times greatly vary. Not only are there four daily tidal extremes, but the period of tidal range fluctuation from maximal to minimal and back to maximal (also know as the spring-neap-spring transition) oscillates over 14-15 days. Furthermore, pump stations determine whether inland runoff is intermittently discharged into drainage channels, diverted into the regional sanitary sewer system, or stored in pump station forebays (Grant, Sanders et al. 2001).
with non-swimmers (Pruss 1998). Significant beach usage and surf zone pollution along this coastline implies that many people may acquire gastrointestinal or other types of illness from swimming and surfing in this area each year (Kim, Grant et al. 2004). Furthermore, numerous beach closures have led to a large loss of revenue to resident businesses and public outcry over the loss of popular bathing areas (Sanders, Horne et al. 1999).
The focus of this study was on the role of seagull fecal contamination as a potentially important contributor to the non-point sources of fecal contamination and in particular
Campylobacter species and Salmonella species as bacterial pathogens potentially present in this system. As discussed in Chapter II, two common human bacterial pathogens harbored by birds are Salmonella and Campylobacter, both of which can cause gastrointestinal illness. Additionally, the presence of fecal indicator microbes, such as fecal coliforms, Escherichia coli, enterococci, and F+ coliphages, was assessed. These microbes are commonly found in the feces of warm-blooded animals and have similar structure and persistence in the environment as many human pathogenic enteric bacteria and viruses, respectively (Gerba 1987). Finally, microbial source tracking methods were employed in this study. Identifying sources of fecal contamination as human or animal in origin is becoming a more important tool in decision making to manage fecal contamination of water as the analytical methods for such source tracking improve and become further validated.
(Sanders, Horne et al. 1999).” A key aspect of the novel strategy was to manage the water flow of the marsh and its adjacent surface waters in ways that would minimize impacts on the microbial quality of adjacent ocean beach water. However, potential control measures based on manipulating the marsh system and its release of fecally contaminated water must first be based on reliable identification and quantification of fecal contamination and its sources and how and when this contamination is introduced into the system. In addition to determining presence and concentrations of these microbes in the feces of waterfowl, microbial source tracking methods must be used to determine the source of fecal pathogens in the surrounding marsh waters.
Overall Research Questions
• Do the feces of seagulls in Talbert Marsh contain the pathogens Salmonella and
Campylobacter and/or specific groups of F+ coliphages which serve as indicators of fecal contamination?
• Do the waters surrounding the sandflats at which seagulls and other waterfowl congregate contain the pathogens Salmonella and Campylobacter and/or the same specific groups of F+ coliphages which serve as indicators of fecal contamination? • Is it likely that the seagull population in Talbert Marsh contributes pathogens and
fecal indicators into the estuarine waters of lower Talbert Marsh that ultimately flow into the Huntington Beach surfzone? Can microbial source tracking methods, including strain-typing and genetic analysis, be used to better understand the impact waterfowl have on the Talbert Marsh environment?
Aims of Study
• To identify key bacterial pathogens and selected indicators of fecal contamination in the feces of seagulls present in Talbert Marsh
o To use conventional phenotypic and newer genotypic methods to identify and
o To use conventional phenotypic and genotypic methods to identify and
quantify indicators of fecal contamination, specifically F+ coliphages, in the feces of seagulls.
• To identify key bacterial pathogens and indicators of fecal contamination in the estuarine waters of Talbert Marsh
o To use conventional phenotypic and newer genotypic methods to identify and
quantify Salmonella and Campylobacter species in the estuarine waters of Talbert Marsh.
o To use conventional phenotypic and genotypic methods to identify and
quantify indicators of fecal contamination, specifically F+ coliphages and fecal indicator bacteria, in the estuarine waters of Talbert Marsh.
• To use microbial source tracking methods to characterize the presence and impacts of fecal contamination from seagulls in Talbert Marsh and its potential transport to and presence in the nearby estuarine waters
Overall Approaches
Individual, freshly-deposited seagull feces and estuarine water samples from Talbert Marsh were shipped at 4oC overnight to UNC-Chapel Hill laboratories so that processing could begin within 24 hours of collection. The samples were accompanied by forms providing information on samples and environmental conditions that was to be used in data analysis.
• To identify and quantify Salmonella and Campylobacter in the feces of seagulls present in Talbert Marsh, known volumes of seagull feces were submitted to a series of enrichment culture steps to resuscitate injured cells and increase target cell concentrations. Enrichments were then subcultured onto appropriate selective agars for isolation of distinct colonies and subsequent biochemical testing to phenotypically identify the bacterial complexes or species present.
Agar Layer plaque assay in which E. coli Famp host cell infection by F+ coliphages present in the feces was visualized and quantified.
• To identify and quantify Salmonella and Campylobacter in Talbert Marsh estuarine waters, known volumes of estuarine water were submitted to a series of enrichment culture steps, subcultured onto appropriate selective agars, and subsequently submitted to biochemical testing. Additionally, water samples were analyzed for fecal indicator bacteria, including fecal coliforms, Escherichia coli, and enterococci, using Colilert and Enterolert defined substrate quantal assays, respectively.
• To identify and quantify F+ coliphages in known volumes of estuarine water, two different US EPA methods were employed. Because phage concentration in the estuarine waters was unknown, one method (EPA 1601) first included an enrichment step for low concentrations of coliphages, while the other method (EPA 1602), designed for higher concentrations of coliphages, was a Single Agar Layer plaque assay method. Both methods use E. coli Famp host cell infection by F+ coliphages for detection.
• Bacteria and F+ coliphages isolated in these studies were further analyzed and characterized using genotypic methods to provide both species confirmation and microbial source tracking information.
o Salmonella isolates were subjected to antimicrobial resistance analysis and
pulsed-field gel electrophoresis (PFGE) for strain-typing and source tracking information.
o Stored Campylobacter isolates were genetically confirmed using a series of
polymerase chain reaction (PCR) assays and isolates were also further characterized using nucleotide sequence analysis.
o Finally, F+ coliphage isolates were analyzed using RT-PCR, PCR, Reverse
Line Blot nucleic acid hybridization, and nucleotide sequence analysis to identify genogroup and for microbial source tracking purposes.
Introduction to Study Site
Orange County, California
Population
in California and the 5th largest county in the country. Its population in January 2004 was slightly over 3,000,000 people and the population growth is expected to continue, with projections of nearly 3.1 million in 2005 and 3.6 million by 2030. Orange County is also one of the most densely populated areas in the United States; in January 2004, its population density was estimated at 3,822 persons per square mile, making it denser than Los Angeles County. As of 2003, the average Orange County household contained 3.0 persons, higher than both the California and United States averages (Orange County Executive Office 2004).
Climate
Southern California has a warm, dry Mediterranean climate and coastal areas have a moderate climate with frequent fog in the summer. Spring and fall months are the mildest seasons; Orange County averages 328 days of sunshine per year with an average daytime temperature of 73oF. Most of the yearly precipitation is in the form of rain during the winter months (California Tourism Commission). The Santa Ana region of southern California receives on average 15 inches of rainfall per year (California Environmental Protection Agency State Water Board 2003).
Land Use
category. Twelve percent of the county’s total land area was used for commercial, industrial, and public institutional uses and 10% was used for transportation. Only 4% of land in Orange County was used for agriculture (Orange County Executive Office 2004).
In 2003, the County’s value of agricultural production was $311.6 million. Nursery stock and cut flowers, strawberries, avocados, peppers, and green beans are the County’s top agricultural products (Orange County Executive Office 2004). The 2002 USDA Census of Agriculture indicates that Orange County had 348 farms encompassing slightly over 68,000 acres of land, with over 10,000 acres devoted to harvested cropland. The inventory of livestock within the County indicates 793 cattle and calves, 392 beef cows, 42 hogs and pigs, 67 sheep and lamb, and 195 broilers and chickens. Data on numbers of milk cows and egg-layers (20 weeks or older) was withheld to avoid disclosing data for individual farms. The numbers of all of the types of livestock were lower than that reported during the previous three censuses (United States Department of Agriculture National Agricultural Statistics Service 2002).
Pollution Sources
this region include “the offshore discharge of partially treated sewage effluent, the offshore discharge of power plant cooling water that contains fecal indicator bacteria from plant wash-down and other activities, bather shedding, the accumulation of bird droppings along the shoreline and offshore, the exfiltration of sewage-contaminated groundwater, and contributions from watershed outlets located north and south of the study area including the Los Angeles River, the San Gabriel River, and outlets for Huntington Harbor and Newport Bay (Kim, Grant et al. 2004).”
Pollution Regulation – The Ocean Plan, AB 411, and NPDES
The California Ocean Plan was adopted by the California State Water Resources Control Board (SWRCB) in 1972 and was amended in 1978, 1983, 1988, 1990, and 1997 (State Water Resources Control Board 2005). The Ocean Plan sets bacterial water quality standards for ocean waters to ensure the protection of water contact recreation and shellfish harvesting. These water quality objectives are incorporated into discharge permits issued by Regional Water Quality Control Boards (RWQCBs). The first Ocean Plan contained total and fecal coliform standards and in 1990, an enterococci monitoring requirement was added at the US EPA’s insistence that enterococci are a superior indicator of human health effects in marine waters (O'Connell and Palmer 2002). California’s current bacterial standards for contact recreation in ocean and bay waters are as follows (National Resources Defense Council 2005):
• Geometric mean of 35 enterococci (ENT)/100ml in five samples in a 30-day period or 104/100ml in a single sample (for beaches meeting California’s AB 411 thresholds). • Most probable number (MPN) of total coliform (TC) organisms less than
sample, when verified by a repeat sample taken within 48 hours, shall exceed 10,000/100ml.
• Geometric mean of 200 fecal coliform (FC)/100ml in five samples in a 30-day period or 400/100ml in a single sample used by counties that choose to test for fecal coliform.
• Ratio of TC to FC may not exceed 5 when TC is 5,000 or greater.
In October 1997, California passed Assembly Bill (AB) 411 (or the Right to Know Bill), and since 1999 all beaches with more than 50,000 annual visitors or beaches located adjacent to stormdrains that flow during the summer must be monitored weekly from April to October. The legislation required more protective standards and uniform bacterial monitoring programs. Water samples must be tested for three bacterial indicator organisms (TC, FC, and ENT) and beaches failing to meet the state’s criteria for any one of these three microbes must post conspicuous warning signs to notify the public of health risks associated with swimming in these areas (Orange County Sanitation District 1999; National Resources Defense Council 2005). These new regulations “require a beach posting if single sample thresholds for any of the three indicator bacteria are exceeded and a beach closure if there is a known sewage spill affecting the beach (Orange County Sanitation District 1999).”
washed by stormwater runoff into the stormwater systems and ultimately into local waterbodies (Watershed & Coastal Resources Division). In 1987, amendments to the federal Clean Water Act (CWA) added Section 402(p), which defined stormwater discharges from industrial and municipal systems as point sources subject to the National Pollutant Discharge Elimination System (NPDES) Permit Program. As directed by the CWA, the US EPA published regulations to define stormwater discharges subject to NPDES permits and established a regulatory framework for these discharges. Regulations require that Municipal Separate Storm Sewer Systems (MS4s) subject to NPDES permits implement best management practices (BMPs), including both source controls and treatment measures, to reduce pollutants in stormwater discharges to the maximum extent practicable (MEP). In California, MS4 permits also require permittees to reduce pollutant discharge so water quality standards are met (Currier, Jones et al. 2005).
Sewage Treatment and Stormwater Control
The OCSD has two operating facilities in Orange County that cover a service area of 471 square miles and provide service for 2.4 million residents. Wastewater Treatment Plant #2 is located in the northwest portion of the County, directly shoreward of Talbert Marsh and slightly downshore of the Huntington Beach surf zone. On a daily basis, this plant receives an average of 151 million gallons of residential, industrial, and commercial wastewater and releases approximately 103 m3 of blended primary and secondary treated water into the ocean though a 120-inch diameter pipeline that extends five miles from shore and discharges approximately 200 feet below the ocean surface. An additional emergency standby 78-inch diameter pipeline stretches one-mile from shore. The second operating facility, Reclamation Plant #1, is located in central Orange County. It receives an average of 87 million gallons of wastewater per day. About 10 million gallons of secondary effluent water is sent to the OCSD for further processing (advanced treatment by water reclamation processes) and used for landscape irrigation and other purposes. The remaining effluent is piped back to Sewage Treatment Plant #2 and discharged through the ocean outfall (Orange County Sanitation District 1999; Boehm, Sanders et al. 2002; McGee 2005; Orange County Sanitation District 2005).
of the basins. Secondary treatment uses microbes to feed on remaining organic material following advanced primary treatment. OCSD uses both trickling filters and activated sludge to conduct secondary treatment. Furthermore, chlorine disinfection of all wastewater was implemented as a tertiary treatment in 2002 (Orange County Sanitation District 2005). Solids that settle out during advanced primary treatment are further processed to reduce disease-causing bacteria, viruses, and parasites, are pressed to reduce water content, and are then considered biosolids. OCDS supports 100% recycling of its biosolids; Class A biosolids, which have no detectable pathogens in 4-gram quantities of dry solids, are land applied in surrounding California counties and Class B biosolids, which have significantly reduced levels of pathogens, are land applied in Arizona. OCSD biosolids are also composted or landfilled in both California and Arizona (Orange County Sanitation District 2005).
In 1999, the City of Huntington Beach and the County of Orange began diverting dry weather runoff that was collecting in the Talbert Marsh forebays. This runoff was sent to the sanitary sewer system for treatment and disposal in an attempt to reduce runoff impact. During the stormy season, generally from November to March, the diversions are terminated to prevent overburdening the treatment facilities (Reeves, Grant et al. 2004).
neither the 120-inch pipeline nor the out-of-service 78-inch pipeline leak and all water quality tests performed offshore indicate that the discharge plume is not moving onshore (Orange County Sanitation District 1999). One study (Boehm, Sanders et al. 2002) did present evidence that the OCSD’s sewage outfall might be a source of fecal contamination in the surf zone at Huntington Beach by internal wave driven cross-short transport. Follow-up studies have largely disputed the outfall as being a source of pollution, as the water quality problem in the surf zone persisted even after dramatic reductions in fecal indicator bacteria concentrations were found following OCSD’s implementation of partial disinfection of sewage outfall (Noble and Xu 2004).
Recent History of Huntington State Beach
Beach Closures
recreational activities and revenues due to bacterial contamination. Over $20 million has been spent in attempt to identify the source of pollution (Noble 2005).
Studies
The beach closures at Huntington State and City Beaches prompted numerous investigations by local agencies, including OCSD, Orange County Health Care Agency, State Department of Parks and Recreation, City of Huntington Beach, and Santa Ana RWQCB. The three primary sources of contamination investigated by these agencies were 1) onshore sewage pipes, 2) offshore sewage outfall, and 3) stormwater drainage systems. Drainage from land-based sources was determined to be the most likely source of contamination at Huntington Beach based on the following four lines of evidence: “1) The high bacterial concentrations that were found in the stormwater forebays and which were subsequently pumped into the conveyance system; 2) The citrus studies that tracked the transport of Talbert Channel discharge water onto the contaminated beach areas; 3) The tidal signature of the beach contamination was consistent with tidally influenced drainage from land based sources; and 4) Diversion of stormwater from pump stations upstream of Talbert Marsh into the sewage system mitigated almost all of the beach contamination (Lemus and Weisberg 2000).” None of there initial studies considered the influence of waterfowl in Talbert Marsh as a source of the contamination at Huntington Beach.
namely UC-Irvine and California State University, San Bernardino, were also conducted following the Huntington Beach closures. These studies focused on a number of issues, including variability in surf zone water quality (Boehm, Grant et al. 2002), mass budget analysis of fecal indicators bacteria (Kim, Grant et al. 2004), generation of enterococci in the marsh (Grant, Sanders et al. 2001) and their antibiotic resistance patterns (Choi, Chu et al. 2003), groundwater discharge (Boehm, Shellenbarger et al. 2004), the impact of stormwater runoff from the Santa Ana River (Ahn, Grant et al. 2005), and surf zone entrainment and along-short transport of pollution from the Santa Ana River and Talbert Marsh outlets (Ahn, Grant et al. 2005). Furthermore, another study developed and applied a model to “predict the dry-weather tidal cycling of FIB [fecal indicators bacteria] in Talbert Marsh, an estuarine, intertidal wetland in Huntington Beach, California, in response to loads from urban runoff, bird feces, and resuspended sediments (Sanders, Arega et al. 2005).” This model predicts that surface water concentrations of TC, EC (Escherichia coli), and ENT in the wetland are driven by loads from urban runoff and resuspended wetland sediments on which the waterfowl forage daily (Sanders, Arega et al. 2005). All of these studies aid in understanding the dynamics of fecal contamination at Huntington Beach, although more studies are needed to fully assess its sources and effects.
The Impact of Stricter Regulations
bacteria, versus 12 occurrences when reporting under the previously-used standards (Orange County Sanitation District 1999). In addition, between July 26, 1999 and September 5, 2000, the Orange County Health Care Agency reported 99 postings at Huntington State and City Beaches. Of these, 72% were triggered by ENT single-sample violations and 25% by ENT geometric mean standard violations (Grant, Sanders et al. 2001). These postings would not have occurred prior to AB 411 or under the pre-amended California Ocean Plan. Due to these new, stricter regulations, there has been an increase in the number of days that the beaches throughout the State, especially around freshwater outlets (storm drains, rivers, and creeks), exceed the health criteria. (Orange County Sanitation District 1999). It is important to note, however, that the completion of Talbert Marsh, and subsequent influx of waterfowl to the area, and the stricter enterococci water quality standard addition to the California Ocean Plan occurred during the same year. This provides further reason to look more closely at pathogens in the marsh area than to try and interpret the human health risks based on different bacterial indicators and their specific action levels.
Talbert Watershed Geography
Resources Division). Talbert watershed receives an average of 29 cm of rainfall annually, over 90% of which occurs between November and April. Daily high/low temperatures average 23/17oC in September and 17/8oC in January (Sanders, Arega et al. 2005).
Talbert Watershed, covering 3,400 hectares and standing only a few feet above sea level, drains the urbanized areas of Huntington Beach and Fountain Valley, CA. The surrounding urbanized areas consist of residential and commercial developments, plant nurseries, and light industry. On the western side of the Watershed, street gutters direct urban runoff into inlets and, because Talbert Watershed is nearly flat, a system of underground stormwater pipelines connect the inlets to a network of three flood control channels through transfer (or pump) stations. Each transfer station is made up of a forebay, where water can be stored, and several pumps that pump runoff into the flood control channels that converge near the ocean at a constructed wetland called Talbert Marsh (Grant, Sanders et al. 2001). Talbert Channel is the main of the three flood control channels. Huntington Beach Channel begins 2 km inland from the mouth and branches west for 5 km while Fountain Valley Channel begins 8 km from the mouth and branches east (see Figure 1.1) (Sanders, Arega et al. 2005). The channel beds consist “of beach sand and silts near the outlet and within a flood delta that penetrates a short distance into the marsh. Further inland, the marsh and channel bed consists of organic rich silts and muds, except the upper reaches of Talbert Channel and Fountain Valley Channel where the bed is lined with concrete (Watershed & Coastal Resources Division; Sanders, Arega et al. 2005).”
Sanders et al. 2001).” Pickle weed is abundant and several bird species have begun utilizing the area (Grant, Sanders et al. 2001). Over the past century, the wetland has been drained and filled for agriculture and development, including Pacific Coast Highway construction and flood control channelization. A habitat restoration effort in 1990 created a new tidal inlet and tidal flushing now occurs. During high tides, ocean water floods the marsh and marsh sediments, Talbert Channel to the Fountain Valley Channel junction, and the length of the Huntington Beach channel to depths of roughly 1 meter. During ebb tides, a brackish mixture of ocean water and runoff drains from the system into the Pacific Ocean. In the poorly mixed inland zone, water residence times are at least one week, while the well-mixed zone near the mouth of the marsh is flushed during each tidal cycle (Grant, Sanders et al. 2001; Sanders, Arega et al. 2005). A recent tracer dye study conducted at Talbert Marsh found that the water residence time in the marsh during a weak spring tide is less than 40 minutes (Grant, Sanders et al. 2001). In this case, it is likely that the marsh is not appreciably inactivating pathogens, but is distributing them to ocean receiving waters.
Birds in Talbert Marsh
228 birds present during the day and the largest congregation of birds consisting of 1180 individuals at one time (Grant, Sanders et al. 2001).
Wild birds, including gulls, geese, and ducks, have long been considered important non-point sources of fecal contamination to surface waters (Mundt 1962; Geldreich and Kenner 1969; Mitchell and Ridgwell 1971; Hussong, Damare et al. 1979; Standridge, Delfino et al. 1979; Benoit, Brousseau et al. 1993; Alderisio and DeLuca 1999). Feces of gulls and geese may contain up to 107 and 104 colony forming units (CFU) of fecal coliforms per gram (wet weight) of feces, respectively (Hussong, Damare et al. 1979; Benoit, Brousseau et al. 1993; Ricca and Cooney 1998; Alderisio and DeLuca 1999). In geese and swans, the amount of enterococci is reported to be lower than fecal coliforms and dependent on diet. Furthermore, in some shallow aquatic environments contaminated by certain bird populations, fecal coliforms have been reported in the range of 102 to 103 CFU per 100 ml of surface water and 104 CFU per 100 ml of sediment (Hussong, Damare et al. 1979).
these fecal samples also contained somatic coliphages and 9.4% contained F+ coliphages at concentrations of 100 to 102 plaque forming units (PFU)/g (Ricca and Cooney 1998). Studies have also reported both Vero cytotoxin-producing Escherichia coli O157 and Shiga toxin (Stx)-producing Escherichia coli (STEC) strains from gull feces in Japan and the UK (Wallace, Cheasty et al. 1997; Makino, Kobori et al. 2000).
Other studies have focused on the presence of Salmonella (Williams, Richards et al. 1976; Fenlon 1981; Rosef 1981; Butterfield, Coulson et al. 1983; Fenlon 1983; Kapperud and Rosef 1983; Fricker 1984; Girdwood, Fricker et al. 1985; Monaghan, Shedden et al. 1985; Kirkpatrick 1986; Refsum, Handeland et al. 2002) and Campylobacter (Fenlon 1981; Rosef 1981; Kapperud and Rosef 1983; Whelan, Monaghan et al. 1988; Moore, Gilpin et al. 2002; Refsum, Handeland et al. 2002) in seagull feces. A researcher in Canada found 8.71 and 15.91% of the ring-billed gull population in the Montreal area were carriers of Salmonella
spp. and Campylobacter spp., respectively (Benoit, Brousseau et al. 1993). In Northern Ireland, 13.7% of gull fecal samples tested were positive for Campylobacter spp. Of these, 75% belonged to the urease-positive thermophilic Campylobacter (UPTC) taxon, 17.9% were C. lari, and 7.1% were C. jejuni (Moore, Gilpin et al. 2002). An intense study focused on a number of different gull species found in both urban and rural environments. A majority (63.2%) of the tested fecal samples of the urban herring gull (Larus argentatus) were positive for Campylobacter as opposed to only 4.2% of tested fecal samples of its rural counterpart. The urban black headed gull (L. ridibundus) feces also contained
in the feces of the lesser black-backed gull (L. fuscus) or the great black-backed gull (L. marinus) (Kapperud and Rosef 1983).
Introduction to Microbes
Salmonella and Campylobacter were the human bacterial pathogens focused on in this study. As discussed in Chapter II, both are commonly found in the gastrointestinal tracts of birds and both can cause gastrointestinal illness in humans. Additionally, the presence of the FC, Escherichia coli (ET), ENT, and F+ coliphages, was assessed. These fecal indicator microbes are commonly found in the feces of warm-blooded animals and have similar structure and persistence in the environment as many human pathogenic enteric bacteria and viruses, respectively (Gerba 1987).
Salmonella
Incidence
used to identify differences among subspecies. Two serotypes of S. enterica subsp. enterica, denoted S. Typhimurium and S. Enteritidis, are known to cause the majority of zoonotic cases of salmonellosis in many countries (Lake, Hudson et al. 2002).
Symptoms
Symptoms of salmonellosis occur 12 to 72 hours after infection, last four to seven days, and include “acute onset of fever, abdominal pain, diarrhea, nausea and sometimes vomiting” (World Health Organization 2005). Symptoms can become more severe in young, elderly, and immunocompromised patients, leading to dehydration and even death (World Health Organization 2005). The median period for fecal shedding is five weeks (Lake, Hudson et al. 2002). Antibiotic treatment is not generally necessary, however the emergence of multi-drug resistant Salmonella strains threatens to limit the use of this form of treatment (World Health Organization 2005).
Reservoirs
Poultry and pigs are considered major reservoirs of Salmonella, but they are also found in fish, terrapins, frogs, and birds (Lake, Hudson et al. 2002). Some studies suggest Salmonella
Transmission
Transmission of salmonellae in humans is primarily through the consumption of raw or undercooked meat, poultry, poultry-derived products, or other contaminated foods or through direct contact with contaminated animals. Human to human transmission is uncommon in developed countries, however less is understood about transmission in developing countries (World Health Organization 2005).
Survival
Survival of salmonellae in dry environments is a characteristic of these organisms, and they have been shown to survive for months in soil. Studies have also shown that Salmonella
have a prolonged survival potential in estuarine environments and the potential for survival and growth in warm temperature conditions (Rhodes and Kator 1988). In one seawater study (Jamieson, Madri et al. 1976), researchers added known concentrations of S. typhi to sterilized seawater of different salinities and temperatures and found survival was inversely proportional to salinity and temperature. Maximum survival was for seven days (t90 = 23
hours) at 4°C and 0.5% salinity and minimum survival was for five days (t90 = 17 hours) at
3.7 days and significant differences between microbial inactivation rate and temperature were not consistently observed. In addition, microbial reductions occurred more rapidly under field conditions than at similar temperatures in laboratory seeded seawater experiments (Wait and Sobsey 2001).
A number of studies have assessed the survival of Salmonella spp. in feces. As reported in Mitscherlich and Marth (Mitscherlich and Marth 1984), S. senftenberg survived for 14 days at 8oC, 8 days at 20oC, and >8 days at 37oC in pig slurry. Salmonella enterica Typhimurium was not detectable after 19 days at 37oC, but survived for at least 60 days at 4 and 20oC in cattle slurry and 48 days at 37oC in cattle manure. Analysis of decimal reduction times (DRT; times require for 90% reduction) in this study found that Salmonella survived less well in liquid manure than solid manure at 20 and 37oC and the opposite at 4oC. In addition, greater survival occurred at 20 and 37oC in fresh manure slurry than old manure slurry, indicating that “manure stored at warm temperatures for a period of time is an unfavorable environment for survival of pathogens (Mitscherlich and Marth 1984; Guan and Holley 2003).” Again, these data are taken from a secondary source that does not report inactivation rates or changes in concentration (from initial to final) over time. In the early 1970s, a study reported that S. typhimurium survived 6 – 18 weeks (t90 = 150 – 450 hours) in sheep feces in
New Zealand. Survival was longer in shaded versus exposed sites, and in summer versus winter months (Tannock and Smith 1972). Additionally, Berkowitz et al. (Berkowitz, Kraft et al. 1974) studied the survival of various Salmonella serotypes inoculated into wet poultry feces. The t90 value, or the time it takes to eliminate 90% of the microorganisms present in
the sample, averaged 184 hours at 9 – 12°C, 112 hours at 18 – 20°C, and 40 hours at 30°C.
the appendices of Feachem et al. (Feachem, Bradley et al. 1980) , t90 values for Salmonella in
feces or night soil in tropical climates ranged from 40 – 100 hours.
Campylobacter
Incidence
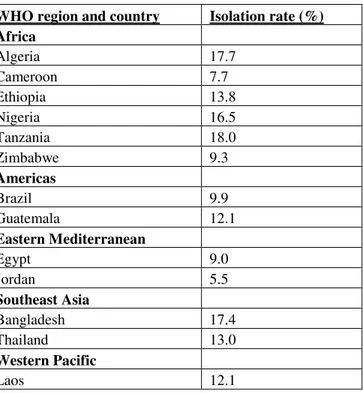
Campylobacter is considered the most common bacterial cause of human gastroenteritis worldwide, with as many as 400 million cases annually (Haberberger and Walker 1994). Isolation rates of Campylobacter from diarrheal specimens in developing countries is 5 to 20%; Table 1.1 shows examples of these rates in diarrhea specimens from children in developing countries that are less than five years old. Incidence data of Campylobacter
developing and developed countries. C. upsaliensis, C. concisus, and aerotolerant
Campylobacter may also be of pathogenic importance (Coker, Isokpehi et al. 2002).
Symptoms
Symptoms of campylobacteriosis generally occur two to five days post infection, last three to six days, and include diarrhea (often accompanied by blood), abdominal pain, fever, headache, nausea, and/or vomiting (World Health Organization 2000). Patients may excrete
Campylobacter organisms in the range of 106 to 108 bacteria/g feces (Taylor, Perlman et al. 1993). In the developed world, the organism is shed for an average of 2-3 weeks after cessation of diarrheal symptoms, while in the developing world, shedding occurs for as short as one week in children post diarrheal symptoms (Rao, Naficy et al. 2001). More severe complications of campylobacteriosis include reactive arthritis, Guillain-Barre syndrome, or death, especially among the young, elderly, and immunocompromised patients (World Health Organization 2000). In the US, approximately 1 in 1000 diagnosed campylobacteriosis infections lead to Guillain-Barre syndrome and an estimated 124 fatal cases occur each year (Centers for Disease Control Division of Bacterial and Mycotic Diseases 2003). Treatment is rarely administered, but may include electrolyte replacement, rehydration, and antimicrobial treatment (World Health Organization 2000).
Reservoirs
C. jejuni and C. coli have a minimum growth temperature requirement of approximately 30oC, so warm-blooded animals serve as ideal reservoirs (Baker, Ball et al. 2002).
poultry, cattle, pigs, sheep, ostriches, shellfish, cats, and dogs (World Health Organization 2000). Wild birds such as ducks and seagulls have also been shown to be ideal reservoirs of
Campylobacter and aid in transmission through the environment, mainly due to their internal temperature of 42oC and ease of mobility (Skirrow 1990; Jones 2001). Fallacara et al (2001) reported 40% prevalence of C. jejuni in mallard ducks.
Transmission
In developed countries, transmission of Campylobacter to humans is mostly foodborne, such as by ingestion of undercooked meats and meat products and contaminated milk (Centers for Disease Control Division of Bacterial and Mycotic Diseases 2003). However, an estimated 20% of cases of illness caused by Campylobacter are due to vehicles of infection other than food, including water (Mead, Slutsker et al. 1999). The presence of
poorly documented and understood, as reports are made sporadically, there is a wide reported occurrence of campylobacters, and the sample volumes, methods, and conditions of their occurrence have varied among different studies (World Health Organization 2000).
Survival
Because their metabolic activity does not completely cease at temperatures lower than 30oC, Campylobacter cells can potentially adapt and survive in transit between hosts. Although Campylobacter is considered a fragile organism in dry and aerated conditions, studies of its complex physiology (Kelly 2001) and its possible formation of viable but non-culturable cells have demonstrated its resilience under some environmental conditions. In water, Campylobacter has shown to survive eight to 28 days at 4oC and 16oC, but survival time was greatly shortened to 43 hours as temperature increased to 22oC and above. Furthermore, stream water at 4oC has shown to sustain significant numbers of VBNC C. jejuni for more than 4 months (Guan and Holley 2003). It is important to note that these data are taken from a secondary source that does not report inactivation rates or changes in concentration (from initial to final) over time.
Few studies have demonstrated the survival of Campylobacter in feces. One study reported survival for 3 days in cattle feces and liquid cattle manure and for 2 days in liquid swine manure at room temperature. C. jejuni has also been recovered from 12 to 21 days in human feces stored at 4oC. Another study found that C. jejuni was more resistant than
(Guan and Holley 2003). Again, these data are taken from a secondary source that does not report inactivation rates or changes in concentration (from initial to final) over time. To date, no studies have been published on the survival of Campylobacter in gull feces. Determining
Campylobacter sources, presence and survival in water and feces is pivotal in understanding transmission of the organism between animals, humans, and the presence of it in the environment (Baker, Ball et al. 2002).
F+ Coliphages
General Information
Bacteriophages (or “phages”) are viruses that infect and replicate in bacterial cells. Their formal classification is based mainly on capsid morphology and the single- or double-stranded nature of the nucleic acid. There are six major families (or morphological groups) of bacteriophages found in sewage and sewage-polluted waters. The term coliphage refers to bacteriophage that infect coliforms, including Escherichia coli and possibly other Enterobacteriaceae, found in the intestinal tracts of all warm-blooded animals (Leclerc, Edberg et al. 2000). The three groups of bacteriophages considered most useful as indicators of fecal contamination and enteric viruses are somatic coliphages, F+ coliphages, and phages that infect Bacteriodes fragilis.
of two families, F+RNA coliphages (Leviviridae) and F+DNA coliphages (Inoviridae), which consist of single-stranded genetic material and do not contain tails (Leclerc, Edberg et al. 2000). Both types infect host bacteria via the F+ pilus; F+DNA coliphages infect through the tip of the pilus whereas F+RNA coliphages infect through its sides (Duckworth 1987). The F+ pilus is encoded for by the F-plasmid classically found in E. coli K-12, but it has also been introduced into other hosts in the laboratory to eliminate detection of somatic coliphages (IAWPRC Study Group on Health Related Water Microbiology 1991). The F+RNA family contains two genera: Levivirus, which contains Groups I and II phages, and Allolevivirus, which contains Groups III and IV phages. The F-DNA family, or filamentous phages, are noneveloped, flexible, rod-shaped with circular single-stranded DNA (Vinje, Oudejans et al. 2004). Bacteriodes fragilis phages, particularly strain HSP40, infect the anaerobe B. fragilis with a high degree of host-strain specificity and have the highest recovery rate from individual people (Leclerc, Edberg et al. 2000).
Coliphages as Indicators
the feces of humans. It has been suggested that these low concentrations in feces may be a limitation of the bacterial host while in the gut due to microflora, diet, or physiological state of the animal. Conversely, high concentrations of bacteriophages are consistently found in raw sewage. Several studies have cited a correlation between the presence of coliforms, somatic coliphages, and enteric viruses in contaminated waters; other studies have been unable to verify this correlation (Gerba 1987).
More recent studies have focused on the use of F+ coliphages as enteric viral indicators. With over 140 enteric viruses identified in human feces and sewage (generally in low concentrations) and expensive, technically demanding, and time-consuming viral detection methods, the use of these phages as viral indicators is attractive. Kott (1981) has detailed a basis for this use, including phage abundance in wastewater and polluted water, inability to reproduce outside the host organism, greater resistance to inactivation than enteroviruses, and detection by quick, simple, and cheap methods. In addition, F+ coliphages have similar structure and persistence in the environment as some of the enteric viruses. There is evidence that F-RNA phages, and possibly somatic coliphages, are likely to be positively correlated with counts of enteroviruses in domestic effluents and receiving waters (Gerba 1987). Serological classification of F-RNA phages yields four general RNA phage groups that may provide some insight into the origin of fecal contamination.
Another study found F+ bacteriophages in 20% of seagull feces samples assayed (Grabow, Neubrech et al. 1995). Muniesa et al reported F+ bacteriophages in 39% of samples with concentrations ranging from 4 to 20 pfu/g (Muniesa, Jofre et al. 1999).
Although generally detected in environmental waters along with F-RNA coliphages, the sanitary significance of F-DNA coliphages has yet to be adequately assessed. However, in a study in Mission Bay, San Diego bathing waters, F-DNA coliphages were the predominate F+ coliphages isolated. F-DNA coliphages best predicted risks of gastrointestinal illness in these bathers and therefore provide some evidence that these colipages have some predictive ability for human health effects associated with bathing in fecally contaminated water (Sobsey 2005). In contrast, F-RNA coliphages have been widely shown to be associated with fecal contamination in water. Based on current published data, groups II and III F-RNA phages are mainly found in environments impacted by human waste, while groups I and IV are mainly found in environments impacted with animal pollution (Furuse 1987; Schaper, Jofre et al. 2002; Scott, Rose et al. 2002; Cole, Long et al. 2003).
Sobsey 2005). It is important to note that of the many bacteriophage studies done, a wide variation in results has been reported. Much of this variation is likely due to the lack of a standardized method (Leclerc, Edberg et al. 2000). Standardization of methods is now being established by the USEPA (U.S. Environmental Protection Agency 2001; U.S. Environmental Protection Agency 2001), by the European Union (Mooijman, Ghameshlou et al. 2005), and by the International Standards Organization (Mooijman, Bahar et al. 2001; Mooijman, Bahar et al. 2002).
Fecal Coliforms & Enterococci
Concentrations of fecal indicator bacteria have been monitored for many decades (mainly since the 1950s) to assess recreational water quality. Escherichia coli and enterococci have been established by the US EPA as the preferred indicators of fecal contamination in recreational waters. Recent studies along the southern California shoreline have shown an abundance of fecal bacterial indicators in both dry and wet weather, near stormwater inputs, and along the beach (Noble, Moore et al. 2003).
Members of the total coliform group occur in human feces, but are also present in the feces of other animals and even in soils and wood, and therefore are not recommended as fecal indicators. Fecal coliforms are a subset of total coliforms and are generally more fecal-specific. However, they also include the genus Klebsiella which is often not of fecal origin.
Enterococci are a subgroup within the fecal streptococcus group that are generally more feces-specific than the other streptococci. It has even been suggested that certain species of enterococci, such as E. faecium and E. faecalis, are human-specific. However, evidence for this is limited. Futhermore, enterococci other than E. faecalis and E. faecium have been found in human feces and in sewage, including enterococci thought to be of specific animal sources, such as E. bovis of cattle. Hence, despite the apparent animal host specificity of some enterococci, there is a lack of strict specificity in linking Enterococcus spp. to specific animal sources. Furthermore, some enterococci have environmental reservoirs, such as terrestrial vegetation and seaweed, and therefore they are not feces-specific. Enterococci are noted for their ability to survive in salt water and other enterococci are thought to provide good information on fecal presence and, in this way, better information on pathogen presence and persistence in the environment (U.S. Environmental Protection Agency 2004; Sobsey 2005).
Introduction to Methods Used In This Study
Conventional Phenotypic Methods
Culture techniques combined with a series of physiological and biochemical tests have been the classic approach used to quantify and classify bacteria in environmental samples for decades. These methods include: growth in selective enrichment broth and/or on selective media; biochemical reactions, such as response to oxidase, catalase, or urease; antibiotic susceptibility testing against a panel of antimicrobial agents; and bacteriophage or bacteriocin (bactericidal peptides) susceptibility testing (Theron and Cloete 2000; Zaidi, Konstantinou et al. 2003).
Molecular Genotypic Methods
Infectious diseases outbreaks are often caused by clonally related organisms, which are members of the same species that have common virulence factors, biochemical traits, and genomic characteristics. However, there is enough diversity at the species level due to source, geographical location, and temporal differences that organisms may be divided into subspecies or strains. The ability to strain type is very important for epidemiological surveillance and to determine fecal contamination sources. Usually phenotypic methods are unable to provide information regarding strain and in the last decade a series of genotypic molecular methods have been developed for this purpose. Many of these methods differ in their analytical approach, but all rely on the polymerase chain reaction (PCR) and DNA sequencing for determination of bacterial strain (Olive and Bean 1999).
molecular genotypic methods involve PCR amplification and sequencing of these regions. Data is compared to both known standards and other environmental isolates on large databases available through the Internet. Genotypic methods are highly sensitive, rapid, and allow direct detection of unique sequences to identify organisms.
Genetic methods can sometimes be applied directly to bacteria and other microbes in environmental samples without the need to culture. The nucleic acid of the target microbes in the sample can be extracted and directly PCR amplified. Limitations of this approach are the low concentrations of the target microbes in the environmental samples, often requiring prior concentration of the microbes, and the presence of inhibitors and other interfering materials that prevent efficient microbe recovery, nucleic acid extraction and/or amplification by PCR. These limitations are being overcome with improved methods.
Polymerase Chain Reaction
primers target a series of sequences in multiplex PCR. Real-time PCR allows quantitative analysis of PCR amplification.
Sequencing
DNA sequencing is also often employed in genotypic molecular methods. Sequencing is the enumeration of individual nucleotide base pairs along a linear segment of DNA. Currently, Sanger dideoxy sequencing is the most often used automated method. In this method, four separate in vitro DNA synthesis reactions are performed using a synthetic 5’-end-labeled oligodeoxynucleotide as a primer and the ssDNA to be sequenced as the template strand. Each reaction also contains a low concentration of one of four 2’,3’-dideoxynucleoside triphosphates, or ddNTPs, which lack a 3’hydroxyl group, and a higher concentration of the normal deoxynucleoside triphosphates (dNTPs). In each reaction, ddNTP is randomly incorporated at a position of the corresponding dNTP. Because the ddNTP lacks the 3’ hydroxyl group, it prevents addition of the next nucleotide and terminates polymerization. The mixtures of terminated fragments, representing all positions of each indicated base, from each of the four reactions are subjected to gel electorphoresis and autoradiography in parallel. Finally, the sequence of the original DNA template strand can be determined directly from the autoradiogram (Lodish, Berk et al. 2000).
Pulsed-field Gel Electorphoresis (PFGE)
embedded into hollow wells within an electrophoresis gel and large fragments are separated as the gel is subjected to alternately-pulsed, perpendicular electric fields. This process allows clear separation of large DNA fragments ranging from 10 – 800 kilobases and produces distinct banding patterns which can be photographed and stored digitally. Advantages of this method are that it is straightforward, extremely sensitive to minute genetic differences, highly reproducible, and it allows creating of databanks for all organisms. Disadvantages are that it is time-consuming, allows limited simultaneous processing, requires a database, and may be too sensitive to broadly discriminate source (Olive and Bean 1999; Simpson, Santo Domingo et al. 2002; Meays, Broersma et al. 2004).
Nucleic Acid Hybridization
The Reverse Line Blot Hybridization method (RLB) is a type of nucleic acid hybridization method that allows the simultaneous screening of relatively many DNA samples against relative many genetic probes. Oligonucleotide probes are covalently linked to the carboxyl groups of a negatively charged and activated membrane in parallel lines using a miniblotter. Excess oligonucleotide solution is aspirated and the blot is inactivated and washed. The blot is placed back in the miniblotter, but rotated 90° so that the slots of the miniblotter now are perpendicular to the lines containing the probes. Individual slots are filled with heat-denatured biotin-labeled PCR products and hybridization takes place. After several washing steps, the blot is incubated with a streptavidin-peroxidase conjugate, which interacts with the biotin of the PCR product. Again following washing steps, chemiluminescent detection is visualized by exposure of the blot to an X-ray film. This method is not only sensitive and specific, but reproducible, easy to perform, and rapid (Kaufhold, Podbielski et al. 1994).
Microbial Source Tracking
human from animal sources of contamination. Microbial source tracking allows detection of subtle differences between these organisms, so that the host or environment from which they were derived can be identified. Knowing the origins of fecal pollution allows better assessment of health risks and the development of actions necessary to prevent further contamination (Scott, Rose et al. 2002).
Summary
Objectives of this study were to determine if seagulls in Talbert Marsh are reservoirs of
Salmonella, thermophilic Campylobacter, and fecal indicators, including F+ coliphages, and if they are shedding detectable levels of these microbes into Talbert Marsh and nearby ocean waters. It is possible that these microbes, and other associated microbes, pose a threat of infectivity to humans using the swimmable nearshore waters at Huntington Beach that receive output from Talbert Marsh. Both conventional microbiological methods and more-recently developed genotypic molecular methods were employed to detect, enumerate, and genetically confirm the presence of both pathogenic and fecal indicator microbes in both seagull feces and water samples. Microbial source tracking methods, including PCR, PFGE, and nucleic acid hybridization techniques, provide a means to better track and understand the impact seagull feces have on this estuarine environment and its waters that flow into the Huntington Beach surf zone.
WHO region and country Isolation rate (%)
Africa
Algeria 17.7
Cameroon 7.7
Ethiopia 13.8
Nigeria 16.5
Tanzania 18.0
Zimbabwe 9.3
Americas
Brazil 9.9
Guatemala 12.1
Eastern Mediterranean
Egypt 9.0
Jordan 5.5
Southeast Asia
Bangladesh 17.4
Thailand 13.0
Western Pacific
Laos 12.1
References
Ahn, J. H., S. B. Grant, et al. (2005). "Coastal water quality impact of stormwater runoff from an urban watershed in southern California." Environ Sci Technol 39(16): 5940-53.
Alderisio, K. A. and N. DeLuca (1999). "Seasonal enumeration of fecal coliform bacteria from the feces of ring-billed gulls (Larus delawarensis) and Canada geese (Branta canadensis)." Appl Environ Microbiol 65(12): 5628-30.
Baker, M., A. Ball, et al. (2002). Potential Transmission Routes of Campylobacter from Environment to Humans, Institute of Environment Science and Research, NZ.
Benoit, L., P. Brousseau, et al. (1993). "Impact of the ring-billed gull (Larus delawarensis) on the microbiological quality of recreational water." Appl Environ Microbiol 59(4): 1228-30.
Berkowitz, J. H., D. J. Kraft, et al. (1974). "Persistence of salmonellae in poultry excreta." J Environ Qual 3: 158-61.
Bermudez, M. and T. C. Hazen (1988). "Phenotypic and genotypic comparison of
Escherichia coli from pristine tropical waters." Appl Environ Microbiol 54(4): 979-83.
Boehm, A. B., S. B. Grant, et al. (2002). "Decadal and shorter period variability of surf zone water quality at Huntington Beach, California." Environ Sci Technol 36(18): 3885-92.
Boehm, A. B., B. F. Sanders, et al. (2002). "Cross-shelf transport at Huntington Beach. Implications for the fate of sewage discharged through an offshore ocean outfall." Environ Sci Technol 36(9): 1899-906.
Boehm, A. B., G. G. Shellenbarger, et al. (2004). "Groundwater discharge: potential association with fecal indicator bacteria in the surf zone." Environ Sci Technol
38(13): 3558-66.
Butterfield, J., J. C. Coulson, et al. (1983). "The herring gull Larus argentatus as a carrier of salmonella." J Hyg (Lond) 91(3): 429-36.
Byappanahalli, M. and R. w. Fujioka (2004). "Indigenous soil bacteria and low moisture may limit but allow faecal bacteria to multiply and become a minor population in tropical soils." Water Sci Technol 50(1): 27-32.