METABOLIC EFFECTS OF HIGH-INTENSITY INTERVAL TRAINING AND ESSENTIAL AMINO ACID SUPPLEMENTATION
Katie R. Hirsch
A dissertation submitted to the faculty at the University of North Carolina at Chapel Hill in partial fulfillment of the requirements for the degree of Doctor of Philosophy in the Human Movement Science
Curriculum in the Department of Allied Health Sciences in the School of Medicine.
Chapel Hill 2020
Approved by:
Abbie E. Smith-Ryan Arny A. Ferrando Kim M. Huffman
ABSTRACT
Katie Hirsch: Metabolic effects of high-intensity interval training and essential amino acid supplementation
(Under the direction of Abbie E. Smith-Ryan)
High-intensity interval training (HIIT) promotes rapid mitochondrial adaptation leading to increased cardiorespiratory fitness (VO2), metabolic rate (RMR), and fat oxidation, in addition to promoting fat loss and increases in lean mass (LM). Nutritional intake around exercise is also known to modulate metabolic responses during and after exercise, which is further influence by sex. Essential amino acids (EAA) may support positive body composition and metabolic changes associated with HIIT, especially related to LM, but studies evaluating potential synergistic effects are lacking. The purpose of this study was to compare independent and combined effects of HIIT and EAA on body composition, muscle characteristics, and total body metabolism in overweight and obese adults; an exploratory aim was to evaluate the modulatory effects of sex. Sixty-six adults (50% female; Age: 36.7±6.0 yrs; %BF:
ACKNOWLEDGEMENTS
So many people contributed, not just to the direct completion of this study, but also to my growth and development as a researcher and as a person, over this entire PhD journey.
Thank you to my committee members, Dr. Arny Ferrando, Dr. Kim Huffman, Dr. Beth Mayer-Davis, and Dr. Eric Ryan. Your expertise and input made this study better and I appreciated your advice, assistance, and guidance throughout this process.
Thank you to the ASR lab team, both past and present. This lab has been my family for the last six years and each of you has helped me to learn and grow. To the present lab team, thank you for your help with running this study – I definitely could not have done it without you. You all made the long hours fun. Teamwork really does make the dream work.
Thank you to my family and friends who cheered me on every step of the way. You all were a bigger part of this journey than you will ever know. Especially to Mom, Dad, Scott, and Jolie, thank you for your unconditional love and support of all my dreams and goals. Good, better, best!
To Malia, I could not have asked for a better person to sit beside every single day and share every moment of this journey with. You challenge me to think more critically and I always appreciate your honest opinion. I truly value your friendship. Team awesome forever.
TABLE OF CONTENTS
LIST OF TABLES ... xi
LIST OF FIGURES ... xii
CHAPTER I: INTRODUCTION ... 1
SPECIFIC AIMS... 3
DELIMITATIONS... 4
LIMITATIONS ... 6
ASSUMPTIONS ... 6
DEFINITION OF TERMS ... 7
SIGNIFICANCE OF STUDY ... 9
CHAPTER II: REVIEW OF LITERATURE ... 10
INTRODUCTION ... 10
HIGH-INTENSITY INTERVAL TRAINING ... 11
PROTEIN SUPPLEMENTATION ... 16
SEX DIFFERENCES ... 18
CONCLUSION ... 21
CHAPTER III: METHODOLOGY ... 22
EXPERIMENTAL DESIGN ... 22
PROCEDURES ... 24
Body Composition ... 24
Muscle Characteristics ... 26
Total Body Protein Turnover ... 27
Resting Metabolic Rate and Substrate Metabolism ... 27
Cardiometabolic Blood Markers and Metabolomics ... 28
Cardiorespiratory Fitness ... 28
Dietary Intake... 29
High-Intensity Interval Training ... 30
Essential Amino Acid Supplementation ... 30
STATISTICAL ANALYSIS ... 31
Sample Size Determination ... 31
Statistical Procedures ... 31
CHAPTER IV: MANUSCRIPT 1 ... 34
INTRODUCTION ... 34
METHODS: ... 36
Participants ... 36
Experimental Design ... 37
Body Composition ... 38
Resting Metabolic Rate and Substrate Metabolism ... 39
Cardiometabolic Blood Markers ... 40
Dietary Intake... 41
High-Intensity Interval Training ... 41
Essential Amino Acid Supplementation ... 42
Statistical Analysis: ... 42
RESULTS: ... 43
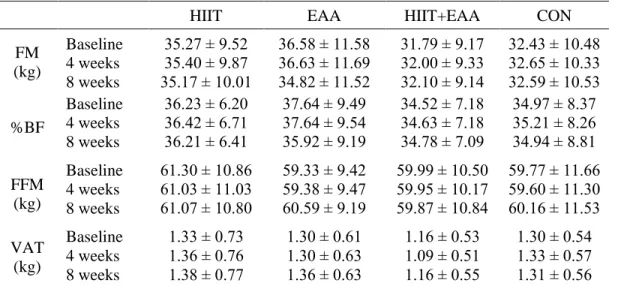
Body composition ... 44
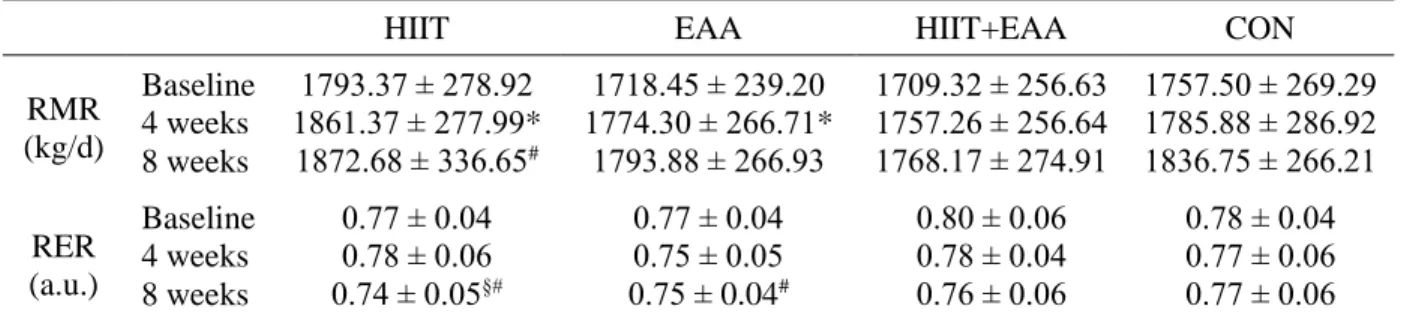
Resting Metabolic Rate and Substrate Metabolism ... 44
Cardiorespiratory Fitness ... 45
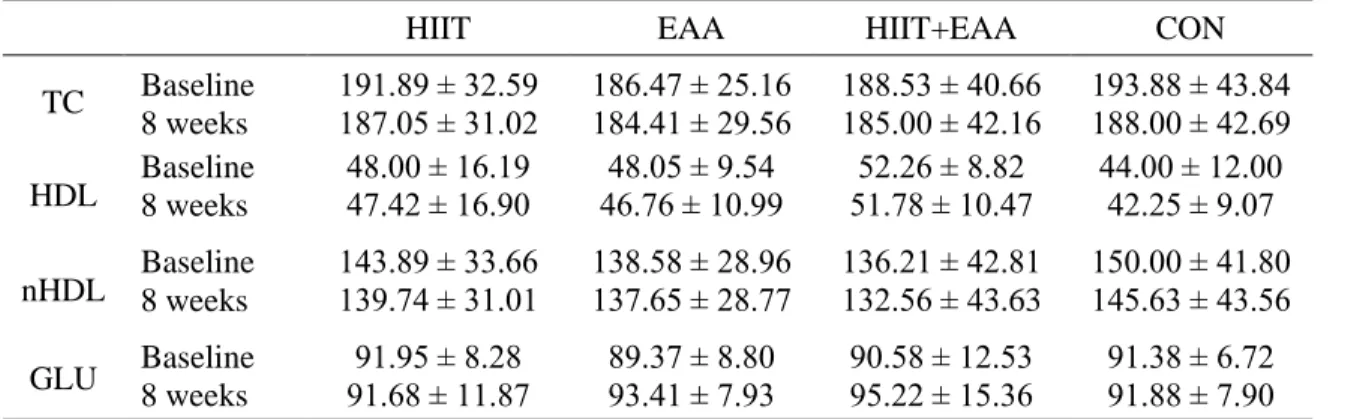
Cardiometabolic Blood Markers ... 47
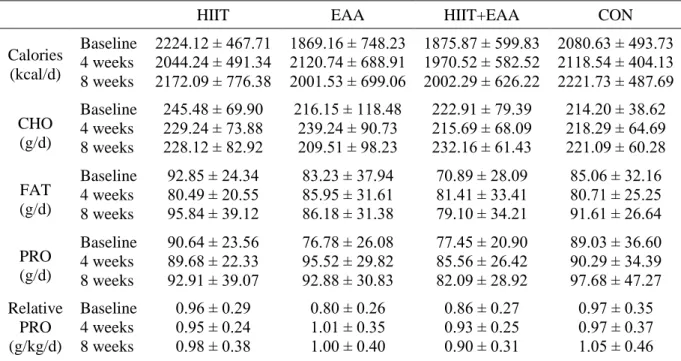
Dietary Intake... 47
DISCUSSION: ... 48
Body Composition ... 48
Metabolism ... 50
Cardiorespiratory Fitness ... 51
Cardiometabolic Markers ... 52
Sex Differences ... 53
No Differential Effect of HIIT+EAA... 54
Conclusions ... 55
ACKNOWLEDGEMENTS ... 56
INTRODUCTION ... 57
METHODS: ... 59
Participants:... 59
Experimental Design: ... 60
Dual-energy x-ray absorptiometry scan ... 60
Ultrasound ... 61
Total Body Protein Turnover ... 62
Dietary Intake... 62
High-Intensity Interval Training ... 63
Essential Amino Acid Supplementation ... 63
Statistical Analysis: ... 64
RESULTS: ... 65
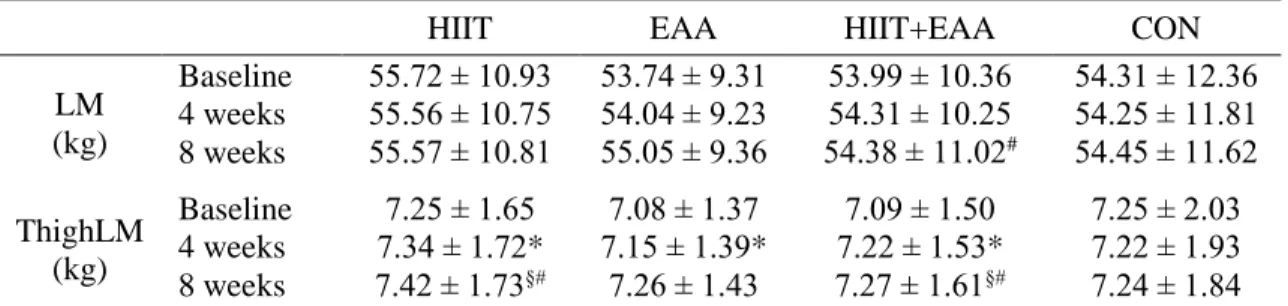
Total Body and Thigh Lean Mass ... 65
Muscle Cross Sectional Area ... 65
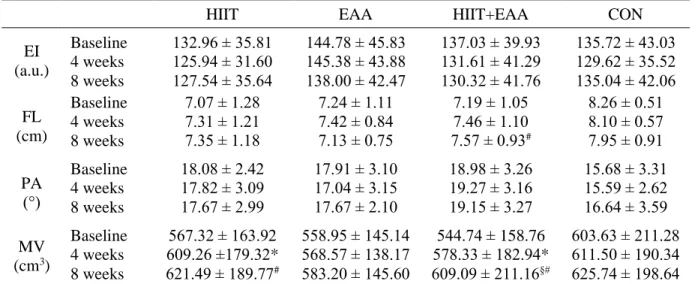
Muscle Quality ... 66
Muscle Volume ... 66
Muscle Architecture ... 67
Whole Body Protein Turnover ... 67
Sex Differences ... 68
DISCUSSION: ... 69
CHAPTER VI: CONCLUSIONS ... 74
TABLES ... 75
FIGURES ... 85
APPENDIX 1 ... 96
LIST OF TABLES
Table 1: Baseline Participant Characteristics (Mean ± SD) ... 75
Table 2: Body composition (Mean ± SD) ... 76
Table 3: Metabolic Characteristics (Mean ± SE) ... 77
Table 4: Cardiorespiratory fitness outcomes (Mean ± SD) ... 78
Table 5: Cardiometabolic markers (Mean ± SD) ... 79
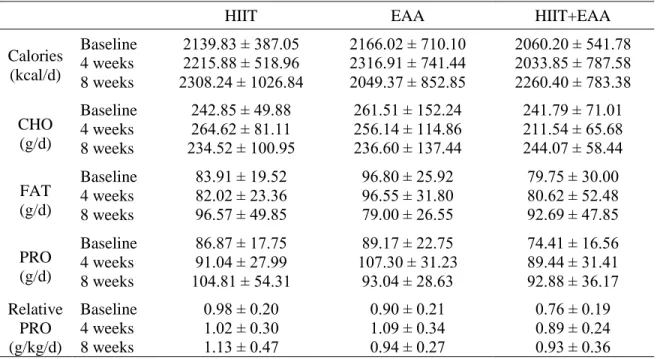
Table 6: Dietary Intake (Mean ± SD) ... 79
Table 7: Total body and regional lean mass (Mean ± SD) ... 81
Table 8: Muscle cross sectional area of the superficial muscles of the quad (Mean ± SD) ... 82
Table 9: Muscle characteristics of the vastus lateralis (Mean ± SD) ... 83
LIST OF FIGURES
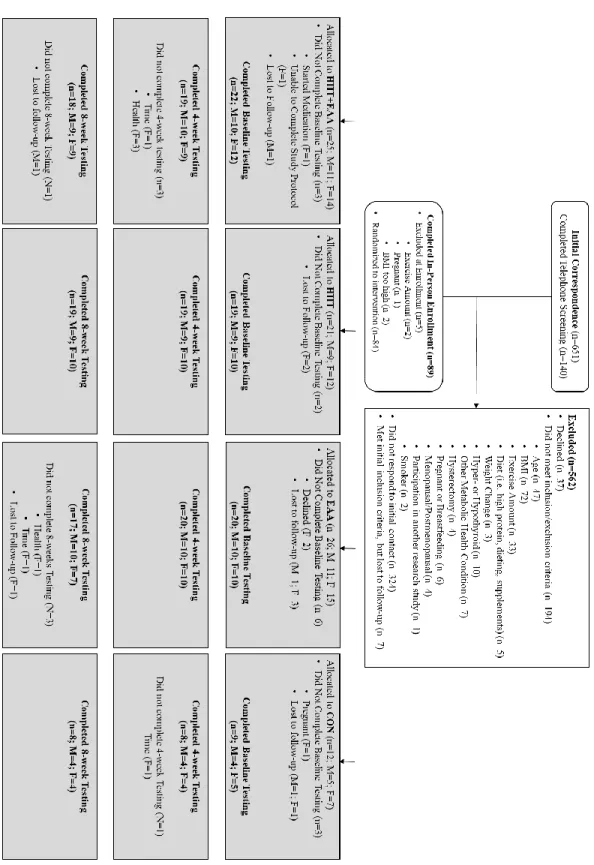
Figure 1: CONSORT guidelines (Manuscript 1) ... 85
Figure 2: Experimental Design (Manuscript 2) ... 86
Figure 3: Timeline of HIIT session (Manuscript 1 and 2) ... 87
Figure 4: Change in RMR and RER from baseline to 8 weeks (Manuscript 1). ... 88
Figure 5: Adjusted mean relative VO2 (ml/kg/min) by group for men and women (Manuscript 1) ... 89
Figure 6: Thigh lean mass region-of-interest (Manuscript 2) ... 90
Figure 7: Thigh LM mean values adjusted for baseline values (Manuscript 2). ... 91
Figure 8: VL mCSA mean values adjusted for baseline values (Manuscript 2) ... 92
Figure 9: EI mean change and 95% CI values adjusted for baseline values (Manuscript 2) ... 93
Figure 10: Whole body protein turnover measures (Manuscript 2) ... 94
CHAPTER I INTRODUCTION
Caloric restriction and physical activity are commonly recommended to promote weight loss, reduce cardiometabolic disease risk, and improve health outcomes associated with obesity [1, 2]. Current recommendations for promoting weight loss include 150 – 300 minutes of moderate intensity physical activity or 75-150 minutes of vigorous activity per week, in combination with two or more days of strength training and some form of caloric restriction [1, 2]. However, these recommendations underemphasize the effects of exercise intensity and macronutrient composition in the weight loss process, specifically the effects on body composition.
promote increased energy expenditure, enhanced fat oxidation, stimulation of muscle protein synthesis, and increased satiety [4, 5, 8].
Exercise is recognized as an important component of weight and metabolic health management, yet more than half of individuals do not meet minimum requirements for physical activity [10]. High-intensity interval training (HIIT) can promote significant improvements in cardiorespiratory fitness and metabolic health, comparable to moderate continuous exercise, but in a significantly shorter amount of time and reduced overall exercise volume [11]. This makes HIIT a feasible option for a variety of clinical populations who have limited exercise capacities and could benefit from more efficient training strategies [12]. Prior research on HIIT training has largely focused on the rapid aerobic and metabolic adaptations, which are attributed primarily to increased mitochondrial biogenesis and oxidative capacity [12]. However, less is known about the effects of HIIT when combined with dietary control, on body
composition, particularly lean mass. Previous studies from our lab have shown that HIIT alone can elicit decreases in fat mass in overweight and obese women [13], while also potentially promoting increases in lean mass (LM) and muscle size in as little as three weeks [14, 15]. Fat loss with HIIT may be associated with post-exercise increases in energy expenditure and enhanced fat oxidation related to increased mitochondrial capacity [16, 17], while increases in LM may be associated with upregulation of mTOR, promoting myofibrillar protein synthesis [18]. Simultaneous improvements in cardiorespiratory fitness and fat loss/muscle gain with HIIT, would have significant health benefits.
recommended for promoting metabolic and body composition changes due to its high EAA content and rapid absorption [19]. Recently, EAA products, providing only the proportion of amino acids necessary to promote muscular growth, have become accessible to the public, providing a more efficient method of EAA ingestion, while also using fewer ingredients/fillers. Finally, there are known differences in
substrate metabolism between men and women at rest and during exercise, with women showing a greater preference for fat oxidation, while men are more efficient at glucose metabolism [20]. Since HIIT and high protein diets have been shown to improve lipid oxidation, HIIT combined with protein/EAA supplementation may create a favorable metabolic environment to support weight loss, especially in women.
PURPOSE:
To compare the independent effects of HIIT and EAA supplementation on body composition and metabolism, and evaluate whether the combination of HIIT and EAA supplementation provides additional benefit.
SPECIFIC AIMS
Specific Aim 1: To compare the independent and combined effects of HIIT and EAA supplementation on
body composition, muscle characteristics, and muscle architecture in overweight and obese men and women over the course of eight weeks.
Hypothesis 1: It was hypothesized that HIIT+EAA would result in greater improvements in body
composition, specifically leading to decreased FM, percent body fat, and visceral adipose tissue and increasing LM, than HIIT, EAA, or CON.
Hypothesis 2: It was hypothesized that HIIT+EAA would result in greater increase in muscle
Specific Aim 2: To compare the independent and combined effects of HIIT and EAA supplementation on
whole body metabolism, specifically whole body protein turnover, metabolic rate, substrate metabolism, and metabolic profile in overweight and obese men and women over the course of eight weeks.
Hypothesis 3: It was hypothesized that HIIT+EAA would significantly increase nitrogen balance,
resulting in a positive nitrogen balance, compared to HIIT, EAA, or CON.
Hypothesis 4: It was hypothesized that HIIT+EAA would result in greater increases in resting
metabolic rate (RMR) and fat oxidation, as indicated by a decrease in respiratory exchange ratio (RER), than HIIT, EAA, or CON.
Hypothesis 5: It was hypothesized that HIIT+EAA would result in greater increases in fasting
concentrations of circulating metabolomic markers of fat oxidation and mitochondrial oxidative capacity, than HIIT, EAA, or CON.
Exploratory Specific Aim 3: To evaluate the modulatory effects of sex on body composition and whole
body metabolic responses to EAA supplementation, HIIT, and a combination of the two.
Hypothesis 6: It was hypothesized that men would have greater changes in body composition,
muscle characteristics, and muscle architecture in response to HIIT+EAA than women.
Specifically, men would show greater loss of body fat, and greater increases in LM, mCSA, and muscle quality (decreased EI), than women.
Hypothesis 7: It was hypothesized that women would show more favorable metabolic changes in
response to HIIT+EAA, exhibiting greater fat oxidation, as determined by RER and metabolomics markers of fat oxidation.
Hypothesis 8: It was hypothesized men and women would have similar improvements in
cardiorespiratory fitness in response to HIIT.
DELIMITATIONS
2. Overweight or obese status: body mass index (BMI) of 28 – 40 kg·m-2 and %BF ≥ 25% for men, and BMI of 25 – 40 kg·m-2 and %BF ≥ 30% for women.
3. Healthy, non-smokers, who were apparently free from disease, reporting no current or history of cardiovascular disease, diabetes, metabolic, pulmonary, renal, hepatic, gastrointestinal,
musculoskeletal, mental disorders or medical or surgical events, such as bariatric surgery, heart surgery, or any joint or musculoskeletal surgeries occurring within 6-months prior to enrollment that would have significantly influence study outcomes or prevent safe participation, such as uncontrolled hypertension, an abnormal electrocardiogram, inconsistently taking medications (i.e. blood pressure medication, anti-depressants, anti-anxiety, hormonal contraceptives), or taking medications that may influence study outcomes (i.e. metformin, insulin, statins).
4. Women: eumenorrheic, reported consistent menstruation for three months prior to enrollment and were not pregnant or planning on becoming pregnant.
5. Participating in less than 150 minutes per week of moderate exercise, less than 2 days per week of resistance training, and were not currently participating in HIIT or had not participated in HIIT within 12 weeks prior to enrollment.
6. Weight stable: maintained weight (±eight pounds) within the three months prior to enrollment. 7. Not currently consuming a high protein diet (≥1.6 g·kg-1∙day-1 and/or ≥25% of calories from
protein) determined from a protein intake survey.
8. Not currently consuming meal replacements or dietary supplements that could influence LM or metabolism (i.e. protein, creatine, alanine, carnosine, taurine, or hydroxy beta-methylbutyate) within eight weeks prior to enrollment.
9. No known known sensitivities to the EAA treatment.
10. Not participating in another clinical trial within four weeks prior to enrollment that would influence study outcomes.
LIMITATIONS
1. Metabolomics measures metabolic products, but does not directly measure enzymatic content of energy producing pathways or mitochondrial content.
2. Echo intensity from ultrasound serves as an indirect measure of muscle quality, but does not differentiate between intramuscular connective tissue and intramuscular fat, which would require analysis of muscle biopsy.
3. Measurement of whole-body protein turnover provides information on the protein balance of the body, indicating states of protein synthesis or breakdown, but does not differentiate between myofibrillar muscle protein synthesis, mitochondrial biogenesis, or metabolic signaling pathways. 4. Measurements at baseline, 4-weeks and 8-weeks informs on chronic metabolic adaptations, but
does not directly inform the rate at which these adaptations may occur.
5. Results may not be translatable to populations exhibiting chronic disease states, such as diabetes, cardiovascular disease, or cancer.
6. Results may translate differently to older (>50 years) and younger (<25 years) populations.
ASSUMPTIONS
Theoretical
1. Subjects accurately reported health and exercise history information. 2. Subjects adhered to pre-testing guidelines.
3. Subjects provided accurate dietary intake information on nutrition logs. 4. Subjects adhered to supplementation and accurately report EAA intake.
5. Subjects maintained normal daily activity and nutritional habits throughout the intervention. Statistical
3. The sample variability was equal.
DEFINITION OF TERMS
Overweight and obese – body mass index (BMI) of 28 – 40 kg·m-2 and percent body fat (%BF) ≥ 25% for
men, and BMI of 25 – 40 kg·m-2 and %BF ≥ 30% for women [21]. Fat mass (FM) – all extractable lipids from adipose and other tissues in the body.
Percent body fat (%BF) – fat mass expressed as a percentage of total body mass.
Lean mass (LM) – all residual lipid-free chemicals and tissues including water, muscle, connective tissue,
organs, bone, and essential fats.
Total body volume (BV) – estimate of body size using dual-energy x-ray absorptiometry.
Total body water (TBW) – a measure of the intracellular and extracellular fluid compartments of the body
using bioelectrical impedance spectroscopy.
Total body bone mineral density (Mo) – a measure of the bone mineral content of the body estimated
using dual energy x-ray absorptiometry.
Visceral adipose tissue (VAT) –intra-abdominal adipose tissue estimated using dual energy x-ray
absorptiometry.
Muscle cross sectional area (mCSA) – measure of muscular size (cm2); determined by tracing the outline
of the muscle along the fascial border [22, 23].
Echo intensity (EI) – an indirect measure of muscle quality; a quantitative gray-scale analysis of muscle
composition from an ultrasound image that reflects contractile versus non-contractile (i.e. connective tissue and intramuscular fat) tissues [24].
Physiological cross sectional area (PCSA) – measure of muscle size (cm2), accounting for muscle
architecture; determined as muscle volume (cm3) divided by fiber length (cm) [25].
Pennation angle (PA) – angulation of muscle fascicles; defined as the angle between the deep aponeurosis
Fascicle length (FL) –length of muscle fascicles; defined as the distance between the superficial and deep
aponeuroses [26].
Muscle volume – measure of muscle size from cross section ultrasound scan [27].
Whole body protein turnover – the flux or rate at which protein-bound nitrogen moves toward protein
synthesis or protein breakdown.
Resting metabolic rate (RMR) – energy expended while at rest in a supine position, but still awake, as
measured using indirect calorimetry.
Respiratory exchange ratio (RER) – a measure of substrate utilization that uses a ratio of carbon dioxide
expired to volume of oxygen consumed to estimate the contribution of fat and carbohydrate to energy production.
Metabolomics – targeted metabolic profiling that involves comprehensive analysis of known circulating
metabolic intermediates that can be used to identify signatures of different metabolic states and provide insight into mechanisms of metabolic substrate selection and energy pathways [28]. Cardiometabolic markers – Fasting blood glucose (mmol/L), total cholesterol (mmol/L), high density
lipoproteins (HDL) (mmol/L), and non-high density lipoproteins (nHDL) (mmol/L). Cardiorespiratory fitness (VO2peak) – peak volume of oxygen consumed during a graded maximal
exercise test.
High-intensity interval training (HIIT) – alternating sets (6-10) of one minute of pedaling at a resistance
that corresponds with 90% max wattage and one-minute recovery at a self-selected resistance or complete rest.
Essential amino acids (EAA) – amino acids that cannot be synthesized by the human body and are
SIGNIFICANCE OF STUDY
Results of this study improve understanding of how HIIT promotes both fat loss and muscle gain, and how EAA supplementation influences these changes. Specifically, results of this study provide insights into pathways through which HIIT and EAA supplementation promote physiological and metabolic adaptions to promote improvements in body composition and metabolic health. The
CHAPTER II REVIEW OF LITERATURE
INTRODUCTION
Weight loss and the reduction of body fat are important components of improving metabolic health and reducing disease risk. A weight loss of 5-10% can effectively improve health outcomes associated with type 2 diabetes, cardiovascular disease, and other cardiometabolic diseases in overweight and obese adults [29, 30]. In order to achieve weight loss, a majority of governing bodies recommend a combination of caloric restriction and daily moderate physical activity [1, 30]. However, these
recommendations do not directly consider effects on body composition, underemphasizing the importance of maintaining metabolically active lean tissue while also reducing body fat.
Macronutrient intake and exercise intensity can have varying impacts on body composition and metabolic health. High-protein diets, compared to traditional high-carbohydrate diets, have been shown to promote greater fat loss, while reducing loss of lean mass (LM). These effects have been attributed to improvements in muscle protein synthesis, energy expenditure, fat oxidation, and hunger regulation [4, 8, 19]. When combined with exercise, high-protein diets promote even greater fat loss, while maintaining or even increasing LM [3, 5, 6].
scientific and clinical traction due to the rapid improvements in cardiorespiratory fitness and
mitochondrial oxidative capacity that can be achieved in significantly less time and volume than moderate intensity aerobic training [12, 33]. Recent evidence also suggests that HIIT promotes improvements in body composition, promoting fat loss and increases in LM [13-15, 18, 34, 35]. The potential for
simultaneous improvements in cardiometabolic health and body composition from as little as two weeks makes HIIT an appealing exercise option, especially for clinical populations, who are not able to
participate in a high volume exercise program. This review will evaluate mechanisms through which HIIT promotes improvements in body composition and metabolic health, particularly in regards to LM. This review will also evaluate how protein intake may support body composition and metabolic changes in response to HIIT, as well as potential modulatory effects of sex.
HIGH-INTENSITY INTERVAL TRAINING
A majority of research on HIIT has focused on the effects on cardiorespiratory fitness and skeletal muscle mitochondrial adaptations [11, 12, 41]. Both SIT and HIIT have been shown to elicit increases in cardiorespiratory fitness, mitochondrial density, and oxidative capacity that are comparable to moderate intensity continuous training (MICT), but achieved in 20% of the exercise time (30-60 minutes per week vs. 150 minutes per week, respectively) [33, 38, 42]. Skeletal muscle mitochondria serve as a primary regulator for substrate metabolism during submaximal exercise [41]. Increased mitochondrial density allows for greater fat oxidation, decreased reliance on carbohydrate/glycogen oxidation, and increased anaerobic threshold, supporting higher exercise intensity for a longer duration [41]. Metabolites associated with mitochondrial oxidation have been shown to be more pronounced with higher-intensity aerobic exercise compared to low-intensities [43]. Specifically, higher-intensity aerobic exercise was associated with significant increases in skeletal muscle concentrations of β-oxidation byproducts, primarily medium and long even-chain acylcarnitines [43]. This correlated strongly with abundance of mitochondrial enzymes, suggesting enhanced mitochondrial density and/or capacity [43]. Mitochondrial density is primarily regulated by the signaling proteins Ca2+/calmodulin-dependent protein kinase II (CaMKII) and AMP-activated protein kinase (AMPK), which in turn activates gene expression of peroxisome proliferator-activated receptor γ 1-α (PGC-1α) the primary regulator of mitochondrial biogenesis [41]. This process is initiated by elevated adenosine triphosphate (ATP) turnover, accumulation of metabolites, and production of reactive oxygen species [41].
During a single high-intensity bout lasting 30-60 seconds, ATP and phosphocreatine (PCr) stores are significantly reduced, and increased contribution from anaerobic glycolysis is required to maintain intensity [17, 44, 45]. Complete recovery of ATP/PCr stores can take up to 3-5 minutes, while complete recovery from anaerobic glycolysis may take an hour or more [17, 45]. Since recovery periods during a HIIT session only last one minute, ATP/PCr stores do not completely recover between exercise bouts and result in an increased dependence on anaerobic glycolysis and aerobic metabolism as the session
stimulates a significant catecholamine response, stimulating lipolysis from subcutaneous and
intramuscular triglyceride stores [17]. This stimulates an increase in post-exercise oxygen consumption, energy expenditure, and fat oxidation, in order to restore homeostasis [45]. During a single exercise session, energy expenditure has been shown to be greater during MICT compared to HIIT, due to the longer duration of MICT [46]. However, energy expenditure has been shown to be significantly greater for up to 60 minutes following a HIIT session compared to MICT [16] with no differences in post-exercise energy expenditure between the two at 24-hours post post-exercise, despite MICT lasting twice as long and involving twice as much work [46]. Elevated catecholamine levels that occur with high-intensity exercise and HIIT, promote lipolysis and lipid oxidation, especially in the post exercise period [17, 47]. Respiratory exchange ratio (RER), an indirect measure of substrate oxidation, was significantly elevated immediately following a HIIT session compared to MICT, indicating greater carbohydrate oxidation during exercise and reflecting the more anaerobic/high intensity nature of HIIT [16]. However, at 30 and 60 minutes post-exercise, RER was significantly lower with HIIT training than MICT,
suggesting HIIT favors greater fat oxidation in the post-exercise period [16]. These mechanisms may support improvements in body composition as a result of HIIT.
-0.06 kg for abdominal fat after 6-weeks [34]. Similarly, Sawyer et al. (2016), reported a significant decrease in percent body fat (-0.8%) after 3 days per week of HIIT, but a non-significant change in body fat (-0.9 kg) [52]. Differences could stem from baseline body fat percentages, with individuals with higher body fat at baseline potentially responding better [13, 53]. Differences could also be related to the
sensitivity of the body fat measurement technique. Based on results of previous studies, interval training appears to be an effective and efficient method for reducing body fat, resulting in similar reductions in body fat compared to MICT, but in a significantly reduced amount of exercise time.
Due to the significant effects of interval training on mitochondrial and cardiorespiratory changes, research has focused primarily on weight loss and fat loss with HIIT. However, in analyzing body composition, a number of studies have also reported increases in LM after interval training. Heydari et al. (2012) reported significant increases in fat-free mass (1.2 kg) and increased LM in the legs and trunk in overweight men after 12-weeks of SIT [54]. After 6-weeks of SIT, MacPherson et al. (2011) reported a significant 0.6 kg increase in FFM in healthy, recreationally active college students. Gillen et al. (2013) reported a non-significant 0.6 kg average increase in total body LM, but significant increases in leg and gynoid region LM and in overweight and obese women after 6 weeks of HIIT [34]. After three weeks of HIIT, Smith-Ryan et al. (2015, 2016) reported an average 1.9 kg and 2.2 kg increase in LM in overweight and obese men and women, respectively [13, 15]. Although these increases in total body LM were non-significant, follow-up analysis showed a significant increase in muscle cross sectional area of the vastus lateralis [14]. In contrast, meta-analysis collectively demonstrated no significant effect of HIIT on LM and a non-significant, but greater magnitude of change in LM was recorded for HIIT compared to MICT [48].
potential effect of exercise intensity on muscle hypertrophy [55]. Muscle hypertrophy occurs when muscle protein synthesis exceeds muscle protein breakdown and contractile elements actin and myosin enlarge, adding sarcomeres in series or in parallel [56]. This process is mediated by a number of
mechano-signaling pathways, including protein kinase B (Akt)/mammalian target of rapamycin (mTOR), mitogen-activated protein kinase (MAPK), and calcium-dependent pathways, that are initiated by
mechanical tension, muscle damage, and metabolic stress [56]. Little is known about the mechanisms through which HIIT may induce muscle hypertrophy. Using resistance training induced hypertrophy as a model, it has been theorized that the increased force, power, and contraction intensity required during a HIIT session, increases recruitment of high-threshold motor units and mechanical tension, leading to increased activation of mTOR, the primary regulator of muscle hypertrophy [56]. In support of this theory, high-intensity aerobic exercise, but not moderate intensity exercise, has been shown to increase activation of mTOR, which significantly correlated with increased rates of myofibrillar protein synthesis rates following an exercise bout [55]. After two weeks of HIIT, increased peak torque of a maximal voluntary contraction (MVC), in addition to an increase in electromyography (EMG) amplitude and motor unit discharge rate at high force levels, were attributed to the high-intensity nature of HIIT
compared to MICT [57]. Factors responsible for increases in maximal muscle strength include changes in muscle-fiber architecture, specifically muscle cross sectional area, and increased muscle activation [57, 58]. Although specific changes in muscle architecture with HIIT training have not been evaluated, increased muscle cross sectional area has been reported in overweight and obese adults after three weeks of HIIT [14]. It has also been suggested that the high, rapid contraction intensity of HIIT may damage contractile elements, inducing an acute inflammatory response, stimulating satellite cell repair and subsequent hypertrophy [18, 59]. Finally, the production of anaerobic metabolites may mediate the hypertrophic response, potentially increasing activity of anabolic transcription factors, increasing muscle fiber damage, and stimulating sympathetic nerve activation [56].
concentrations of several amino acids, most notably the branched-chain amino acids (BCAA) [43]. It was speculated that in the context of exercise training, amino acids may be diverted towards muscle protein synthesis rather mitochondrial energy production [43]. Muscle protein turnover, or the rate of muscle protein synthesis and breakdown, is one of the more variable components of resting energy expenditure, and greater LM significantly increases resting metabolic rate [60]. Muscle protein turnover is also primarily fueled by fat oxidation, which could contribute to decreases in body fat [60, 61].
PROTEIN SUPPLEMENTATION
The effects of exercise alone on weight loss and body composition changes are typically unremarkable, but when combined with a nutritional intervention (i.e. caloric restriction and/or
macronutrient manipulation) changes become much more pronounced [62, 63]. High-protein diets have been shown to be especially beneficial for positively altering body composition, supporting metabolically active lean tissue, while also promoting significant decreases in body fat [3, 5, 64-66]. High-protein diets are loosely defined as providing ≥25% of total energy intake from protein (PRO) or above 2.4 g·kg-1; commonly coupled with a reduction in carbohydrate (CHO) intake (40-50% of energy intake) [65]. Protein intakes of 1.2 – 1.6 g·kg-1·d-1 have been shown to promote positive physiologic and metabolic responses in individuals with type 2 diabetes and metabolic syndrome, while intakes of 1.2 – 2.4 g·kg-1·d -1 are recommended to promote recovery and adaptation from endurance and strength training [8, 9]. The primary role of dietary protein is to provide amino acids that are essential for building structural proteins in the body, but protein also has many metabolic roles, most notably, stimulation of muscle protein synthesis [66, 67].
stimulator of MPS, stimulating a positive protein balance [19, 66]. When EAAs are consumed prior to or following exercise, the positive protein balance is augmented [19, 66, 68-70].
There are numerous studies supporting the beneficial effects of PRO intake with exercise on body composition and metabolism. In a classic study by Layman et al. (2003), overweight and obese women who consumed diets with a lower CHO:PRO ratio (1.4:1; 171 g CHO and 125 g PRO per day) lost more body weight, specifically more body fat (-5.6 kg vs. -4.74 kg) and less LM (-0.88 kg vs. -1.21 kg), compared to women who consumed a higher CHO:PRO ratio diet (3.5:1; 239 g CHO and 68 g PRO per day) [64]. When combined with an aerobic and resistance training program designed to meet physical activity recommendations, women consuming the high-protein diet lost even greater body fat (-8.8 kg) and minimized loss of LM (-0.4 kg) [5]. In a study by Arciero et al. (2014), overweight and obese adults who consumed 20g of whey protein 3 times per day combined with a multimodal exercise program that included interval training, lost significantly more body fat (-2.8 kg vs. -1.0 kg), gained a greater
percentage of LM (2.0% vs. 0.6%), and improved indicators of insulin sensitivity, compared to a PRO only group [3]. When combined with 6 days per week of a combined resistance and HIIT exercise program, Longland et al. (2016) showed that consumption of 1.2 g·kg-1·d-1 of PRO was effective for maintaining LM and promoting fat loss, while 2.4 g·kg-1·d-1 of PRO was effective for increasing LM (+1.2 kg), despite a significant caloric deficit (40% reduction) [6]. Both groups also improved strength, aerobic, and anaerobic performance outcomes [6].
Few studies have directly evaluated how nutrient intake influences the unique metabolic
this has not been shown to benefit performance, this ‘train low’ approach enhances the catecholamine response to a high intensity workout, stimulating greater fat and intramuscular lipolysis, and increases stimulation of AMPK, p38 MAPK, and PGC-1α, the same mechanisms upregulated by HIIT that significantly increasing mitochondrial biogenesis and oxidative capacity [71, 73]. While CHO consumption in these studies was shown to blunt the stimulation of key signaling pathways associated with mitochondrial adaptation, PRO consumption did not attenuate signaling, and it was recommended that 20-25g of protein be consumed before, during, and/or after exercise in order to maintain protein balance and support muscular recovery [71, 73]. These studies suggest that protein consumption, rather than CHO consumption, around a HIIT session may enhance mitochondrial biogenesis and fat oxidation while also supporting MPS.
In addition to supporting mitochondrial and muscular adaptation, protein consumption prior to a HIIT bout has been shown to significantly increase post-exercise energy expenditure and fat oxidation, to a greater degree than CHO consumption [16]. Protein has a higher thermic effect of feeding compared to carbohydrate and fat, which can contribute to a greater energy expenditure [74, 75]. Protein intake would also stimulate greater muscle protein turnover, increasing energy expenditure and fat oxidation associated with maintenance of LM, as previously described [60, 61].
SEX DIFFERENCES
who lost weight and those who did not, suggesting other non-lifestyle mechanisms may influence the female response to exercise [77]. In a strains of mice bred to respond negatively to exercise (i.e. gain weight), males responded similarly to MICT and HIIT, while females gained fat after a MICT program, but lost fat after HIIT; suggesting that sex and genetic background can influence response to exercise [78].
There is considerable debate as to whether males and females respond differently to HIIT. Males have been reported to have greater increases in cardiorespiratory fitness [79], fat loss [80, 81], increased mixed muscle protein synthesis [35], and improved metabolic outcomes, notably improved glycemic control [82, 83], compared to females. In contrast, one study reported females to have greater
improvements in cardiorespiratory fitness [81], while a majority of studies report no effect of sex on the cardiorespiratory [35, 82-85], body composition [81, 85], or metabolic [81, 84-88] effects of HIIT. Differences in response to HIIT training have been attributed to males having greater glycogen breakdown during sprints, greater anaerobic capacity, greater portion of type II fibers, and a greater catecholamine response than women [11]. Despite these suggested differences, very few studies directly address sex differences in response to HIIT [35, 79, 81, 84, 85, 87], with only two evaluating differences in body composition responses [81, 85]. Using a 3-site skinfold model, Astorino et al. (2011) reported no changes in percent body fat in men (-0.3%) or women (+0.2%) after six sessions of SIT over the course of 2-3 weeks [85]. Using dual-energy x-ray absorptiometry, Bagley et al (2016) reported that men lost a greater percentage of FM (-1.5%) and trunk fat (-0.7kg), than women (FM: -0.1%; trunk fat: -0.1 kg), after 12-weeks of SIT [81]. Men also tended to gain more LM (+0.7 kg) than women (+0.1 kg) [81].
sensitivity [90]. It was further suggested that these effects may be tissue specific, with a greater impact on skeletal muscle mitochondria [90], which would have important implications for substrate metabolism during exercise. Other studies in overiectomized rats have shown that estradiol treatment stimulates mitochondrial biogenesis and oxidative capacity [90, 91], while estradiol treatment in male rats reduced glycogen utilization, increased lipid availability, and improved 2 hour exercise running performance [92]. In humans, post-menopausal women taking hormone replacement therapy had greater improvements in insulin sensitivity with exercise training compared to post-menopausal women not taking hormone replacement therapy [93]. In exercising men, eight days of 17 β-estradiol supplementation reduced CHO utilization and increased fat utilization, suggesting that estradiol influences substrate metabolism during exercise [94].
CONCLUSION
High intensity interval training significantly improves cardiorespiratory fitness and oxidative capacity in both men and women, and may be an efficient and effective approach for improving body composition. Fat reduction as a result of HIIT has been shown to be similar to MICT, but in a
significantly reduced amount of exercise time [41]. Increases in LM, in combination with decreased body fat, have been reported with HIIT in a few as three weeks or nine sessions of HIIT [13, 15]. Body
composition changes as a result of HIIT could have significant health benefits, but more research is needed to understand the mechanisms through which HIIT may be supporting hypertrophy. Protein supplementation, in combination with HIIT training, may promote even greater changes in body composition, stimulating MPS, while metabolically, enhancing mitochondrial biogenesis and fat
CHAPTER III METHODOLOGY
EXPERIMENTAL DESIGN
Using a 2:2:2:1 block randomized design, participants were randomized, to one of four, eight-week intervention groups: 1) HIIT, two days per eight-week of cycle ergometry; 2) essential amino acids (EAA) supplementation (7.2 grams EAA daily); 3) HIIT+EAA; or 4) control (CON), no intervention maintaining normal diet and exercise habits (Figure 2). Measurements of body composition, metabolic rate, substrate metabolism, and cardiorespiratory fitness were measured at baseline, 4weeks, and 8weeks; cardiometabolic markers and metabolomic markers were measured at baseline and 8weeks. Whole-body protein turnover was measured in a subsample of individuals from the HIIT (N=8), EAA (N=7), and HIIT+EAA (N=7) groups at baseline and 8weeks.
Prior to enrollment, all participants completed a phone screening for inclusion/exclusion criteria. Those determined to be eligible based on the phone screening completed an in-person enrollment visit in which they provided written informed consent, completed a health history questionnaire to confirm inclusion/exclusion criteria, and underwent a 12-lead electrocardiogram (EKG). Women completed a urine pregnancy test to confirm negative status. Participants were asked to arrive to testing sessions following a 12 hour fast, consuming no food, caffeine, or alcohol. Participants were also be asked to abstain from physical activity for 24 hours prior to testing.
SUBJECTS
criteria (44 of whom were excluded during a full telephone screening), and 331 did not respond to the initial contact or lost to follow-up, resulting in 89 individuals who met initial inclusion criteria and completed an in-person enrollment visit. At the enrollment visit, five individuals were excluded for reasons related to exceeding exercise criteria (N=2), pregnant (N=1), and BMI too high (N=2). This resulted in 84 individuals who were randomized to one of the four intervention arms and scheduled for baseline testing. Fourteen individuals did not return for baseline testing, for reasons related to starting medication (N=1), pregnancy (N=1), withdraw for personal reasons (N=3), and lost to follow-up (N=9); four individuals completed baseline testing, but dropped out before completing mid-or post-testing due to sickness (N=2) and lack of time (N=1), and were excluded from the final analysis. Full CONSORT information is reported in figure 1.
Sixty-six overweight and obese men (N=33) and women (N=33), 25 – 50 years participated in the current study (Race: 69% White, 13% Black, 4% Hispanic, 3% Asian, 11% Two or more races; Age: 36.7 ± 6.0 years; Height: 171.4 ± 9.8cm; Weight: 94.5 ± 14.7 kg; %BF: 36.0 ± 7.8%). Overweight and obese was defined as a body mass index (BMI) of 28 – 40 kg·m-2 and/or percent body fat (%BF) ≥ 25% for men, and BMI of 25 – 40 kg·m-2 and/or %BF ≥ 30% for women [21] determined by measured height (stadiometer; Perspective Enterprises, Portage, MI, USA) and weight (mechanical scale; InBody770, BioSpace, Seoul, South Korea) and %BF from bioelectrical impedance analysis (InBody770, BioSpace, Seoul, South Korea), respectively. Women were eumenorrheic, determined as reporting consistent menstruation for the three months prior to enrollment, and confirmed not-pregnant by a urine HCG pregnancy test. Participants were otherwise healthy, non-smokers, who participated in less than 150 minutes per week of moderate exercise, less than two days per week of resistance training, and had not participated in HIIT in the 12 weeks prior to enrollment. Individuals were excluded from participation if they: 1) had current and/or history of cardiovascular disease, diabetes, metabolic, thyroid, pulmonary, renal, hepatic, gastrointestinal, musculoskeletal disorders or medical or surgical events, such as bariatric surgery, heart surgery, or any joint or musculoskeletal surgeries occurring the 6-months prior to
mental disorder; 4) were taking medications inconsistently (i.e. blood pressure medication, anti-depressants, anti-anxiety, hormonal contraceptives) or were taking a medication that could influence primary study outcomes (i.e. metformin, insulin, thyroid); 5) had lost or gained greater than eight pounds within three months prior to enrollment; 6) were consuming a high protein diet, defined as consuming ≥1.6 g·kg-1∙day-1 [65]; 7) were consuming meal replacements or dietary supplements within eight weeks prior to enrollment, specifically protein, creatine, alanine, carnosine, taurine, or hydroxy beta-methylbutyrate; 8) had known sensitivity to the EAA supplement; 9) participated in another clinical trial that may influence study outcomes within four weeks prior to enrollment; 10) had severely impaired hearing or speech or inability to speak English; 11) were unwilling or unable to comply with the study protocol, including abstaining from food and caloric beverages (12 hrs), caffeine (12 hrs), alcohol (24 hrs), and physical activity (24 hrs) prior to testing days.
PROCEDURES
Body Composition
A four compartment (4C) model, previously validated by our laboratory (Equation 1), were used to estimate fat mass (FM), percent body fat (%BF), and fat-free mass (FFM) [98]. Components of this equation include: 1) body volume (Equation 2), derived from a dual-energy x-ray absorptiometry total body scan (DXA; GE Lunar iDXA, GE Medical Systems Ultrasound & Primary Care Diagnostics, Madison, WI, USA) [98]; 2) total body water, measured using multi-frequency bioelectrical impedance spectroscopy (BIS; SFB7, ImpediMed, Queensland, Australia); and 3) total body bone mineral density (Mo; Equation 3), calculated using total body bone mineral content (BMC), measured from the DXA. Equation 1: FM (kg) = 2.748(BV) – 0.699(TBW) + 1.129(Mo) – 2.051(BM)
%BF = (FM/BM) × 100 FFM (kg) = BM – FM Equation 2: BV (L) = 𝐹𝑀
0.84+ 𝐿𝑀 1.03+
𝐵𝑀𝐶
Equation 3: Mo = BMC × 1.0436
Test re-test reliability for the 4C model from our laboratory is as follows: FM (intraclass correlation coefficient (ICC)=0.995, standard error of measure (SEM)=0.831 kg, minimum difference (MD)=2.30 kg); %BF (ICC=0.982, SEM=0.960%, MD=2.6%); and FFM (ICC=0.996, SEM=0.999 kg, MD=2.75 kg).
Dual-energy x-ray absorptiometry
Prior to scanning, subjects will be asked to remove all metal, plastics, and heavy clothing, wearing only lightweight athletic clothing. Subjects were positioned in a supine position in the center of the scanning table, with arms and legs inside the scanning parameter. Participants larger than the scanning area were positioned such that the entire right side of the body was inside the scanning
Bioelectrical impedance spectroscopy
While lying supine on a table with separation between the limbs, leads were connected to four electrodes placed on the right wrist (bisecting the ulnar head), five centimeters distally on the hand, the right ankle (bisecting the malleoli), and five centimeters distally on the foot. The average of two measurements was recorded for TBW, intracellular fluid (ICF), and extracellular fluid (ECF).
Muscle Characteristics
Muscle cross-sectional area (mCSA) of the vastus lateralis (VL), rectus femoris (RF), and vastus medialis (VM) was determined from panoramic ultrasound (US) scans of the thigh (GE LOGIQ-e, Software version R8.0.7, GE Healthcare, Wisconsin, USA) using a linear array US transducer prode (GE: 12L-RS) and standardized frequency (10 Hz) and gain (50) settings [22, 23]. Measurements were made by applying the device probe directly against the skin at the peak anatomical cross-sectional area of each muscle, defined as 30%, 50%, and 60% of femur length for the VM, VL, and RF, respectively.
Pennation angle (PA) and fascicle length (FL) of the VL were evaluated from panoramic scans along the fascicle plane at 50% of femur length [26]; muscle volume (mV) was evaluated from cross-sectional scans of the VL taken at 25%, 50%, and 75% of muscle length [mV = (25% muscle length (cm) × 25%mCSA (cm2)) + (25% muscle length (cm) × 50%mCSA (cm2)) + (25% muscle length (cm) × 75%mCSA (cm2))] [27, 100]. The scans were performed by the same technician while the subject lay supine with the right leg extended and relaxed on the examination table for approximately 5 minutes.
technician performed all analysis for each outcome. All images will be exported and analyzed using Image-J software (National Institutes of Health, USA, version 1.51). Each image was individually
calibrated for analysis by measuring the number of pixels in a known distance (image depth). Two images from each location were analyzed and an average of the two measures was reported. Test-retest reliability for mCSA and EI from our lab are as follows: mCSA ICC=0.99, SEM of 0.744 cm2; EI ICC=0.99, SEM=1.5 a.u.
Total Body Protein Turnover
Whole body protein turnover (g N/24hr) was be determined by [15N]alanine isotope tracer (98% enriched, Cambridge Isotope Lab, Andover, MA) [102], in which participants ingested a 2.00 gram dose of [15N]alanine mixed with water. For the 24hrs following ingestion, participants were asked to collect urine from all voids and keep a diet record of all food and drink consumed. Diet records were analyzed for protein intake (g) to account for dietary nitrogen intake. A zero and 24-hour blood draw was collected to measure blood urea nitrogen. Isotopically labeled nitrogen from the urine samples was used to
determine nitrogen flux according to Fern et al.[103]. Total body protein synthesis (PS) and breakdown (PB) was calculated from urine samples according to Stein et al. [104] and used to determine net protein balance and flux. Samples were analyzed at the Center for Translational Research in Aging and
Longevity, University of Arkansas Medical Sciences, Little Rock, AR.
Resting Metabolic Rate and Substrate Metabolism
reliability from our lab are as follows: RMR (ICC=0.94, SEM=125.6 kcal·day-2, MD=244.3 kcal·day-2) and RER(ICC=0.83, SEM=0.03 arbitrary units (a.u.), MD=0.05 a.u.).
Cardiometabolic Blood Markers and Metabolomics
Fasting blood glucose, total cholesterol, triglycerides, HDL-cholesterol, non-HDL were measured from a 4 ml blood sample, immediately analyzed using an Alere Cholestech LDX® Analyzer. Serum from a 4 ml blood sample was separated and analyzed for insulin using established enzymatic assays. Fasting EDTA plasma from another 4 ml blood sample was analyzed for circulating metabolites using a targeted mass spectrometry-based platform [105, 106]; these include fasting concentrations of branched-chain amino acids (leucine, isoleucine, valine) and acylcarnitines [43, 107] (Appendix 1). All blood draws were done in the Applied Physiology Lab by an individual trained in phlebotomy.
Cardiorespiratory Fitness
achieved during the test was recorded as the max HR. The highest wattage achieved during the exercise test was used to set an appropriate individualized training load for the start of the HIIT protocol.
Dietary Intake
Subjects were asked to complete three-day dietary logs at baseline, 4weeks, and 8weeks to account for the influence of normal dietary intake. Subjects were instructed to record all food and drink consumed on two, non-consecutive weekdays and one weekend day. Subjects were given detailed verbal and printed instructions on how to complete the diet logs and estimate portion sizes. Instructions
High-Intensity Interval Training
Those assigned to participate in HIIT, trained two days per week for eight weeks. All training occurred on a cycle ergometer (Corival Lode, Gronigen, The Netherlands), in the Applied Physiology Lab on the UNC campus, with one-on-one supervision from trained research personnel. Each session
consisted of a self-selected warm-up (≤5 minutes), followed by alternating sets of one minute of pedaling at a resistance that corresponded with 90% max wattage and one-minute recovery at complete rest (Figure 3A). After each interval, HR was recorded and subjects were asked to rate their exertion using a Borg Rating of Perceived Exertion scale. Individuals started with six sets of intervals, adding one additional set each week until reaching 10 sets at week five and maintaining 10 sets for the remainder of the 8 weeks (Figure 3B). On the last set of each session, individuals were asked to ride as long as possible. If the individual was able to ride for an additional 15 seconds (75 seconds total), resistance was increased by 7% at the next session to maintain an appropriate individualized high intensity workload (based on unpublished pilot data). If the individual did not ride for longer than 15 seconds, the resistance was maintained for the next session. At least 24-hours separated training sessions. Intensity was individualized for each participant based on maximum wattage reached during baseline cardiovascular fitness (VO2peak) testing. Completion of at least 13 sessions was considered compliant.
Essential Amino Acid Supplementation
training days, provided by the study staff. All participants were given a log to record supplement consumption at home. Empty tubs were returned and collected at 4weeks and 8weeks to track compliance. 80% consumption (g) was considered compliant.
STATISTICAL ANALYSIS Sample Size Determination
A priori power calculations: When considering multiple effect size calculations (F=0.129-0.423)
[111] from between group comparisons of changes in FM (kg), LM (kg), mCSA (cm2), and %BF following HIIT, protein supplementation, or a combination of exercise and protein supplementation [3, 13-15], a sample size of 70 was considered sufficient to achieve a power of 0.8, for four groups (HIIT, EAA, HIIT+EAA, CON) and three measures (base, 4wk, 8wk), with a conservative correlation of 0.5 among repeated measures, a nonsphericity correction є of 1, and a significance level of 0.05. In order to account for at least 10% dropout and maintain equal male/female representation in each intervention group, 78 participants were aimed to be enrolled. Power calculation were conducted using G-Power version 3.1.9.2, with an ANOVA: repeated measures, within-between interactions F-test.
Statistical Procedures
A modified intent-to-treat analysis was conducted, including only participants who completed mid- (N=66) and/or post-testing (N=62). Adherence was evaluated based on number of sessions completed and/or total grams of EAA supplement consumed.
Manuscript 1: Group-by-time interaction effects on body composition (FM, LM, %BF, VAT), metabolic
baseline values. In the absence of a significant interaction effect, the interaction term was removed from the model to evaluate simple main effects. One-way repeated measures ANOVAs were used to evaluate simple main effects for time; one-way between-subject ANOVAs were used to evaluate simple main effects for group. Significant one-way ANOVAs were followed by pairwise t-tests using Bonferroni corrections for multiple comparisons. 95% confidence intervals (95% CI) on mean change scores adjusted for baseline values were also completed to assess changes from 0-4weeks, 4-8weeks, and 0-8weeks. If the 95% CI included zero, the mean change score was not considered statistically significant or no
statistically significant change (p>0.05). If the 95% CI interval did not include zero, the mean change score was considered statistically significant (p ≤ 0.05).
Group-by-time-by-sex interaction effects on body composition, metabolic rate, substrate utilization, and cardiorespiratory fitness were evaluated using separate 4 × 2 × 2 [group (EAA vs. HIIT vs. HIIT+EAA vs. CON) × time (4week vs. 8 week) × sex (male vs. female)] mixed factorial ANCOVAs, covaried for baseline values, using the same procedures as described for full group effects. Group-by-sex differences in cardiometabolic markers at 8weeks were evaluated using 4 × 2 mixed factorial ANCOVAs [group × sex], covaried for baseline values. 95% CI were also completed to assess changes from 0-4weeks, 4-8weeks, and 0-8weeks.
Manuscript 2: Using the same procedures as described for manuscript 1, group by time interaction effects
on total body LM and thighLM, were evaluated using separate 4 × 2 [group (EAA vs. HIIT vs. HIIT+EAA vs. CON) × time (4week vs. 8 week)] mixed factorial ANCOVA’s, covaried for baseline values. Secondary outcomes including muscle size (mCSA, MV), quality (EI), and architecture characteristics (FL, PA) were also evaluated using 4 × 2 mixed factorial ANCOVA’s, covaried for baseline values. Differences in whole-body protein turnover between groups (HIIT vs. EAA vs.
characteristics were evaluated using separate 4 × 2 × 2 (group × time × sex) mixed factorial ANCOVA’s, covaried for baseline values.
CHAPTER IV MANUSCRIPT 1
BODY COMPOSITION AND METABOLIC EFFECTS OF HIGH-INTENSITY INTERVAL TRAINING AND ESSENTAIL AMINO ACID SUPPLEMENTATION
INTRODUCTION
Obesity is associated with a myriad of metabolic health complications partially attributed to
dysregulation of skeletal muscle metabolism [60, 82]. Disruption in skeletal muscle oxidative capacity is an underlying factor in the development of insulin resistance, metabolic syndrome, and cardiovascular disease [12, 60, 112]. Physical activity is essential for maintaining skeletal muscle health and reducing cardiometabolic disease risk [1, 2]. Despite known benefits, more than half of adults do not meet the recommended minimum of 150 min of moderate intensity exercise [10], creating a need for more sustainable approaches to exercise for the improvement of metabolic health.
associated with resistance exercise, but myofibrillar protein synthesis rates have been shown to be increased for up to 48 hours following a high-intensity exercise session [18, 55], suggesting HIIT could stimulate muscle hypertrophy. Simultaneous fat loss and muscle gain, in combination with an increase in cardiorespiratory fitness would have significant health implications.
Nutritional support, specifically from protein, is needed to support increases in LM. The stimulatory effects of protein on muscle protein synthesis are primarily driven by essential amino acids (EAA) [116, 117]. Free-form EAA supplementation has been shown to stimulate a greater anabolic response compared to a mixed meal or whey protein in recreationally active men [117]. Ingestion of 6g of EAA has also been shown to effectively increase muscle protein balance following a bout of resistance exercise [116]. Although this small dose effectively stimulated an increase in muscle protein when combined with resistance exercise, the effect when combined with HIIT has not yet been evaluated [116, 117].
METHODS: Participants
An original 651 individuals expressed interest and were sent initial information about the study. Of those who initially expressed interest, 37 declined, 194 were excluded for not meeting inclusion criteria (44 of whom were excluded during a full telephone screening), and 331 did not respond to the initial contact or lost to follow-up, resulting in 89 individuals who met initial inclusion criteria and completed an in-person enrollment visit. At the enrollment visit, five individuals were excluded for reasons related to exceeding exercise criteria (N=2), pregnant (N=1), and BMI too high (N=2). This resulted in 84 individuals who were randomized to one of the four intervention arms and scheduled for baseline testing. Fourteen individuals did not return for baseline testing, for reasons related to starting medication (N=1), pregnancy (N=1), withdraw for personal reasons (N=3), and lost to follow-up (N=9); four individuals completed baseline testing, but dropped out before completing mid-or post-testing due to sickness (N=2) and lack of time (N=1), and were excluded from the final analysis. Full CONSORT information is reported in figure 1.
A final 66 overweight and obese men (N=33) and women (N=33) between the ages of 25 – 50 years completed baseline testing (Race: 69% White, 13% Black, 4% Hispanic, 3% Asian, 11% Two or more races; Age: 36.7 ± 6.0 years; Height: 171.4 ± 9.8cm; Weight: 94.5 ± 14.7 kg; %BF: 36.0 ± 7.8%) (Table 1). Overweight and obese was defined for men as a body mass index (BMI) of 28 – 40 kg/m2 and/or body fat percentage (%BF) ≥ 25%, and for women as a BMI of 25 – 40 kg·m-2 and/or %BF ≥ 30% [21], determined by measured height (stadiometer; Perspective Enterprises, Portage, MI, USA) and weight (mechanical scale; InBody770, BioSpace, Seoul, South Korea) and %BF from bioelectrical impedance analysis (InBody770, BioSpace, Seoul, South Korea), respectively. Women were
instructed to maintain habitual lifestyle and activity levels for duration of the study. Individuals were excluded from participation if they: 1) had current and/or history of cardiovascular disease, diabetes, metabolic, thyroid, pulmonary, renal, hepatic, gastrointestinal, musculoskeletal disorders or any medical or surgical events, 6-months prior to enrollment; 2) had uncontrolled hypertension or an abnormal electrocardiogram; 3) were taking medications inconsistently (i.e. blood pressure medication, anti-depressants, anti-anxiety, hormonal contraceptives) or were taking a medication that could influence primary study outcomes (i.e. metformin, insulin, thyroid); 4) had lost or gained greater than eight pounds within three months prior to enrollment; 5) were consuming a high protein diet, defined as consuming ≥1.6 g·kg-1∙day-1 [65]; 6) were consuming meal replacements or dietary supplements within eight weeks prior to enrollment, specifically protein, creatine, alanine, carnosine, taurine, or hydroxy beta-methylbutyate; or 7) had known sensitivity to the EAA supplement; 8) participated in another clinical trial that may influence study outcomes within four weeks prior to enrollment; 9) had severely impaired hearing or speech or inability to speak English; 11) were unwilling or unable to comply with the study protocol, including abstaining from food and caloric beverages (12 hrs), caffeine (12 hrs), alcohol (24 hrs), and physical activity (24 hrs) prior to testing days.
<Figure 1: CONSORT information>
Experimental Design
underwent a 12-lead electrocardiogram (EKG) prior to baseline testing. Participants were asked to abstain from food and caloric beverages (12 hrs), caffeine (12 hrs), alcohol (24 hrs), and physical activity (24 hrs) prior to testing sessions and removed all metal, plastics, and heavy clothing upon arrival, to avoid
interference with measures. All procedures were approved by the University Biomedical Institutional Review Board.
<Figure 2: Experimental Design>
Procedures
Body Composition
A four compartment (4C) model, (Equation 1) was used to estimate fat mass (FM), percent body fat (%BF), and fat free mass (FFM) [98]. Components of this equation include: 1) body volume (BV; Equation 2), derived from a dual-energy x-ray absorptiometry total body scan (DXA; GE Lunar iDXA, GE Medical Systems Ultrasound & Primary Care Diagnostics, Madison, WI, USA) [98]; 2) total body water (TBW), measured using multi-frequency bioelectrical impedance spectroscopy (BIS; SFB7, ImpediMed, Queensland, Australia); and 3) total body bone mineral density (Mo; Equation 3), calculated using total body bone mineral content (BMC), measured from the DXA.
Equation 1: FM (kg) = 2.748(BV) – 0.699(TBW) + 1.129(Mo) – 2.051(BM) %BF = (FM/BM) × 100
LM (kg) = BM – FM Equation 2: BV (L) = 𝐹𝑀
0.84+ 𝐿𝑀 1.03+
𝐵𝑀𝐶
11.63+ (−3.12)
Equation 3: Mo = BMC × 1.0436
0.831 kg, 0.960%, 0.999 kg, and minimum difference (MD) of 2.30 kg, 2.6%, 2.75 kg for FM, %BF, and LM, respectively.
Dual-energy x-ray absorptiometry
For total body DXA scans, subjects were positioned in a supine position in the center of the scanning table, with arms and legs inside the scanning parameter. All DXA scans were performed and analyzed by a trained technician, following manufacturer guidelines and using manufacturer software (enCORE Software Version 16). Visceral adipose tissue (VAT) mass (kg2) and volume (cm3) was quantified from the pre-defined android ROI set by DXA software. This region is defined as the area spanning 20% of the distance from the top of the iliac crest to the base of the skull [99]. Test-retest reliability for VAT measurements from our lab are as follows: Mass (ICC=0.98, SEM=0.11 kg, and MD=0.22 kg) and volume (ICC=0.98, SEM=118.73 cm3, and MD=233.85 cm3).
Bioelectrical impedance spectroscopy
For the determination of TBW, leads were connected to four electrodes placed on the right wrist (bisecting the ulnar head), five centimeters distally on the hand, the right ankle (bisecting the malleoli), and five centimeters distally on the foot, while the participant lay supine with separation between the limbs. The average of two measurements was recorded for TBW, intracellular fluid (ICF), and extracellular fluid (ECF).
Resting Metabolic Rate and Substrate Metabolism
Resting metabolic rate (RMR) and respiratory exchange ratio (RER) were evaluated using
RER were averaged over the remaining 25 minutes of the test. Test-retest reliability from our lab are as follows: RMR (ICC=0.94, SEM=125.6 kcal·day-2, MD=244.3 kcal·day-2) and RER(ICC=0.83,
SEM=0.03 arbitrary units (a.u.), MD=0.05 a.u.).
Cardiorespiratory Fitness
Peak oxygen consumption (VO2) and ventilatory threshold (VT) were determined from a ramp based exercise test on an electronically braked cycle ergometer (Corival Lode, Gronigen, The
Netherlands). Following a two minute warm-up at 20watts (W), intensity increased 1W every 3 seconds until volitional fatigue; participants were instructed to maintain a pedal cadence between 60-80 rpms for the entirety of the test. Respiratory gases were analyzed breath-by-breath using indirect calorimetry (Parvo Medics TrueMax 2400®, Salt Lake City, UT); the three highest oxygen consumption values were averaged and recorded as VO2 (VO2rel; ml/kg/min). In accordance with pre-established criteria [108], the test was considered maximal if it met a minimum of two of the following criteria: a plateau or heart rate within 10% of age-predicated HR max; a plateau or increase of no more than 150 ml/min in VO2; or achieved an RER >1.15. Ventilatory threshold (VT) was determined as the intersection point of two linear regression lines fitted to the upper and lower portion of the ventilation versus VO2 curve using
manufacturer software (True One 2400® Metabolic Measurement System, Parvo-Medics Inc., Provo UT) [109]. Heart rate (HR) was monitored throughout the test (Polar Electro Inc., Lake Success, NY); the highest HR achieved during the test was recorded as the max HR. The highest wattage achieved during the exercise test was used to set an appropriate individualized training load for the start of the HIIT protocol. Test-retest reliability for the VO2 protocol are as follows: ICC=0.98 and SEM=1.74 ml/kg/min.
Cardiometabolic Blood Markers
LDX® Analyzer. All blood draws were drawn and analyzed in the Applied Physiology Lab, University of North Carolina at Chapel Hill, Chapel Hill, NC.
Dietary Intake
Subjects were asked to complete three-day dietary logs at baseline, 4weeks, and 8weeks to account for the influence of normal dietary intake. Subjects were instructed to record all food and drink consumed on two, non-consecutive weekdays and one weekend day. Subjects were given detailed verbal and printed instructions on how to complete the diet logs and estimate portion sizes. Instructions
included: recording the amount of food, drink, gum, candy, condiments, supplements, etc. as consumed at each meal and snack throughout the day and providing as much detail about portion size, brand names, and preparation techniques as possible. Diet logs analyzed for average calories (CAL; kcal), carbohydrate (CHO; g), fat (FAT; g), and protein (PRO; g) and relative protein (g/kg body mass) intake using nutrition analysis software (The Food Processor, version 10.12.0, Esha Research, Salem, OR, USA).
High-Intensity Interval Training
Training sessions occurred two days per week for eight weeks. All training occurred on an electronically braked cycle ergometer (Corival Lode, Gronigen, The Netherlands) with one-on-one supervision from trained research personnel. Each session consisted of a self-selected warm-up (≤5 minutes), followed by alternating sets of one minute at 90% maximal intensity (as determined from graded exercise test) and one-minute recovery at complete rest (Figure 3A). Participants were instructed to maintain a pedal cadence between 60-80 rpm; heart rate and rating of perceived exertion were recorded after each interval. Training sessions were separated by at least 24 hours, with preferential scheduling on non-consecutive days.
ride-to-fatigue during the last set of each training session in which participants were instructed to ride until volitional fatigue. If the individual was able to ride for an additional 15 seconds (75 seconds or longer), workload was increased by 7% at the next session (based on unpublished pilot data); if the individual rode for <75 seconds, the resistance was maintained for the next session. Completion of at least 13 sessions (80%) was considered compliant.
<Figure 3: HIIT protocol>
Essential Amino Acid Supplementation
Participants were instructed to consume an EAA powder mixed with water (8-12 oz), two times per day (REAAL, Twinlab Corporation, Hauppauge, NY, USA). One serving of the powder contained 3.6 g of a patented-ratio blend of leucine, lysine HCl, valine, isoleucine, arginine, threonine, L-phenylalanine, L-methionine, L-histidine, and L-tryptophan, formulated to support muscle growth. Participants were instructed to consume the supplement between meals; one serving between the hours of 9:00am – 12:00pm and the second serving between the hours of 3:00pm – 11:00pm, with at least 3 hours separating doses. For participants randomized to the HIIT+EAA group, the EAA supplement was consumed 30 minutes prior to- and 30 minutes after the HIIT session on training days, provided by the study staff. All participants were given a log to record supplement consumption at home. Empty tubs were returned and collected at 4weeks and 8weeks to track compliance.
Statistical Analysis: