Unit Nonresponse in a Population-Based
Study of Prostate Cancer
Evrim Oral1
*, Neal Simonsen2, Christine Brennan3, Jennifer Berken4, L. Joseph Su5,
James L. Mohler6,7, Jeannette T. Bensen7, Elizabeth T. H. Fontham8
1 Biostatistics Program, LSUHSC School of Public Health, New Orleans, Louisiana, United States of
America, 2 Consultant Epidemiologist, New Orleans, Louisiana, United States of America, 3 Health Policy and Systems Management Program, LSUHSC School of Public Health, New Orleans, Louisiana, United States of America, 4 Department of Mathematical Sciences, McNeese State University, Lake Charles, Louisiana, United States of America, 5 Department of Epidemiology, University of Arkansas for Medical Sciences, Little Rock, Arkansas, United States of America, 6 Department of Urology, Roswell Park Cancer Institute, Buffalo, NY, United States of America, 7 Lineberger Comprehensive Cancer Center, University of North Carolina at Chapel Hill, Chapel Hill, North Carolina, United States of America, 8 Epidemiology Program, LSUHSC School of Public Health, New Orleans, Louisiana, United States of America
Abstract
Low unit response rates can increase bias and compromise study validity. Response rates have continued to fall over the past decade despite all efforts to increase participation. Many factors have been linked to reduced response, yet relatively few studies have employed multivariate approaches to identify characteristics that differentiate respondents from nonre-spondents since it is hard to collect information on the latter. We aimed to assess factors contributing to enrollment of prostate cancer (PCa) patients. We combined data from the North Carolina-Louisiana (LA) PCa Project’s LA cohort, with additional sources such as US census tract and LA tumor registry data. We included specific analyses focusing on blacks, a group often identified as hard to enroll in health-related research. The ability to study the effect of Hurricane Katrina, which occurred amidst enrollment, as a potential determinant of nonresponse makes our study unique. Older age (70) for blacks (OR 0.65) and study phase with respect to Hurricane Katrina for both races (OR 0.59 for blacks, OR 0.48 for whites) were significant predictors of participation with lower odds. Neighborhood poverty for whites (OR 1.53) also was a significant predictor of participation, but with higher odds. Among blacks, residence in Orleans parish was associated with lower odds of participation (OR 0.33) before Katrina. The opposite occurred in whites, with lower odds (OR 0.43) after Katrina. Our results overall underscore the importance of tailoring enrollment approaches to specific target population characteristics to confront the challenges posed by nonresponse. Our results also show that recruitment-related factors may change when outside forces bring major alterations to a population’s environment and demographics.
a11111
OPEN ACCESS
Citation: Oral E, Simonsen N, Brennan C, Berken J,
Su LJ, Mohler JL, et al. (2016) Unit Nonresponse in a Population-Based Study of Prostate Cancer. PLoS ONE 11(12): e0168364. doi:10.1371/journal. pone.0168364
Editor: Mohammad Saleem, University of
Minnesota Hormel Institute, UNITED STATES
Received: August 13, 2016
Accepted: November 30, 2016
Published: December 16, 2016
Copyright:©2016 Oral et al. This is an open access article distributed under the terms of the
Creative Commons Attribution License, which permits unrestricted use, distribution, and reproduction in any medium, provided the original author and source are credited.
Data Availability Statement: In order to protect
the privacy of PCaP participants, individual-level PCaP data is made available to interested researchers via the study’s website at
http://ncla-pcap.org/For_Researchers.phpor by contacting
PCaP University of North Carolina at Chapel Hill Director, Jeannette Bensen, [email protected]. edu.
Funding: The North Carolina-Louisiana Prostate
Introduction
Nonresponse is an important source of nonsampling error and can appear at either unit or item level. This study focuses on unit nonresponse, which occurs when a sampled subject fails to participate in a questionnaire because of failure to establish a contact, or refusal to cooper-ate. Despite all efforts to minimize nonresponse, most population-based epidemiologic research suffers from significant nonresponse rates, which typically fall between 20 and 40% of the target population [1]. These rates have been observed to increase worldwide for several decades, regardless of the disease studied, geographical region or age of the study population ([2], [3], [4], [5], [6], [7], [8], [9], [10], [11], [12], [13]). Consequently, low response rates con-tinue to be a major obstacle for researchers, especially in health-related studies where data are often collected via questionnaires ([14], [15]).
Nonresponse poses two main problems: attainment of adequate sample sizes from a given number of target subjects so that the derived results are representative, and an increase in the potential for selection bias resulting from an over or under-representation of particular sub-populations [16]. Even with fairly high response rates, a substantial bias can occur if nonre-spondents differ markedly from renonre-spondents for rare exposures or rare outcomes [17].
Although nonresponse rates may be decreased by raising contact rates through increased field efforts, this strategy loses effectiveness in studies where contact rates already approach 100 percent. Other strategies can be utilized to minimize nonresponse, such as using more experienced interviewers, mailing advance letters to notify sampled subjects about the study prior to contact, or providing monetary incentives ([18], [19], [20], [21]). However, if these strategies are more effective for some particular subpopulations compared to others, a reduc-tion in nonresponse through these strategies can actually increase nonresponse bias.
Statistical techniques are also available to reduce the bias from nonresponse, such as applying appropriate weighting procedures, but these methods require some strong prior assumptions and knowledge about the population distribution. Post-survey adjustments are thus merely estimated remedies to the real underlying problem. The most direct and effective way to minimize this potential bias is to reduce nonresponse through appropriate measures built into study designs.
Evaluation of factors that affect participation is thus important, but often difficult to assess due to missing information on nonrespondents. Even in studies where some information is available on nonrespondents, the results regarding potential contributors to non-participation vary widely. For example, lack of personal benefits from participation has been given as a major cause for refusals [22]. A negative attitude towards the health care system also has been cited as a cause of nonresponse [23]. Mistrust of research, especially in some ethnic minorities, has been shown to be another potential cause ([24], [25], [26]), which is particularly relevant for studies (such as ours) designed to compare blacks vs whites. Several studies have pointed to poor current health as the major cause of refusals ([5], [27], [28], [29]). Lack of time or interest also have been reported as key reasons for non-participation ([30], [31], [32]). Age, gender, and race have been linked to refusals as well, although results are not entirely consistent ([6], [33], [34]). Lower education levels and unemployment were other factors associated with lower participation rates ([35], [36], [37], [38], [39], [40], [41], [42]). Some studies reported that individuals with a socially undesirable condition, such as a sexually transmitted disease, may be less likely to participate in studies related to that ailment ([6], [43]). Lack of participa-tion also has been associated with being single ([41], [44], [45]) or a smoker ([46], [47], [48], [49]). Personality characteristics, mental health and psychological factors have been examined as predictors of nonresponse as well ([33], [49], [50], [51], [52], [53]).
Nonresponse has thus been the subject of extensive literature, but definitive consensus regarding the mechanisms causing it remains elusive. Moreover, specifically in cancer
in study design, data collection and analysis, decision to publish, or preparation of the manuscript.
Competing Interests: The authors have declared
epidemiology research, it is currently not well known how nonresponse affects the representa-tiveness of cancer patients [54]. Since there are not many studies that focus on nonresponse in cancer research, we attempted to identify modifiable factors that could contribute to decreased participation in prostate cancer (PCa) studies.
PCa is the most commonly diagnosed cancer among U.S. men. The mortality associated with PCa has decreased over the last decades due to earlier detection and improved treatments ([55], [56], [57]); however, PCa-related morbidity, which is more pronounced in blacks, has increased [55]. Consequently, research on PCa continues to be of crucial importance, and a major key to the success of this effort is obtaining the most accurate estimates from PCa patient surveys and studies. Understanding the factors that influence PCa survivors to enroll in research studies will enable researchers to tailor their recruitment efforts accordingly, and reduce the potential impact of nonresponse on study results. Therefore, we sought to assess factors affecting participation among contacted eligible men with PCa in a population-based study. We included specific analyses focused on blacks, a group often identified as among the hardest to enroll in health-related research. Since Hurricane Katrina happened in the midst of the recruitment process, we had the opportunity to include the occurrence of a major disaster among other potential determinants of participation, which makes our study unique.
Study Design and Population
The North Carolina (NC)–Louisiana (LA) Prostate Cancer Project (PCaP) is a multidisciplin-ary, population-based, case-only study designed to address racial differences in PCa survival through a complete evaluation of social, individual, and tumor level influences on PCa aggres-siveness. Eligible research subjects were defined as those residing in the NC and LA study areas with a first diagnosis of adenocarcinoma of the prostate confirmed histologically. Par-ticipants were required to be 40–79 years of age at diagnosis, be able to complete the study interview in English, live outside an institution, not be cognitively impaired or in a severely debilitated state physically, and not be under the influence of alcohol, severely medicated, or apparently psychotic at the time of the interview [58]. The PCaP-LA study arm began enroll-ment in September 2004 in thirteen parishes surrounding New Orleans. Hurricane Katrina forced suspension of accrual in August 2005. This portion of PCaP-LA is referred to as the pre-Katrina (pre-K) sample. Accrual resumed in September 2006 in an extended area that included eight additional parishes in southern LA to account for changes in regional demo-graphics and dispersal of potential research subjects following the hurricane. Post-Katrina (post-K) enrollment was completed in August 2009. All PCaP-LA research subjects were iden-tified through a rapid case ascertainment process utilizing LA Tumor Registry (LTR) contacts. Computer generated random sampling algorithms were applied in order to under-sample white PCa patients to the degree necessary to achieve a 50:50 distribution of race within both NC and LA samples. Further details about the PCaP study can be found in Schroeder et al. [58]; for demographic and socioeconomic characteristics of the LA cohort, see Brennan et al. [55].
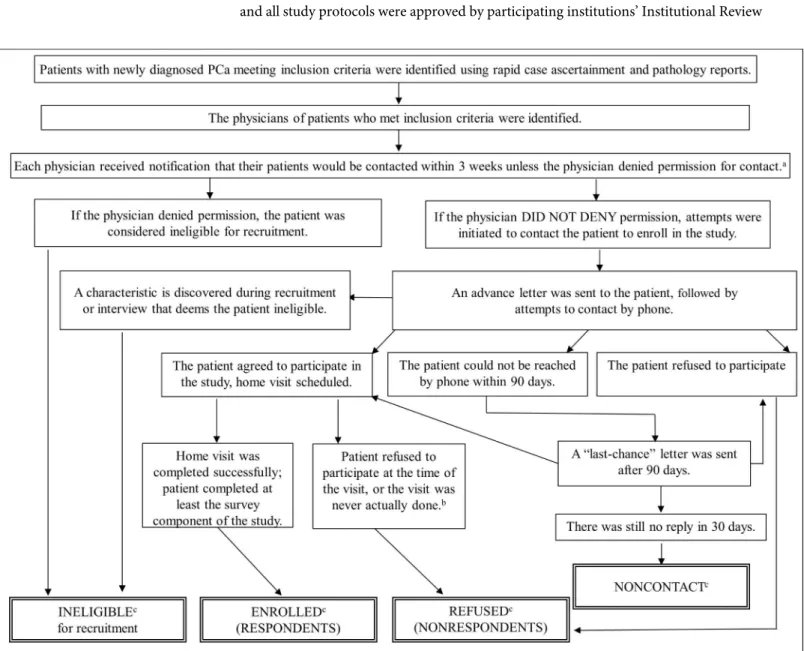
progress with enrollment. Patients that appeared to be eligible and were approved for contact by their physicians received an advance letter and a brochure followed by a phone call regard-ing the study. Compensation of $75 for time and effort was offered in the advance letter for participation in the three components of the study (interview, blood and fat specimen). Enrolled PCaP research subjects, here termed respondents, underwent extensive in-person interviews as well as provided tissue samples and medical record information in an in-home visit: a 749-question structured survey and biospecimens were administered and collected by well-trained registered nurses; proxy interviews were not allowed. The recruitment process of the PCaP-LA cohort was given inFig 1, where we defined ineligible, uncontacted, enrolled and refused research subjects for this study.
Informed consent was obtained from all PCaP study research subjects prior to participation and all study protocols were approved by participating institutions’ Institutional Review
Fig 1. Flow diagram for the recruitment process of the PCaP study, LA cohort.aDiagnosing physicians provided consent to contact 98% of AA and 96% of CA potential subjects in pre-K and 97% of AA and 96% of CA in post-K.bThe reasons included: i) They changed their mind about enrollment after a visit
was scheduled; ii) The scheduled interview ended up being cancelled.cThe total number of ineligible, enrolled, refused and uncontacted cases were 273,
1234, 754 and 27, respectively.
Boards. The current study that included an analysis of a sub-set of PCaP research subjects was also approved by the Louisiana State Health Sciences University-New Orleans Institutional Review Board (IRB #7971). It was exempted from additional consent requirements as minimal risk research utilizing secondary data.
Data Sources
In order to be able to compare respondents with nonrespondents, we required the use of sev-eral detailed supplementary data sources, such as an “eligibility summary form” which was completed by recruiters during the initial phone contact to confirm eligibility and solicit par-ticipation. Some of the key components of this form were:
• Race of the patient (asked regardless of eligibility or enrollment status)
• Eligibility status
• If found to be ineligible, the reason for ineligibility
• If found to be eligible, the scheduled date and time of the visit (This item provided informa-tion on nonrespondents from the PCaP-LA cohort.)
• If found to be eligible but refused to enroll in the study, the reason for declining enrollment
These forms were scanned for each patient and the outcomes were integrated into our anal-yses. This data source, however, lacked information on race for some patients who could not be contacted or declined to provide it. Detailed clinical and demographic information, like income, were unavailable for uncontacted patients and nonrespondents. Thus, we linked iden-tified patients with LTR data collected through 2011 to obtain missing race and tumor stage; we also used geocoded addresses to determine the census tract in which the patient was resid-ing at the time of diagnosis. Finally, we obtained the percentage livresid-ing in poverty and popula-tion density (persons per square mile) from the 2000 U.S. census for each patient’s tract of residence. Our efforts in combining these data sources enabled us to have a greater level of information than is available on nonrespondents in most epidemiologic studies.
Statistical Analyses and Results
In this study, respondents were defined as eligible patients who completed the home visit, and nonrespondents were defined as eligible patients who either directly refused to participate in the study or for whom a home visit was never arranged despite contact; seeFig 1. We chose to focus on recruitment of “contacted” eligible PCa patients largely for practical reasons, such as availability of more detailed information on them. A total of 273 men who appeared to be eligi-ble based on initially availaeligi-ble information did not qualify for recruitment. Of these, 86 were never contacted because their physicians denied permission to do so. The remaining 187 men entered the recruitment process but proved to be ineligible for various reasons (Table 1).
The most common reason for ineligibility was race, followed by being cognitively impaired. The same two reasons also were among the most common reasons for ineligibility when the sample was stratified by study phase.
previously published PCaP manuscripts/reports are due to differences in the definitions of eli-gibles, respondents, nonrespondents and noncontacts used specifically in this study.
The reasons given for refusal among those who were contacted were summarized in Table 2. A large majority (78.1%) simply stated that they were not interested in the study. Being too busy was cited by 13.3%, followed by being too ill at 2.9%. Whites were more likely to refuse on the grounds of being too ill compared to blacks (p = 0.001), while refusing due to “not being interested” occurred more often among blacks (p = 0.016).
Selected characteristics of the respondents, nonrespondents and the total eligible popula-tion along with nonresponse bias estimates were presented inTable 3. Categorical variables were created for some of the continuous covariates. Age was included in the analyses as three categories. We evaluated two tumor characteristics: Gleason sums were dichotomized as high (8) vs. low (<8). Surveillance, Epidemiology, and End Results (SEER) tumor summary stages ranging from 1 (local) to 7 (distant) were also examined. Since summary stages above 2 (non-local cancers) occurred in only 4% of the research subjects, tumor stage was collapsed into two groups as higher (stage 2 or more) vs. lower (stage 1). Census tract poverty was cate-gorized as<5, 5–10, 10–20, and20 percent of the households within the tract living in pov-erty. Population density was used to create a dichotomous covariate for rural tracts (<1000 persons per square mile); another indicator was also created for urban tracts (>2500 persons
Table 1. Reasons for ineligibilitydof contacted patients in the PCaP-LA cohort, stratified by race and study phase. First rows indicate counts, second
rows indicate percentages (%).
Count Count
Reasons for ineligibility Count % %
% Blacks Whites Pre-K Post-K
Age 1 0 1 1 0
0.53 0.00 100.0 100.0 0.00
Racee 48 4 44 14 34
25.67 8.33 91.67 29.17 70.83
Location of residence 23 14 9 6 17
12.30 60.87 39.13 26.09 73.91
Cognitively impaired 39 22 17 4 35
20.86 56.41 43.59 10.26 89.74
Non-English speaking 14 4 10 1 13
7.49 28.57 71.43 7.14 92.86
Institutionalized 11 7 4 0 11
5.88 63.64 36.36 0.00 100.0
Disability/illness 23 13 10 0 23
12.30 56.52 43.48 0.00 100.0
Denied that they have PCa or PCa was not primary 14 11 3 4 10
7.49 78.57 21.43 28.57 71.43
Deceased by time of eligibility call 14 9 5 3 11
7.49 64.29 35.71 21.43 78.57
Total 187 84 103 33 154
100.0 44.92 55.08 17.65 82.35
d
The eligibility form included checkboxes for entry of a number of specific reasons for ineligibility, and a blank space to enter any other reason without their own checkboxes.
e
Four patients were classified as ineligible since data on race was missing from the eligibility form and their correct race could not be determined from other sources.
per square mile). Residence at diagnosis was categorized into three groups: Orleans (the most populous parish before Hurricane Katrina), East Baton Rouge parish, or elsewhere.
Older cases were over-represented among nonrespondents (p = 0.026). Blacks comprised 54% of the eligible population, but 58% of those did not enroll. While most of the eligible pop-ulation was identified during the post-K phase of the study (85%), the percentage of the popu-lation who responded post-K was significantly lower (83%, p<0.0001). The tumor stage, Gleason score, percentage of census tract households in poverty, population density, and par-ish of residence showed no significant association with enrollment status. Nonresponse bias values were calculated for these characteristics from formulas given in Groves and Couper ([60]) assuming a fixed response model (Table 3). A positive bias indicates that the characteris-tic proportion is higher among respondents than nonrespondents, in which case the respon-dent proportion overestimates the population proportion. A negative bias indicates that the respondent proportion underestimates the population proportion. Overall, the sizes of the biases were small; the highest nonresponse bias was observed for the proportion estimator of race (2.69%).
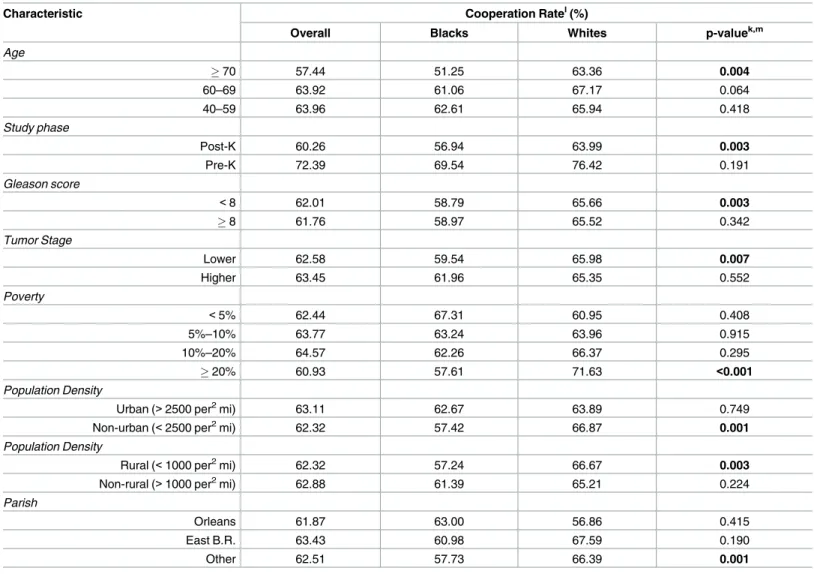
We calculated overall and race-specific cooperation rates for each characteristic (Table 4); see AAPOR [59] for mathematical formulas. While the oldest age group had the lowest cooper-ation rate in both races, coopercooper-ation was significantly lower for blacks than for whites in that group (51 vs. 63%, p = 0.004). Cooperation decreased substantially post-K for both races, but remained significantly less among blacks than whites (57 vs. 64%, p = 0.003). Cooperation
Table 2. Reasons cited for refusal among eligible research subjects contacted in the PCaP-LA cohort, stratified by race. First rows indicate counts,
second rows indicate percentages (%).
Count
Reasons for refusal Count % p-valuef
% Blacks Whites
Not interested 589 356 233
78.12 81.28 73.73 0.016
Too busy 100 51 49
13.26 11.64 15.51 0.129
Too sick 22 5 17
2.92 1.14 5.38 0.001
Concern over privacy 20 10 10
2.65 2.28 3.16 0.496
Advised not to participate 4 4 0
0.53 0.91 0.00 0.144
Tissue sample 3 2 1
0.4 0.46 0.32 1.000
Does not do studies 3 3 0
0.4 0.68 0.00 0.269
Other reasons 5 4 1
0.66 0.91 0.32 0.406
No reason given 8 3 5
1.06 0.68 1.58 0.290
Total 754 438 316
100.0 100.0 100.0
f
values were obtained from Fisher’s exact tests separately for each reason to investigate possible differences among the reasons by race. Significant p-values at Type I error = 0.05 are given in bold.
rates among PCa patients with low Gleason scores were significantly lower in blacks than whites (59 vs. 66%, p = 0.003). Similarly, cooperation rates among men with lower tumor stage were lower in blacks than whites (60 vs. 66%, p = 0.007). The overall cooperation rate was low-est when the percent of households in poverty exceeded 20%; however, opposite patterns emerged between races. Blacks in higher poverty tracts (58 vs. 72%, p<0.001), in rural resi-dences (57 vs. 67%, p = 0.003) and in non-urban tracts cooperated less than their white coun-terparts (57 vs. 67%, p = 0.001). Cooperation rates peaked in Orleans parish for blacks whereas it was lowest there for whites.
Table 3. Comparison of percentages of respondents, nonrespondents, and the total contacted sample by specific characteristics.
Characteristic Respondents Nonrespondents Eligiblesg Nonresponse Bias (%) p-valueh,k
Age
70 26.6 32.2 28.7 -2.12 0.026
60–69 44.1 40.7 42.8 1.25
40–59 29.3 27.1 28.5 0.87
Race
Blacks 51.0 58.1 53.7 -2.69 0.002
Whites 49.0 41.9 46.3 2.69
Study Phase
Post-K 82.6 89.1 85.1 -2.46 <0.0001
Pre-K 17.4 10.9 14.9 2.47
Gleason Score
<8 89.7 89.6 89.7 0.04 0.940
8 10.3 10.4 10.3 -0.04
Tumor Stagei
Lower 84.9 85.4 85.1 -0.19 0.777
Higher 15.1 14.6 14.9 0.18
Povertyj
<5% 10.2 9.9 10.1 0.11 0.421
5% -10% 19.1 17.4 18.5 0.64
10%–20% 33.1 31.4 32.5 0.64
20% 37.6 41.3 39.0 -1.40
Population Densityj
Urban (>2500 per2mi) 35.6 34.8 35.3 0.30 0.730
Non-urban (<2500 per2mi) 64.5 65.2 64.7 -0.27
Population Density
Rural (<1000 per2mi) 49.27 49.86 49.5 -0.22 0.799
Non-rural (>1000 per2mi) 50.73 50.14 50.5 0.22
Parish
Orleans 13.9 14.4 14.1 -0.19 0.918
East Baton Rouge 20.1 19.5 19.9 0.23
Other 66.0 66.1 66.0 -0.04
g
Total eligibles.
h
Pearson chi-square tests (for 2xC tables) were obtained to assess associations between characteristics and participation.
i
Tumor stage was missing for 2% of the eligible, 1% of the enrolled and 4% of the refused population.
j
Tract-based measures (poverty, urban density) were missing for 1% of the eligible, 0.2% of the enrolled, and 2.3% of the refused population. Missing values were neither included in the tabulated percentages nor used in the tests for differences.
k
Significant p-values were given in bold (p<0.05, p<0.01 or p<0.001).
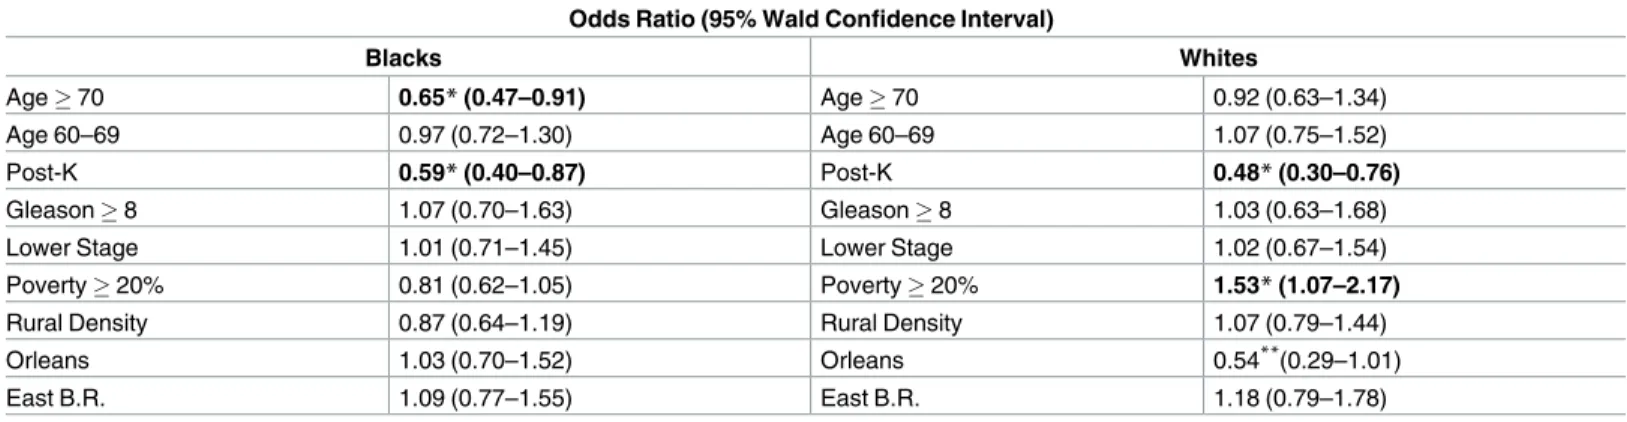
Multivariate logistic regression modelling was used to assess the factors affecting participa-tion status. Race-stratified models determined if there were differences between blacks and whites (Table 5). Membership in the oldest age group and recruitment in the post-K phase were the two statistically significant predictors for blacks with ORs of 0.65 and 0.59, respec-tively. Membership in the oldest age group had a nonsignificant association with participation for whites. Living in a tract with over 20% of the population in poverty reached statistical sig-nificance as a predictor for whites who were 1.5 times as likely to enroll in the study. Post-K enrollment was another factor that reached statistical significance for white men (OR 0.48). Models substituting residence in an urban tract for residence in a rural one yielded similar results for most variables (not reported).
We also assessed the factors affecting participation status via models stratified by race and study phase (Table 6). Cooperation remained poorest among blacks who were 70 and older for post-K (OR 0.63). After stratification for study phase, neighborhood poverty became a nonsignificant factor for whites in both study phases as the post-K odds ratio decreased
Table 4. Cooperation rates: overall and stratified by race (%).
Characteristic Cooperation Ratel(%)
Overall Blacks Whites p-valuek,m
Age
70 57.44 51.25 63.36 0.004
60–69 63.92 61.06 67.17 0.064
40–59 63.96 62.61 65.94 0.418
Study phase
Post-K 60.26 56.94 63.99 0.003
Pre-K 72.39 69.54 76.42 0.191
Gleason score
<8 62.01 58.79 65.66 0.003
8 61.76 58.97 65.52 0.342
Tumor Stage
Lower 62.58 59.54 65.98 0.007
Higher 63.45 61.96 65.35 0.552
Poverty
<5% 62.44 67.31 60.95 0.408
5%–10% 63.77 63.24 63.96 0.915
10%–20% 64.57 62.26 66.37 0.295
20% 60.93 57.61 71.63 <0.001
Population Density
Urban (>2500 per2mi) 63.11 62.67 63.89 0.749
Non-urban (<2500 per2mi) 62.32 57.42 66.87 0.001
Population Density
Rural (<1000 per2mi) 62.32 57.24 66.67 0.003
Non-rural (>1000 per2mi) 62.88 61.39 65.21 0.224
Parish
Orleans 61.87 63.00 56.86 0.415
East B.R. 63.43 60.98 67.59 0.190
Other 62.51 57.73 66.39 0.001
kSignificant p-values were given in bold (p<0.05, p<0.01 or p<0.001). lSee AAPOR (2011) for mathematical formulas.
mp-values were obtained from two-sample tests for binomial proportions.
compared to the previous model. Gleason scores were not associated with participation in either study phase among blacks or whites. Before Katrina, while whites with lower stage tumors were less likely to enroll in PCaP than those with higher stage tumors (OR 0.51), blacks with lower stage PCa were more likely to participate (OR 1.94); however these odds ratios lacked statistical significance, reflecting the relative rarity of higher stage PCa and much smaller number of eligible research subjects during that period. After Katrina, the racial differ-ence in odds of participation for men with lower versus higher stage PCa diminished and both
Table 5. Odds ratios for participation according to specific characteristics in multiple logistic regression models, stratified by race. The 40–59
year age group was the referent category.
Odds Ratio (95% Wald Confidence Interval)
Blacks Whites
Age70 0.65*(0.47–0.91) Age70 0.92 (0.63–1.34)
Age 60–69 0.97 (0.72–1.30) Age 60–69 1.07 (0.75–1.52)
Post-K 0.59*(0.40–0.87) Post-K 0.48*(0.30–0.76)
Gleason8 1.07 (0.70–1.63) Gleason8 1.03 (0.63–1.68)
Lower Stage 1.01 (0.71–1.45) Lower Stage 1.02 (0.67–1.54)
Poverty20% 0.81 (0.62–1.05) Poverty20% 1.53*(1.07–2.17)
Rural Density 0.87 (0.64–1.19) Rural Density 1.07 (0.79–1.44)
Orleans 1.03 (0.70–1.52) Orleans 0.54**(0.29–1.01)
East B.R. 1.09 (0.77–1.55) East B.R. 1.18 (0.79–1.78)
*Indicates a significant result at Type I error = 0.05.
**p-value from Type 3 Analysis of Effects for whites in Orleans parish = 0.053.
doi:10.1371/journal.pone.0168364.t005
Table 6. Odds ratios for participation according to specific characteristics in multiple logistic regression models, stratified by race and study phase. The 40–59 year age group was the referent category for age in all models.
Odds Ratio (95% Wald Confidence Interval)
Blacks Whites
Age70 0.74 (0.30, 1.79) Age70 1.19 (0.34, 4.17)
Age 60–69 0.93 (0.41, 2.08) Age 60–69 1.02 (0.32, 3.23)
Gleason8 0.99 (0.38, 2.59) Gleason8 1.13 (0.28, 4.60)
Pre-Katrina Lower Stage 1.94 (0.78, 4.78) Lower Stage 0.51 (0.10, 2.55)
Poverty>20% 1.29 (0.63, 2.65) Poverty>20% 1.42 (0.49, 4.09)
Rural Density 0.46 (0.15, 1.36) Rural Density 1.39 (0.52, 3.71)
Orleans 0.33*(0.12, 0.96) Orleans 1.21 (0.30, 4.87)
East B.R. -** East B.R.
-Odds Ratio (95% Wald Confidence Interval)
Blacks Whites
Age70 0.63*(0.44, 0.90) Age70 0.88 (0.59, 1.32)
Age 60–69 0.97 (0.71, 1.35) Age 60–69 1.08 (0.75, 1.56)
Gleason8 1.12 (0.70, 1.81) Gleason8 1.04 (0.61, 1.76)
Post-Katrina Lower Stage 0.94 (0.63, 1.39 Lower Stage 1.10 (0.71, 1.70)
Poverty>20% 0.80 (0.60, 1.05) Poverty>20% 1.11 (0.76, 1.62)
Rural Density 0.91 (0.66, 1.26) Rural Density 1.02 (0.74, 1.41)
Orleans 1.26 (0.81, 1.95) Orleans 0.43*(0.21, 0.90)
East B.R. 1.17 (0.83, 1.67) East B.R. 1.15 (0.76, 1.74)
*Indicates a significant result at Type I error = 0.05.
**No results were available for East B.R. since it was not included prior to expansion of the study catchment area after Hurricane Katrina.
ORs approached 1 (0.94 for blacks vs. 1.10 for whites). Residence in Orleans parish showed a statistically significant negative association with cooperation pre-K among blacks and post-K among whites, and non-significant positive associations otherwise.
Discussion
The results showed that older age for blacks (70 years), neighborhood poverty for whites, and study phase with respect to Hurricane Katrina for both races were significant predictors of nonresponse among eligible PCaP-LA research subjects. Neighborhood poverty was not a sig-nificant factor in the participation of black PCa patients overall. One potential explanation is that whites in low-income areas found the participant compensation for time and effort more attractive than blacks. Another reason might be greater mistrust of research among blacks in those areas ([61], [62], [63]). When stratified by study phase, however, both races had positive but nonsignificant associations between neighborhood poverty and participation pre-K, which substantially weakened (even becoming negative for blacks) post-K. The change after Katrina could be the result of patients’ preoccupation with recovery activities which reduced their will-ingness to devote time to the study. Orleans parish, which is composed of the city of New Orle-ans, was the most populous parish in the state and home to a large black community before Katrina. The heavy damage inflicted by the hurricane caused displacement and migration of a large part of the population, particularly lower socioeconomic status (SES) blacks ([64], [65], [66]). Orleans parish thus provided an ideal area to examine how recruitment-related factors may change when outside forces bring major alterations in a population’s environment and demographics. One of the most notable changes was the significantly lower odds of partici-pation among blacks living in Orleans parish (OR 0.33) pre-K, which rose above one (but non-significant) post-K. The opposite occurred for whites; those residing in Orleans had (non-significantly) higher odds of participation before the hurricane, which became significantly lower after that (OR 0.43). One potential contributor may be the disproportionate displace-ment of lower SES blacks, who tended to live in the areas of New Orleans that were impacted most heavily by Katrina, and who were less likely to return ([65], [66], [67], [68]). This may have shifted demographics in a direction more favorable to black participation after Katrina [67]. On the other hand, whites were more likely to return to repair or rebuild their damaged homes after the hurricane, and on average they returned sooner ([65], [66], [67]). However, changes in their priorities may have reduced the perceived utility of participation and decreased their likelihood of joining the study. Univariate logistic regression analyses, although not shown, indicated that blacks were less likely to participate in PCaP overall compared to whites (OR 0.75, 0.63–0.90), which is consistent with some previous research ([27], [34]).
consists entirely of research subjects with the same disease; in a case-control study, factors affecting nonresponse may differ for controls. PCa is most common in older men, many of whom have multiple comorbidities. We examined tumor grade and stage as a marker of more aggressive or extensive cancer, but lack of data precluded addressing overall health or comor-bidities as potential factors. Finally, while the study population’s balanced racial mix provided greater power for racial comparisons, sample size limits were a problem for some analyses regarding pre- and post-K comparisons.
This study contributes to the understanding of factors affecting nonresponse in PCa studies despite its limitations. For example, we observed that high neighborhood poverty in an area increased the likelihood of cooperation by whites, but it did not alter blacks’ participation overall. Thus, researchers might try tactics other than increasing monetary incentives to boost participation of black men in PCa studies, such as utilizing refusal conversation strategies ([69], [70], [71]) tailored specifically to black men. Offering participants free medications or free treatment as an alternative to the monetary incentives, where feasible, can increase partici-pation of black PCa survivors ([61]). Alternatively, incentives that may appeal to participants’ family members might be offered as an option. Recruiters may try to explain in detail how the study could specifically benefit the black community. Researchers might also consider employ-ing black community members in recruitemploy-ing black research subjects. Likewise, priority should be given to the strategies that will increase participation of specifically elderly black men in PCa studies. Mixed survey modes are known to increase response rates in the right contexts ([72], [73], [74], [75], [76]); thus, for example in a PCa study where research subjects are being surveyed via computer-assisted telephone interviewing (CATI), older black men could be pro-vided the option of being surveyed via computer-assisted personal interviewing (CAPI) [72]. CAPI generally provides a higher response rate than CATI because of the face-to-face interac-tion between the interviewer and the respondent. Face-to-face interviews have a greater risk of bringing in social desirability bias, but this problem can be mitigated by exploiting computer-assisted self-interviewing (CASI) when asking sensitive questions (i.e. CAPI-CASI mix) [75]. Mode equivalence can be maximized in mixed-mode survey designs through attention to instrument design and careful implementation of survey protocol ([75], [76], [77]).
Our findings also provide insight to researchers about potential effects if unpredictable events bring major changes to their study population’s environment and demographics in the middle of a recruitment process. It is crucial for study managers to monitor the survey process in real time and implement changes as needed to optimize response rates. Furthermore, we believe research on nonresponse must be conducted specific to the disease under study for the reason that every disease-specific population is unique. One cannot, for example, simply assume the factors that determine participation in a pancreatic cancer study would be identical in a PCa study. Finally, one approach with a specific group in a specific study may not work with a similar group under different circumstances. For example, researchers might consider offering jazz concert tickets for the relatives of elderly black PCa survivors as an alternative to monetary incentives in Louisiana, while researchers in other states might need to consider other alternative incentives that would be attractive to black communities in their study area.
Further research is needed to confirm this study’s findings. More detail on nonparticipant characteristics for studies of prostate as well as other cancers are critically needed to tailor enrollment approaches and minimize the challenges posed by nonresponse.
Acknowledgments
Author Contributions
Conceptualization: EO NS CB JB EF.
Formal analysis: EO NS JB.
Methodology: EO NS JB CB EF.
Software: EO NS JB.
Validation: EO NS JB CB EF.
Visualization: EO NS CB JB LJS JLM JTB EF.
Writing – original draft: EO NS.
Writing – review & editing: EO NS CB JB LJS JLM JTB EF.
References
1. Stang A. Nonresponse research-an underdeveloped field in epidemiology. Eur J. Epidemiol. 2003; 18: 929–931. PMID:14598921
2. Bakke PS. Nonresponse in epidemiological studies–How to cope with it? Resp Med. 2010; 104: 323– 324.
3. Brick JM, Williams D. Explaining rising nonresponse rates in cross-sectional surveys. Ann Am Acad Polit SS. 2013; 645: 36–59.
4. Curtin R, Presser S, Singer E. Changes in telephone survey nonresponse over the past quarter century. Public Opin Quart. 2005; 69(1): 87–98.
5. Drivsholm T, Eplov LF, Davidsen M, Jorgensen T, Ibsen H, Hollnagel H et al. Representativeness in population-based studies: A detailed description of nonresponse in a Danish cohort study. Scand J Pub-lic Health. 2006; 34: 623–631. doi:10.1080/14034940600607616PMID:17132596
6. Galea S, Tracy M. Participation rates in epidemiologic studies. Ann Epidemiol. 2007; 17: 643–653. doi: 10.1016/j.annepidem.2007.03.013PMID:17553702
7. Hartge P. Participation in population studies. Epidemiology. 2006; 17(3): 252–254. doi:10.1097/01. ede.0000209441.24307.92PMID:16617271
8. Heraty S, Kent P, O’Mahony E. Smoking behaviours, attitudes and exposure to smoking cessation information in a psychiatric setting; a cross-sectional comparative investigation, 13th Annual Research Conf. 2012; 36.
9. Johnson T, Owens L. Survey Response Rate Reporting in the Professional Literature, Paper presented at the 58th Annual Meeting of the American Association for Public Opinion Research, Nashville, TN; 2003.
10. Mazloum M, Bailey HD, Heiden T, Armstrong BK, De Klerk N, Milne E. Participation in population-based case-control studies: does the observed decline vary by socioeconomic status? Paediatr Perinat EP. 2012; 26: 276–279.
11. Morton L, Cahill J, Harge P. Reporting participation in epidemiologic studies: a survey of practice. Am J Epidemiol. 2005; 163(3): 197–203. doi:10.1093/aje/kwj036PMID:16339049
12. Slattery ML, Edwards SL, Caan BJ, Kerber RA, Potter JD. Response rates among control subjects in case-control studies. Ann Epidemiol. 1995; 5: 245–249. SSDI 1047-2797(94)00113-8. PMID:7606315
13. Tolonen H, Helakorpi S, Talala K, Helasoja V, Martelin T, Prattala R. 25-year trends and socio-demo-graphic differences in response rates: Finnish adult health behaviour survey. Eur J Epidemiol. 2006; 21 (6): 409–415. doi:10.1007/s10654-006-9019-8PMID:16804763
14. Hall AE, Sanson-Fisher RW, Lynagh MC, Threlfall T, D’Este CA. Format and readability of an enhanced invitation letter did not affect participant rates in a cancer registry-based study: a randomized controlled trial. J. Clin Epidemiol. 2013; 66: 85–94. doi:10.1016/j.jclinepi.2012.07.016PMID:23102853
15. May L, Gudger G, Armstrong P, Brooks G, Hinds P, Bhat R et al. Multisite Exploration of Clinical Deci-sion Making for Antibiotic Use by Emergency Medicine Providers Using Quantitative and Qualitative Methods, Infect Control Hosp Epidemiol. 2014; (35: ) 9, 1114–1125.
17. Kessler R, Little R, Groves RM. Advances in strategies for minimizing and adjusting for survey nonre-sponse. Epidemiol Rev. 1995; 17(1): 192–204. PMID:8521937
18. DeLeeuw E, Callegaro M, Hox J, Korendijk E, Lensvelt-Mulders G. The Influence of Advanced Letters on Response in Telephone Surveys: A Meta-Analysis, Public Opin Quart. 2007; 71 (3), 413–443.
19. Link M, Mokdad A, Town M, Weiner J, Roe D. Improving Response Rates for the BRFSS: Use of Lead Letters and Answering Machine Messages. American Assoc for Public Opinion Research. 2003; 141– 148.
20. Singer E, Groves RM, Dillman DA, Eltinger JL, Little RJA, eds. The use of incentives to reduce nonre-sponse in household surveys. Wiley-Interscience; 2002; 163–177.
21. Sinibaldi J, Jackle A, Tipping S, Lynn P. Interviewer characteristics, their doorstep behaviour, and sur-vey co-operation. AAPOR, May 14–17, 2009; 5955–5969.
22. Bakke P, Gulsvik A, Lilleng P, Overa O, Hanoa R, Eide GE. Postal Survey on airborne occupational exposure and respiratory disorders in Norway: Causes and consequences of nonresponse. J. Epide-miol. Community Health 1990; 44(4): 316–320.http://www.jstor.org/stable/25567105. PMID:2277255
23. Tibblin G. A population study of 50-year old men. An analysis of the non-participation group. Acta Med Scand. 1965; 178: 453–459. PMID:5838318
24. Ford J, Howerton MW, Lai GY, Gary TL, Bolen S, Gibbons MC et al. Barriers to recruiting underrepre-sented populations to cancer clinical trials: a systematic review. Cancer. 2008; 112:228–242. doi:10. 1002/cncr.23157PMID:18008363
25. Smith G, Thomas S, Williams M, Moody-Ayers S. Attitudes and beliefs of African Americans toward par-ticipation in medical research. J Gen Intern Med. 1999; 14(9): 537–546. doi:10.1046/j.1525-1497. 1999.07048.xPMID:10491242
26. Symonds RP, Lord K, Mitchell AJ. Recruitment of ethnic minorities into cancer clinical trials: experience from the front lines. Br J Cancer. 2012; 107(7): 1017–1021. doi:10.1038/bjc.2012.240PMID: 23011540
27. Jackson R, Chambless LE, Yang K, Byrne T, Watson R, Folsom A et al. Differences between respon-dents and nonresponrespon-dents in a multicenter community-based study vary by gender and ethnicity. J. Clin. Epidemiol. 1996; 49(12): 1441–1446. SSDI 0895-4356(95)00047-8. PMID:8970495
28. Sogaard AJ, Selmer R, Bjertness E, Thelle D. The Oslo health study: The impact of self-selection in a large, population-based survey. Int J Equity Health. 2004; 3:3.http://www.equityhealthj.com/content/3/ 1/3doi:10.1186/1475-9276-3-3PMID:15128460
29. Wilhelmsen L, Ljungbert S, Wedel H, Werko L. A comparison between participants and non-participants in a primary preventive trial. J Chron Dis. 1976; 29(5): 331–339. PMID:939796
30. Couper M. Survey introductions and data quality. Public Opin Quart. 1997; 61(2):317–338.
31. Hussain A, Weisaeth L, Heir T. Nonresponse to a population-based postal questionnaire study. J Trauma Stress. 2009; 22(4):324–328. doi:10.1002/jts.20431PMID:19644976
32. Ro¨nmark E, Lundqvist A, Lundback B, Nystrom L. Non-responders to a postal questionnaire on respira-tory symptoms and diseases. Eur J. Epidemiol. 1999; 15(3): 293–299.http://www.jstor.org/stable/ 3582304. PMID:10395061
33. Camara RJA, Begre S, Von Kanel R. Avoidance and inhibition do not predict nonrespondent bias among patients with inflammatory bowel disease. J Epidemiol. 2011; 21(1): 44–51. doi:10.2188/jea. JE20100087PMID:21088371
34. Moorman PG, Newman B, Millikan RC, Tse CK, Sandler DP. Participation rates in a case-control study: The impact of age, race, and race of interviewer. Ann Epidemiol. 1999; (9: )188–195. PII S1047-2797 (98)00057-X.
35. Burg JA, Allred SL, Sapp JH. The potential for bias due to attrition in the National Exposure Registry: an examination of reasons for nonresponse, nonrespondent characteristics, and the response rate. Toxicol Ind Health, 1997; 13(1):1–13. PMID:9098946
36. Cunradi CB, Moore R, Killoran M, Ames G. Survey nonresponse bias among young adults: the role of alcohol, tobacco, and drugs. Subst Use Misuse. 2005; 40:171–185. PMID:15770883
37. Eagan TM, Eide GE, Gulsvik A, Bakke PS. Nonresponse in a community cohort study: predictors and consequences for exposure-disease associations. J Clin Epidemiol. 2002; 55:775–781. PMID: 12384191
38. Hille ET, Elbertse L, Gravenhorst JB, Brand R, Verloove-Vanhorick SP. Dutch POPS-19 Collaborative Study Group. Nonresponse bias in a follow-up study of 19-year-old adolescents born as preterm infants. Pediatrics. 2005; 116:e662–e666. doi:10.1542/peds.2005-0682PMID:16263980
40. Partin MR, Malone M, Winnett M, Slater J, Bar-cohen A, Caplan L. The impact of survey nonresponse bias on conclusions drawn from a mammography intervention trial. J Clin Epidemiol. 2003; 56:867– 873. PMID:14505772
41. Richiardi L, Boffetta P, Merletti F. Analysis of nonresponse bias in a population-based case-control study on lung cancer. J Clin Epidemiol. 2002; 55:1033–1040. PMID:12464380
42. Shahar E, Folsom AR, Jackson R. The effect of nonresponse on prevalence estimates for a referent population: insights from a population-based cohort study. Atherosclerosis Risk in Communities (ARIC) Study Investigators. Ann Epidemiol. 1996; (6: )498–506. PMID:8978880
43. Lahaut VM, Jansen HA, Van de Mheen D, Garretsen HF. Non-response bias in a sample survey on alcohol consumption. Alcohol and Alcoholism. 2002; 37(3), 256–260. PMID:12003914
44. Fejer R, Harvigsen J, Kyvik KO, Jordan A, Christensen HW, Hoilund-Carlsen PF. The Funen neck and chest pain study: analyzing nonresponse bias by using national vital statistics data. Eur J Epidemiol. 2006; 21(3): 171–180. doi:10.1007/s10654-006-0006-xPMID:16547831
45. Reijneveld SA, Stronks K. The impact of response bias on estimates of health care utilization in a metro-politan area: the use of administrative data. Int J Epidemiol. 1999; (28: ) 1134–1140.
46. Aanerud M, Braut H, Wentzel-Larsen T, Eagan TML, Bakke PS. Nonresponse in telephone surveys of COPD patients does not introduce bias. J Telemed Telecare. 2013; Feb 28, 2013: 1–5.
47. Bostro¨m G, Hallqvist J, Haglund BJ, Romelsjo A, Svanstrom L, Diderichsen F. Socioeconomic differ-ences in smoking in an urban Swedish population. The bias introduced by non-participation in a mailed questionnaire. Scand J Soc Med. 1993; 21(2): 77–82. PMID:8367686
48. Hill A, Roberts J, Ewings P, Gunnell D. Nonresponse bias in a lifestyle survey. J Public Health Med. 1997; 19(2): 203–207. PMID:9243437
49. Vink JM, Willemsen G, Stubbe JH, Middeldorp CM, Ligthart RS, Baas KD et al. Estimating nonresponse bias in family studies: Application to mental health and lifestyle. Eur J Epidemiol. 2004; 19: 623–630. PMID:15461193
50. Bennet CM, Hill RE. A comparison of Selected personality characteristics of Responders and Nonre-sponders to a Mailed Questionnaire study. The J Educ Res. 1964; 58(4): 178–180.
51. Cope RG. Nonresponse in survey research as a function of psychological characteristics and time of response. J Exp Educ. 1968; (36: ) 3: 32–35.
52. Gersen JA, McCreary CP. Personality comparisons of responders and nonresponders to a mailed per-sonality inventory. Psychol Rep. 1983; 52: 555–562.
53. Jacomb PA, Jorm AF, Korten AE, Christensen H, Henderson AS. Predictors of refusal to participate: a longitudinal health survey of the elderly in Australia. BMC Public Health. 2002; 2(4).
54. Abel GA, Saunders CL, Lyratzopoulos G. Post-sampling mortality and non-response patterns in the English Cancer Patient Experience Survey: Implications for epidemiological studies based on surveys of cancer patients, Cancer Epidemiol. 2016; V41, 34–41.
55. Brennan C, Oral E, Fontham E, Mohler J, Bensen J, Mishel M et al. The differences in quality of life in prostate cancer project: methods and design of a multidisciplinary population-based follow-up study. American Medical Journal. 2012; 3(2): 104–114.
56. DeSantis CE, Lin CC, Mariotto AB, Siegel RL, Stein KD, Kramer JL et al. Cancer treatment and survi-vorship statistics. CA: A Cancer Journal for Clinicians. 2014; 64: 252–271.
57. Gomella L, Johannes J, Trabulsi E, Thaler H. Current Prostate Cancer treatments: Effects on Quality of Life. Urology. 2009; 73(s5):s28–s35.
58. Schroeder J, Bensen J, Su L, Mishel M, Ivanova A, Smith GJ et al. The North Carolina-Louisiana Pros-tate Cancer Project (PCaP): Methods and design of a multidisciplinary population-based cohort study of racial differences in prostate cancer outcomes. Prostate. 2006; (66: )1162–1176.
59. AAPOR, Standard definitions: Final dispositions of case codes and outcome rates for surveys. 7th ed. The American Association of Public Opinion Research; 2011.
60. Groves RM, Couper MP. Nonresponse in Household Interview Surveys, Wiley-Interscience; 1998.
61. Corbie-Smith G, Thomas SB, Williams MV, Moody-Ayers S. Attitudes and beliefs of African Americans toward participation in medical research. J Gen Intern Med. 1999; 14:537–546. doi: 10.1046/j.1525-1497.1999.07048.xPMID:10491242
62. Durant RW, Legedza AT, Marcantonio ER, Freeman MB, Landon BE. Different types of distrust in clini-cal research among Whites and African Americans. Journal of the National Mediclini-cal Association. 2011; 103:123–130. PMID:21443064
64. Falk WW, Hunt MO, Hunt LL. Hurricane Katrina and New Orleanians’ sense of place: Return and recon-stitution or ‘Gone with the Wind’? DuBois Review. 2006; 3, 115–128.
65. Elliott JR, Bellone-Hite A, Devine J. Unequal return: The uneven resettlements of New Orleans’s uptown neighborhoods. Organization & Environment. 2009; 22(4), 410–421.
66. Fussell E, Sastry N, VanLandingham M. Race, socio-economic status, and return migration to New Orleans after Hurricane Katrina. Population & Environment. 2010 31 (1–3): 20–42.
67. Fussell E. Constructing New Orleans, constructing race: A population history of New Orleans. Journal of American History. 2007; 94:846–855.
68. Logan JR. The impact of Katrina: Race and class in storm-damaged neighborhoods. Working paper, Spatial Structures in the Social Sciences, Brown University; 2006.
69. Calderwood L, Plewis I, Ketende SC, Taylor R. Experimental testing of refusal conversion strategies in a large-scale longitudinal study. Working Paper. 2010; Centre for Longitudinal Studies, Institute of Edu-cation, University of London.
70. Fricker SS. The Relationship between Response Propensity and Data Quality in the Current Population Survey and the American Time-use Survey. PhD Diss. University of Maryland; 2007.
71. Lynn P, Clarke P, Martin J, Sturgis P. The effects of extended interviewer efforts on nonresponse bias. In Survey Nonresponse, eds. Groves R.M., Dillman D.A., Eltinge J.L and Little R. J. A., New York: Wiley; 2002.
72. Bethlehem J, Cobben F, Schouten B. Handbook of Nonresponse in Household Surveys. Wiley, Hobo-ken, New Jersey; 2011.
73. Biemer PP, Lyberg LE. Introduction to Survey Quality. John Wiley and Sons, Hoboken, New Jersey; 2003.
74. Buelens BJ, Van den Brakel J. On the Necessity to Include Personal Interviewing in Mixed-Mode Sur-veys, Survey Practice 2010; 3 (5).
75. DeLeeuw E. To mix or not to mix data collection modes in surveys, Journal of Official Stat. 2005; 21 (2), 233–255.
76. Safir A, Goldenberg K. Mode effects in a survey of consumer expenditures. Proceedings of the Ameri-can Statistical Association, Section on Survey Research Methods, Alexandria, VA: AmeriAmeri-can Statistical Assoc. 2008; 4436–4443.