SPATIAL HETEROGENEITY OF PHYLOGENETICALLY DIVERSE ORANGE AND WHITE BEGGIATOA MATS IN GUAYMAS BASIN
HYDROTHERMAL SEDIMENTS
Luke Justin McKay
A thesis submitted to the faculty of the University of North Carolina at Chapel Hill in partial fulfillment of the requirements for the degree of
Master of Science in the Department of Marine Sciences.
Chapel Hill 2011
Approved by:
Dr. Andreas Teske
Dr. Barbara MacGregor
ABSTRACT
LUKE MCKAY: Spatial Heterogeneity of Phylogenetically Diverse Orange and White
Beggiatoa Mats in Guaymas Basin Hydrothermal Sediments (Under the direction of Dr. Andreas Teske)
Sulfide-oxidizing bacteria of the genus Beggiatoa form colorful mats on the seafloor
above active hydrothermal seeps at Guaymas Basin. 113 temperature profiles were taken
around 15 Beggiatoa mats to investigate spatial relationships between mat color and
hydrothermal seeps. Average in situ temperatures of phylogenetically diverse orange and
white filaments are 8-12°C, indicating that Guaymas Beggiatoa live in relatively cool conditions. Average temperatures 40 centimeters beneath all Beggiatoa mats are
approximately 90°C. Orange filaments are usually concentrated over hotter subsurface temperatures in the center of a mat than the major concentration of white filaments at the
periphery; however, the range of subsurface temperatures changes from one mat to
another. Elevated temperature profiles beneath orange Beggiatoa correlate with the
shallowest sulfide accumulation maxima. We propose that spatial heterogeneity of
orange and white filaments in a Guaymas Beggiatoa mat is controlled by delivery of, and
To The D:
Donald Trad Nogueira-Godsey, Marvin Lionel Leathers, Kyle Douglass Jones, Stephen Andrew Sansom, James Allison King, John Zachary Sullivan,
ACKNOWLEDGEMENTS
This study would not have been possible without extensive input and support
from Andreas Teske, Barbara MacGregor, Daniel Albert, Daniel Hoer, Howard
Mendlovitz, Jennifer Biddle, and Julius Lipp. I am very grateful for guidance and
suggestions given by my advisory committee: Carol Arnosti, Barbara MacGregor, and
Andreas Teske. I would like to thank the crews of the R/V Atlantis and HOV Alvin for
their outstanding efforts and constant ability to solve problems during the dives in
Guaymas Basin. I thank all shipboard scientists for their willingness to contribute ideas
and time to this investigation. Additionally, I am indebted to Andrea Anton, Patrick
Gibson, Brian White, and Hans Røy for helpful discussion. Figure 2 was constructed by
Julius Lipp with help from Barbara MacGregor and myself. This study was funded by
the National Science Foundation (Biological Oceanography 0647633) and I was funded
in part by the Graduate School Science and Technology Fellowship from UNC-Chapel
Hill. Lastly, I thank the Department of Marine Sciences and my advisor, Andreas Teske,
TABLE OF CONTENTS
LIST OF TABLES...vi
LIST OF FIGURES...vii
Chapter I. INTRODUCTION...1
II. SPATIAL HETEROGENEITY OF PHYLOGENETICALLY DIVERSE ORANGE AND WHITE BEGGIATOA MATS IN GUAYMAS BASIN HYDROTHERMAL SEDIMENTS...4
Sampling Procedures and Methodology...4
Results and Discussion...8
Conclusion...21
APPENDIX...22
LIST OF TABLES
Table
1. Guaymas Basin Beggiatoa mat
LIST OF FIGURES
Figure
1. 16S phylogenetic tree incorporating
six Guaymas Beggiatoa filaments...8
2. Three-dimensional reconstruction of
MegaMat temperature fields...10
3. Average surface and deep temperatures
grouped by mat color or presence...11
4. Individual surface temperatures from
orange and white mats...13
5. Temperature, sulfate, and sulfide profiles
LIST OF ABBREVIATIONS
C Celsius
CM Centimeter
CMBSF Centimeters below seafloor
M Meter
CHAPTER I
INTRODUCTION
Hydrothermal activity at spreading centers is typically found in open ocean
regions with very low sedimentation rates. The Guaymas Basin in the Gulf of California
is a unique spreading center in that hydrothermal fluids rise through a 300-400 m layer of
pelagic and terrigenous organic-rich sediments before escaping at the seafloor (Einsele et
al., 1980). Hydrothermal fluids that seep through the thick sediment layer can reach
subsurface temperatures greater than 300°C (Edmond and Von Damm, 1985). The upward transport of methane, organic acids, hydrogen, carbon dioxide, ammonia, and
hydrogen sulfide in hydrothermal flow supplies metabolic substrates to a highly diverse
microbial community carrying out metabolic processes such as methanogenesis, methane
oxidation, nitrification, sulfate reduction, and sulfide oxidation (Dhillon et al. 2003, 2005;
Teske et al. 2002, 2009).
Beggiatoa spp. are mat-forming, filamentous, sulfide-oxidizing bacteria that
colonize the surface of sulfide-rich sediments. With filament and cell diameters of up to
200 micrometers (µm), they are among the largest prokaryotes (Schulz and Jørgensen,
2001). At Guaymas Basin, Beggiatoa filaments range from only a few µm to more than
100 µm in diameter (Jannasch et al., 1989; Nelson et al., 1989). The intracellular volume
cytoplasm is only a thin layer between the vacuole and cell membrane (Jannasch et al.,
1989; Nelson et al., 1989). In most cases, these large vacuoles accumulate and store
nitrate (NO3-) (McHatton et al., 1996), although exceptions are known (Kalanetra et al., 2004). The thin cytoplasmic layer sometimes contains globules of elemental sulfur, and
these, along with stored NO3- in the vacuoles, likely sustain filaments during periods of inadequate electron donor and acceptor supply (Jannasch et al.,1989; McHatton et al.,
1996). In strong contrast to the brown sediments of Guaymas Basin, Beggiatoa spp.
typically form conspicuous white, yellow, and orange mats around sites of active
hydrothermal venting (Jannasch et al., 1989; Gundersen et al., 1992). The orange
pigmentation in Beggiatoa filaments is attributed to high cytochrome content (Prince et
al., 1988) based on examination of Beggiatoa mat sample 1615B, a suspension of
brightly colored filaments of a single width class with filament diameters of mostly 25 to
35 µm (Nelson et al., 1989). The white coloration is due to the refractive nature of
elemental sulfur granules stored in the cytoplasm (Schulz and Jørgensen, 2001). It is
currently unclear whether the source of the yellow coloration in Beggiatoa mats is
intracellular or extracellular.
The colorful Beggiatoa mats at the surface of otherwise brown sediments are
visual markers for complex subsurface microbial communities taking advantage of the
electron donor supply in hydrothermal vents and hydrocarbon seeps (Lloyd et al., 2010).
Beggiatoa mats with both white and orange filaments show a consistent pattern: orange
Beggiatoa spp. are found in the center of the mat at higher concentrations than white
filaments, which are most concentrated at the mat periphery around the orange filaments.
sediments as well as cold Gulf of Mexico sediments (Larkin and Henk, 1996; Nikolaus et
al., 2003), and suggests different habitat preferences of these Beggiatoa types. During
two R/V Atlantis cruises to Guaymas Basin (December 5-17, 2008; November 22 to
December 6, 2009), the association of Beggiatoa mats with hydrothermal seepage and the
habitat preferences of various Beggiatoa types were investigated by geochemical and
microbiological characterization of sediments underneath Beggiatoa mats in combination
with temperature measurements down to 40 cm sediment depth. In particular,
temperature profiles and corresponding sulfide and sulfate gradients from mats exhibiting
orange-to-white color transitions were examined to elucidate hydrothermal fluid delivery
CHAPTER II
SPATIAL HETEROGENEITY OF PHYLOGENETICALLY DIVERSE
ORANGE AND WHITE BEGGIATOA MATS IN THE HYDROTHERMAL
FIELDS OF GUAYMAS BASIN
Sampling Procedures and Methodology
Isolation of single Beggiatoa filaments, 16S rRNA gene amplification, and phylogenetic identification.
On board the R/V Atlantis,Beggiatoa spp. collected either by push coring or
“slurp gun” from the Alvin submersible were selected as single filaments with a pipette
and dragged through soft agar (agarose and sterile seawater, 1:1) for about a minute
before being stored at -80°C in 50 µl centrifuge tubes. Samples were then transported to
the laboratory at UNC-Chapel Hill for further analysis. Full genome amplifications were
performed using the Qiagen Ultra-fast miniprep genomic amplification protocol (Qiagen,
Germantown, MD). From the amplified genome, the gene sequence for the 16S region of
the small ribosomal RNA subunit was amplified by polymerase chain reaction (PCR)
using the B8F bacterial forward primer (AGR GTT TGA TCC TGG CTC AG) and the
B1492R bacterial reverse primer (CGG CTA CCT TGT TAC GAC TT) (Teske et al.,
2002). PCR amplifications were run in BioRad iCycler Thermal Cycler (Hercules, CA).
Each PCR reaction consisted of 1 µl amplified Beggiatoa genome, 2.5 µl 10X FBI buffer
2.0 µl 10 µM B1492R (Invitrogen), and 0.25 µl SpeedStar Taq polymerase (TaKaRa),
and was filled to 25 µl with sterile H2O. A preliminary melting period of 2 min at 94°C
was followed by 30 cycles of the following steps: 10 sec at 98°C, 15 sec at 58°C, and 20
sec at 72°C. These cycles were followed by 5 min at 72°C and the final temperature was
brought down to 12°C. Amplifications were confirmed by gel electrophoresis followed
by staining with ethidium bromide and visualization under ultraviolet light. Positive
samples were cloned using the TOPO TA cloning kit (Invitrogen) and individual colonies
were sequenced by GeneWiz (South Plainfield, NJ).
Near-complete 16S rRNA gene sequences were analyzed using Sequencher (Gene
Codes, Ann Arbor, MI) and confirmed as closely related (95% maximum identity) to
other non-Guaymas Beggiatoa spp. via the Basic Local Alignment Search Tool (BLAST)
of the National Center for Biotechnology Information (http://blast.ncbi.nlm.nih.gov/).
Next, the sequences were incorporated into a 16S rRNA alignment with sequences from
six closely related species of the γ-proteobacteria phylum using the ARB phylogenetic
software package (Ludwig et al. 2004) and the SILVA v95 database (Pruesse et al. 2007).
A phylogenetic tree was constructed using ARB’s neighbor-joining function with a
Jukes-Cantor correction.
Temperature profiling.
During Alvin dives 4483-4492 (Dec 6-17, 2008) and 4562-4573 (Nov 22-Dec 6,
2009) in the 2000 m deep Southern Guaymas trench, 113 temperature profiles were taken
in sediments near and within Beggiatoa mats, at the hydrothermally active areas from
27°N00.30 to 27°N00.60, and 111°W24.65 to 111°W24.35. All temperature probe
with the Alvin dive videotapes that provide a continuous record of all dive operations. Of
the 113 temperature profiles, 78 were measured in mats with both orange and white
filaments to focus on the relationship between differently colored Beggiatoa. A Heatflow
probe manufactured by the Woods Hole Oceanographic Institution (WHOI) was used to
measure 69 of the 78 temperature profiles. This is a 0.6 m titanium tube containing a
linear heater and five thermistors (type 44032, Omega Engineering, Inc.) at 10 cm
intervals along the length of the tube (personal communication with Lane J. Abrams,
WHOI). The thermistors have a tolerance of +/- 0.2 up to 40°C, and +/- 1°C up to 200°C. It is considered fully inserted when a disc at the base reaches the sediment surface, and
takes temperature readings at 0, 10, 20, 30 and 40 cmbsf. For 28 profiles, 5 cm depth
resolution was achieved by first inserting the probe 5cm less than complete insertion and
recording one profile, and then inserting the probe the rest of the way and recording a
second profile, 5 cm offset from the first. Temperatures were recorded after the readings
had stabilized for each of the five depths. Occasionally, this technique resulted in
channel formation, and the second set of readings was higher than the first. During dive
4490, one temperature profile was repeated three times, giving a range of sensor
precisions from 1.0 to 4.1°C. A high temperature probewas used to produce nine additional temperature profiles with varying depth intervals from the sediment surface
down to 37.5 cmbsf. The high temperature probe has a type-K thermocouple located at
the tip, with a tolerance of +/-3°C up to 400°C. Temperature profiles with this probe were achieved by touching the tip to the sediment surface for the first reading and then
Statistical analysis.
To analyze the relationship of sediment depth and mat color to surface and
subsurface temperatures we performed a 2-way analysis of variance (ANOVA) using
SigmaStat (Systat Software, San Jose, CA). Because data violated both normality and
equal variance, α (2) values were reduced so that p < 0.005. Post-hoc Tukey tests were
performed to estimate differences between treatment levels and the results were plotted
using SigmaPlot (Systat Software, San Jose, CA). The clearest images of Beggiatoa mats
captured by the submersible’s high definition cameras were used to create maps
indicating all temperature measurement locations in relation to mat cover with Adobe
Photoshop CS (Adobe Systems, San Jose, CA). Two red lasers that project from Alvin 10
cm apart were used to create scale bars.
3-D reconstruction of temperature field.
A three-dimensional reconstruction of the temperature field below “MegaMat”
(27°N0.459, 111°W24.526), the largest mat observed during the 2008 cruise, was
performed based on 14 temperature profiles that were systematically collected for this
location on Dive 4485 (Dec 8, 2009). Linear interpolation of measured temperature
profiles between 0 cm and maximum measured depth was performed in 5 cm resolution
with MatLab (The MathWorks, Natick, MA). Final temperature grids were calculated for
each depth horizon using the triangle interpolation scheme of the MatLab function
“gridfit” (MatLab Central, http://www.mathworks. com/matlabcentral/fileexchange/).
Shorter temperature profiles that did not reach 40 cm down were not extrapolated; in such
cases only data within the measured depth interval was used for calculation of the
Sulfate and sulfide profiles.
For porewater analyses, 15 ml Falcon tubes were filled completely with sediment;
the sediment samples were centrifuged and the resulting porewater was immediately
filtered using 0.45 µm syringe filters. For sulfate measurements, a 1 ml subsample was
acidified with 50 µl of 50% HCl and bubbled with nitrogen for 4 minutes to remove
sulfide. Sulfate analyses were performed aboard the ship using a 2010i Dionex ion
chromatograph (Sunnyvale, CA), as previously described (Martens et al., 1999). A
separate 1 ml porewater subsample was drawn into a syringe containing 0.1 ml of 0.1 M
zinc acetate solution to preserve the sulfide as zinc sulfide until analyzed. Sulfide was
analyzed spectrophotometrically aboard the ship using the Cline (1969) method.
Results and Discussion
16S rRNA gene sequences from four orange and two white Guaymas Beggiatoa
filaments were incorporated into a phylogenetic tree with five closely related species of
the phylum γ-proteobacteria (Figure 1). The six sequences represent five separate
phylotypes, indicating that neither three color groups nor three size groups alone are !"!#
$%&'(&)*+,--.&/0&*01&2-,*3!!4 $%&'(&)*+,--.&/0&*01&2-,*3!!5 $%&'(&)*+,--.&/0&*01&2-,*6445 78!9#4#:;*+,--.&/0&*)<"*=+&'*0>*?02@,<@.A2B
78!:C#C9;*+,--.&/0&*)<"*=D02/,1,'*?&2'02= $%&'(&)*+,--.&/0&*01&2-,*3!!5
$%&'(&)*+,--.&/0&*EF./,*3!!4 $%&'(&)*+,--.&/0&*EF./,*6445
GHI65!I!;*JF.0<K0@&*.2-1.@& /%HJJLDWRDVSï
7866!3IC;*+,--.&/0&*&KL&
!"!#$
Figure 1). Phylogenetic tree based on the gene sequence for the 16S small subunit ribosomal RNA from six Beggiatoa filaments isolated during our two cruises to Guaymas Basin in 2008 and 2009, and another
cruise in 1998. Guaymas Beggiatoa sequences were aligned with sequences from five closely related
species of the γ-proteobacteria group. Four orange species are highlighted with orange boxes and two
one orange filament collected on the 2008 cruise and another orange filament from 2009,
both with diameters of ~25 µm, are 100% identical; however, they are only 99% and 95%
similar to the other two orange Beggiatoa filaments collected in 1998 (35 µm filament
diameter) and 2008 (diameter unknown, but less than 60 µm), respectively. The 16S
rRNA sequences from the two white filaments from 1998 and 2008, both representing the
120 µm filament diameter size class (Nelson et al., 1989), are 99% identical, presenting
only six base pair mismatches. The 16S rRNA gene sequences of orange and white
Beggiatoa from Guaymas Basin reveal species-level diversity between the orange and
white filaments, as well as within the orange group alone. From this analysis we propose
that the change in color across a Beggiatoa mat is not a physiological variable within
otherwise closely related or identical organisms, but marks phylogenetically distinct
bacteria that sometimes overlap, but generally prefer distinct microhabitats within the
same mat.
To examine the general spatial relationship between Beggiatoa mat cover and
active hydrothermal seepage, 14 temperature profiles were taken in and around a
hydrothermally active site with extensive mat cover, termed MegaMat (Dive 4485,
December 8, 2008, 27°N00.464, 111°W24.512). A 3-dimensional reconstruction of
MegaMat temperature profiles exhibits a characteristic feature of Beggiatoa mats in
hydrothermally active sediments: central portions of mats have hotter surface and
subsurface temperatures, which decrease considerably as temperature measurements
approach bare sediments at a mat’s edge (Figure 2). Surface temperatures, however, do
temperatures up to 200°C just 35 cm beneath MegaMat. To check this trend with
temperature data from other Guaymas Basin locations, surface and subsurface (40 cmbsf)
temperatures from 78 temperature profiles taken at 15 different mats with both orange
and white filaments were grouped by mat color, or by distance from a mat in the case of
bare sediment profiles (Figure 3). Group “O” consists of temperature profiles taken in
orange portions of mats (which may have some white filaments), group “W” consists of
profiles taken in white portions of mats in which no orange filaments were detected (by
inspection of mat tufts with a dissection microscope), group “S” consists of profiles taken
in nearby bare sediments (<1 m from a mat), and group “B” consists of profiles taken in
! " # $ %&' %!' ( %#' ) * % + %)' %%' *' ,!' &' !' %&' %!' )&' )!' #&' #!' "&' "!'
&' !&' %&&' %!&' )&&'
D ep th (c mb sf) Temperature (°C) %!' %' %%' +'
!' "'#')'$'
('
%#'
%)'
%&'
Temperature (°C)
Depth: 40 cm
Distance (cm)
Distance (cm)
Distance (cm)
Distance (cm)
Depth: 0 cm
50 100 150
20 40 60 80
Depth: 5 cm
50 100 150
20 40 60 80
Depth: 10 cm
50 100 150
20 40 60 80
Depth: 15 cm
50 100 150
20 40 60 80
Depth: 20 cm
50 100 150
20 40 60 80
Depth: 25 cm
50 100 150
20 40 60 80
Depth: 30 cm
Distance (cm)
50 100 150
20 40 60 80
Depth: 35 cm
Distance (cm)
50 100 150
20 40 60 80
50 100 150
20 40 60 80 20 40 60 80 100 120 140 160 180 200 Distance (cm) )&&' %+&' %)&' Temperature (°C)
Depth: 40 cm
Distance (cm)
Distance (cm)
Distance (cm)
Distance (cm) Depth: 0 cm
50 100 150 20
40 60 80
Depth: 5 cm
50 100 150 20
40 60 80
Depth: 10 cm
50 100 150 20
40 60 80
Depth: 15 cm
50 100 150 20
40 60 80
Depth: 20 cm
50 100 150 20
40 60 80
Depth: 25 cm
50 100 150 20
40 60 80
Depth: 30 cm
Distance (cm) 50 100 150 20
40 60 80
Depth: 35 cm
Distance (cm) 50 100 150 20
40 60 80
50 100 150 20 40 60 80 20 40 60 80 100 120 140 160 180 200 Distance (cm) Temperature (°C)
Depth: 40 cm
Distance (cm)
Distance (cm)
Distance (cm)
Distance (cm)
Depth: 0 cm
50 100 150 20
40 60 80
Depth: 5 cm
50 100 150 20
40 60 80
Depth: 10 cm
50 100 150 20
40 60 80
Depth: 15 cm
50 100 150 20
40 60 80
Depth: 20 cm
50 100 150 20
40 60 80
Depth: 25 cm
50 100 150 20
40 60 80
Depth: 30 cm
Distance (cm)
50 100 150 20
40 60 80
Depth: 35 cm
Distance (cm)
50 100 150 20
40 60 80
50 100 150 20 40 60 80 20 40 60 80 100 120 140 160 180 200 Distance (cm) Temperature (°C)
Depth: 40 cm
Distance (cm)
Distance (cm)
Distance (cm)
Distance (cm) Depth: 0 cm
50 100 150 20
40 60 80
Depth: 5 cm
50 100 150 20
40 60 80
Depth: 10 cm
50 100 150 20
40 60 80
Depth: 15 cm
50 100 150 20
40 60 80
Depth: 20 cm
50 100 150 20
40 60 80
Depth: 25 cm
50 100 150 20
40 60 80
Depth: 30 cm
Distance (cm) 50 100 150 20
40 60 80
Depth: 35 cm
Distance (cm) 50 100 150 20
40 60 80
50 100 150 20 40 60 80 20 40 60 80 100 120 140 160 180 200 Distance (cm)
!"#$%&'()*'+,) !"#$%&'()*'+,) !"#$%&'()*'+,) !"#$%&'()*'+,)
!" #$ %& '()* '+, ) !" #$ %& '()* '+, ) -( + .( /% $0 /( )*1 2, ) (&' )&' "&' +&' %&&' %"&' %(&' 3) 4)
Figure 2A). MegaMat hydrothermal area with 14 color-coded temperature measurement points and
their corresponding temperature profiles. 2B) Contour plots of reconstruction of temperature field in 5
cm sediment depth intervals. Only temperature data within the measured depth interval was used for calculation of temperature grids (red dots). Short temperature profiles were not extrapolated vertically, no red dots are plotted in such cases, and temperatures at these spots were inferred based on x/y interpolation from neighboring T data points only. The black line marks the area of measured
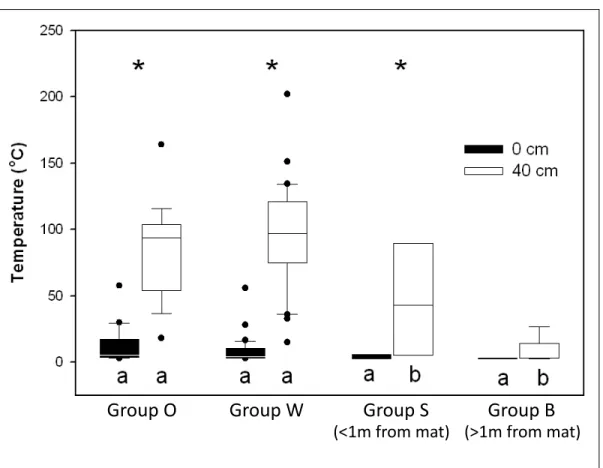
background sediments (>1 m from a mat). The post hoc Tukey test finds that depth
influences temperature in groups O, W, and S (denoted by asterisks), but not in group B,
which has relatively cool temperatures at every depth (Figure 3). This observation is
consistent with previous results that sediments unassociated with hydrothermal seepage
have temperatures near the seawater background of 3°C (Gunderson et al., 1992). Surface temperatures in bare sediments near mats (group S) range from 3-7°C while background
!"#$%&'($%$)*+% !,#$%&'($%$)*+%
-'(./%0%
-'(./%1%
-'(./%2%
-'(./%3%
Figure 3. Box and whisker plot depicting the in situ temperatures for the sediment-water interface (0
cm) and 40 cm sediment depth for orange and white Beggiatoa mats, sediments near the mats, and cold
background sediments distant from microbial mats. The boxes encompass temperature points within
the 25-75th percentile range. A line through a box represents the median temperature of the group at
either 0 cm or 40 cm depth. The whiskers represent the 10th percentile (at the top) and the 90th
percentile (at the bottom). Points outside of the whiskers are considered outliers. The asterisks denote
groups in which temperature is influenced by depth with statistical support (post hoc Tukey test). The
letters a and b denote significant differences between group temperature averages at either 0 cm or 40
cm below seafloor. Sample sizes: Group O – 26 (0cm) and 19 (40cm); Group W – 34 (0cm) and 33 (40cm); Group S – 7 (0cm) and 6 (40cm); Group B – 8 (0cm) and 9 (40cm).
any group as encompassing significantly warmer surface temperatures than any other
group. However, because all groups have a clearly defined lower limit surface
temperature of 3°C set by ambient seawater conditions, and a less consistent upper limit surface temperature determined by the hydrothermal activity beneath a given mat, surface
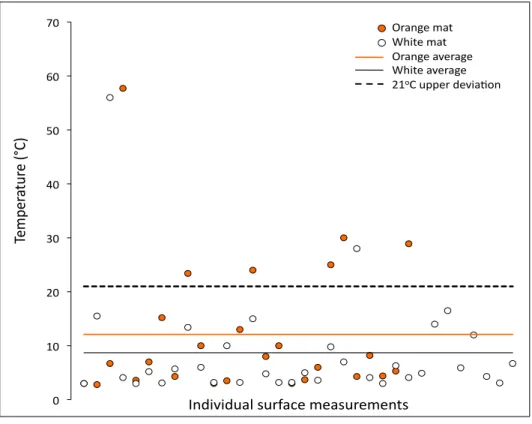
temperature averages for all groups are skewed towards 3°C. While surface temperatures within both groups O and W range from 3°C to occasionally as high as 60°C, most surface temperature measurements are in the 3-16°C range (Figure 4). This cool surface
temperature range indicates that Guaymas Basin Beggiatoa are not thermophilic, as might
be assumed from their association with hydrothermal seepage,but are associated with
relatively cool in situ temperatures. The in situ temperatures of Guaymas Basin
Beggiatoa mats are consistent with temperature optima near 20°C for CO2 assimilation by intact Beggiatoa filaments (Nelson et al., 1989), and with prior in situ temperature sensor
measurements of 3-5°C in Beggiatoa mats at Guaymas Basin (Gundersen et al., 1992). The upper extent of the standard deviation from the mean of all surface
temperatures from all mats is 21°C, as plotted in figure 4. Closer examination of groups O and W reveals that orange Beggiatoa filaments were observed at in situ temperatures
above 21°C more often than white Beggiatoa filaments. If the dataset of surface temperatures from Beggiatoa mats is expanded to include the 28 readings in mats with
only white filaments (and no orange filaments) as well as orange and white mats, the
upper extent of the standard deviation changes minimally, to 22°C. High temperatures above this limit, or statistical outliers, are found in 23% of all measurements in orange
sections (n=26), in contrast to either 5.9% in white sections adjacent to orange sections
sections. These surface temperature outliers suggest that temporary surges in
hydrothermal flux might be more common beneath the predominantly orange center of a
mat than the white periphery; as a corollary, orange Beggiatoa may have developed
greater thermotolerance than white Beggiatoa. As a caveat, our data represent one-time
snapshots of Beggiatoa communities that move and rearrange in response to a dynamic
hydrothermal system, and we cannot be sure whether outliers represent temporary surges
or sites where elevated hydrothermal flux is more persistent. Daily photo surveys of a
Beggiatoa mat on our 2009 cruise demonstrated subtle but noticeable changes in surface
texture over 11 days, which could indicate rapid fluctuations in subsurface hydrothermal
flow. Moreover, a well-developed Beggiatoa mat with subsurface temperatures of 50°C
!"
#
$"
%&
'(
%"
)*+
,-)
.) /.) 0.) 1.) 2.) 3.) 4.)
5.) 6%&78")#&')
9:;'")#&') 6%&78")&<"%&8") 9:;'")&<"%&8") 0/=,)($$"%)>"<;&?=7)
@7>;<;>(&A)B(%C&D")#"&B(%"#"7'B)
Figure 4. Individual temperature readings in orange and white Beggiatoa mats at the sediment surface of 60 temperature profiles. The lines indicate the temperature average for orange (12.1°C) and white Beggiatoa mats (8.7°C). Although most datapoints are in the low temperature range (<10°C), some high temperature measurements above the upper extent of standard deviation from the mean (21°C) are
present, and are found more frequently in orange Beggiatoa mats than in white mats.
(Marker 6) was documented during our 2008 cruise, but had disappeared in 2009; only
bare sediment with a subsurface temperature (at 40 cmbsf) of less than 6°C was found. While surface temperatures illuminate in situ temperature ranges of Guaymas
Beggiatoa spp., subsurface temperatures provide information related to the strength of
hydrothermal flow beneath the mat. The average temperatures at 40 cmbsf from groups
O and W are not significantly different from one another, but both are significantly
warmer than average temperatures below bare sediments, in groups S and B (Figure 3).
These observations are consistent with our working hypothesis that hydrothermal activity
and temperatures are higher beneath mat cover than beneath bare sediments, whether bare
sediments are near or far from a mat. The average 40 cmbsf-temperatures for all 15 mats
with orange and white Beggiatoa do not suggest a predictive relationship between
filament color and subsurface temperature (Figure 3), in the sense that a particular
subsurface temperature should always correspond to a specific Beggiatoa color.
Temperature regimes change considerably from one mat to the next, and temperature
ranges beneath Beggiatoa of the same color but from different mats can be distinct from
one another.
During dives 4483, 4490, 4569, and 4572 temperature, sulfide, and sulfate
profiles were taken in transects across four separate orange and white Beggiatoa mats,
allowing unambiguous color groupings in close proximity for optimal comparison
(Figure 5). Mats from dives 4483, 4490, 4569, and 4572 will now be referred to as Mats
increase with depth (Figure 5A). Surface temperatures from mat 4 are not available but
subsurface temperatures do increase with depth. Temperature profiles taken in bare
sediments with no mat cover yield the coolest temperatures. Next to Mats 1 and 2, the
bare sediment profiles at 10 cm distance from mat cover were warmer than the
temperature profiles next to mats 3 and 4, at 25 and 15 cm distance, respectively. This is
consistent with our prediction that elevated temperatures due to hydrothermal activity
decrease with increasing distance from Beggiatoa mats.
Transects of temperature profiles for individual mats show that the typical
sequence of orange and white Beggiatoa mats are supported by hydrothermal fluid of
different temperatures (Figure 5A). Orange filaments in mats 1, 2 and 3 are positioned
over the shallow subsurface temperature maximum (at 40 cmbsf) and are surrounded by
white mats overlying less hot sediments. At the same time, there are no predictive
temperature regimes for orange versus white mats, since the temperature ranges
associated with white or orange Beggiatoa can shift from one mat to another. For
example, at 40 cm sediment depth, the temperature regimes below Beggiatoa filaments of
the same color in Mats 1 and 3 are 15-30°C lower than in their Mat 2 counterparts, even though the subsurface temperature distribution of orange and white Beggiatoa in relation
to each other remains the same. Mat 4 provides an interesting exception: here, the
temperature profile underneath white Beggiatoa is initially cooler than the orange
mat-associated temperature profile, but it steepens downcore, and surpasses the temperature
of the orange profile at a depth of 25 cmbsf. These temperature curves could result from
white mat before it approaches the sediment surface laterally offset underneath the orange
mat.
If temperature provides an applicable proxy, hydrothermal fluid flow may be
greater to the orange portions than to the white portions of Beggiatoa mats. Although a
definitive calculation of hydrothermal flux cannot be achieved from the current dataset,
Fourier’s law for the transfer of heat demonstrates the tendency of a heat flux, whether
conductive, convective, or a combination of both, to (i) increase with the magnitude of a
gradient and (ii) be in a direction opposite the direction of the gradient. As such, higher
!"#$%&' ()*+&' ,&-*.&$+' /' 0' 1/' 10' 2/' 20' 3/' 30' 4/' 40'
/' 2/' 4/' 5/' 6/' 1//' 12/'
!"#$%$
78',!429:;2,'-#+#'
0.0 1.0 2.0 3.0 4.0
0 10 20 30 40
0.0 5.0 10.0 15.0 20.0 25.0 30.0 35.0 0.0 1.0 2.0 3.0 4.0 0
10 20 30 40
0.0 5.0 10.0 15.0 20.0 25.0 30.0 35.0 0.0 1.0 2.0 3.0 4.0 0
10 20 30 40
0 5 10 15 20 25 30 35
!"#$&$ /' 0' 1/' 10' 2/' 20' 3/' 30' 4/' 40'
/' 2/' 4/' 5/' 6/' 1//' 12/'
!"#$&$
0.0 1.0 2.0 3.0 4.0 0
10 20 30 40
0 5 10 15 20 25 30 35 0 1 2 3 4
0 10 20 30 40
0 5 10 15 20 25 30 35 0 1 2 3 4
0 10 20 30 40
0 5 10 15 20 25 30 35
/' 0' 1/' 10' 2/' 20' 3/' 30' 4/' 40'
/' 2/' 4/' 5/' 6/' 1//' 12/'
!"#$'$
!"#$'$
($
0.0 1.0 2.0 3.0 4.0
0 10 20 30 40
0 5 10 15 20 25 30 35 0.000 1.000 2.000 3.000 4.000 0
10 20 30 40
0 5 10 15 20 25 30 35
Depth (c
mbsf)
0.000 1.000 2.000 3.000 4.000 0
10 20 30 40
0 5 10 15 20 25 30 35
/' 0' 1/' 10' 2/' 20' 3/' 30' 4/' 40'
/' 2/' 4/' 5/' 6/' 1//' 12/'
!"#$)$ !"#$)$ < &= +) '>?.@ AB C'
,!429'
,!429'
,!429'
;2,'
;2,'
;2,'
< &= +) '>?.@ AB C' < &= +) '>?.@ AB C' < &= +) '>?.@ AB C'
D&.=&"#+E"&'>8FC'
*+,-"#.$"/0$1+,20.$34/3./#5"64/1$78!9$ G'
H'
Figure 5A. Temperature profiles from four selected Beggiatoa mats for comparison of temperature
regimes along gradients from orange mat to white mat to nearby sediments. Mat 1) Beggiatoa mat at
Marker 2, Dive 4483, Dec 6, 2008 (27°N0.463, 111°W24.556). Mat 2)Beggiatoa mat ca. 25 m southwest
of Megamat, Dive 4490, Dec 14, 2008 (27°N0.446, 111°W24.532). Mat 3)Beggiatoa mat at Marker 14,
Dive 4569, Nov. 30, 2009 (27°N0.47, 111°W24.431). Mat 4) Beggiatoa mat at Marker 27, Dive 4572,
Dec. 2, 2009 (27°N0.445, 111°W24.529).
5B) Sulfate and sulfide profiles from Mats 2, 3, and 4 for comparison of geochemical regimes along
gradients from orange mat to white mat to nearby sediments.
temperature gradients imply higher heat fluxes. Because hydrothermal fluids are both a
source of heat and of reduced organic and inorganic compounds to surface sediments, an
increase in heat flux implies a related increase in delivery of electron donors and carbon
sources to the Beggiatoa living at the sediment-water interface. Higher temperature
gradients exist beneath the orange portions of three out of four mats, and temperature
profiles below bare sediments are lowest for all four mats. Thus, it appears that within a
given mat, orange Beggiatoa filaments usually concentrate over the local hydrothermal
flux maximum and may therefore receive the greatest supply of carbon sources and
metabolically relevant electron donors like sulfide. However, this interpretation might be
too simplistic for two reasons. First, temperature and microbial substrate flux supporting
mat growth may not always be proportionally linked; substantial variation may be caused
by localized cooling of vent fluids, temporal changes in fluid flow, or subsurface
microbial activity levels. Second, temperature and hydrothermal flux maxima could
impact Beggiatoa mats indirectly, by pushing subsurface anaerobic remineralization and
respiration processes that produce sulfide and other electron donors towards the surface
sediments.
These possibilities were investigated by measuring porewater sulfate and sulfide
concentrations in the shallow subsurface. The sulfide profiles and peaks result from the
interplay of upwardly or laterally migrating sulfidic subsurface fluid, biogenic sulfate
reduction fuelled by low-molecular-weight carbon substrates within the sediment, and
sulfide oxidation near the sediment surface where suitable electron acceptors such as
oxygen and nitrate are available. For Mats 2, 3, and 4, push cores for porewater analysis,
First, the results show a linkage between high subsurface temperatures and increased
sulfide concentrations. The maximum sulfide concentration ranged between 2 mM and 3
mM beneath the orange and white sections of all three mats. Sulfide concentrations
beneath the orange and white portions of Mats 3 and 4 are substantially greater than the
sulfide concentrations beneath the bare sediment portions near the same mats. These
enhanced sulfide concentrations are congruent with the temperature profiles of these
mats, which show that bare sediment subsurface temperatures are substantially lower—
not surpassing 20°C at depth—than the orange and white subsurface temperatures, which
reach at least 60°C at depth. If mat cover, high temperature, and sulfide concentration are
always linked, bare sediments without mats should be cold and contain no sulfide.
However, the bare sediment in Mat 2 gives an example that such sites can have a high
sulfide supply and hot temperatures. We hypothesize that sulfidic, hydrothermally active
bare sediment sites undergo gradual Beggiatoa mat colonization, and time series studies
would provide an answer to this question.
Second, the sulfide profiles are consistent with microbial activity zones in the
shallow subsurface that shift vertically in response to the temperature regime. The two
processes that generate and consume porewater sulfide—sulfate reduction and sulfide
oxidation—are temperature-dependent. Microbial sulfide oxidation becomes
thermodynamically unfavorable at temperatures above 50°C (McCollom and Shock,
1997), and temperatures from 90 – 100°C constitute the upper limit for reliably detected
microbial sulfate reduction in Guaymas Basin sediments (Jørgensen et al., 1990; Elsgaard
et al., 1994; Weber and Jørgensen, 2002). Consequently, hotter temperature profiles
temperatures are cooler. This is seen in Mat 3 and Mat 4, where the shallowest sulfide
concentration maxima coincide with hotter temperature regimes below the orange portion
of the mats. Beneath the white sections of Mats 3 and 4, the sulfide maxima are not only
deeper, but the profiles are stretched across a greater depth range. Consistent with this
interpretation, the sulfide maxima in Mats 3 and 4 coincide with temperatures of 40 –
60°C, around the upper limit for sulfide oxidation (McCollom and Shock, 1997) and also
near the upper growth limit for sulfide-oxidizing ε-proteobacteria (Campbell et al., 2006),
the most commonly found sulfur oxidizers at hydrothermal vents including Guaymas
Basin (Teske et al., 2002). Moreover, 50°C, the temperature at which sulfate reduction
rates in Guaymas sediments are highest (Jørgensen et al., 1990) falls within this range.
At lower temperatures towards the sediment surface, sulfide oxidation removes sulfide
faster than sulfate reduction produces it; at higher temperatures in deeper sediments,
sulfide generation by thermophilic sulfate reduction prevails.
Thus, the distribution pattern of orange and white Beggiatoa may be a
consequence of temperature- and hydrothermal flux-driven upward compression of
metabolic zones in the sediments underneath the mats, and the associated steeper fluxes
of metabolic products, including sulfide, that are generated in the near-surface sediment
and transported to the sediment surface where the Beggiatoa mat resides. A variation of
the Guaymas model, where electron acceptor limitation replaces temperature as the
primary influence that compresses metabolic zones, provides a working hypothesis for
the same spatial distribution of orange and white Beggiatoa filaments in cold
hydrocarbon seep sediments in the Gulf of Mexico (Larkin and Henk, 1996; Nikolaus et
the same time compresses the zone of highest sulfate reduction rates towards the
mat-covered sediment surface (Lloyd et al. 2010). To summarize, we suggest that (i) the
subsurface temperature regime that results from localized hydrothermal flux in Guaymas
Basin drives and compresses metabolic activity towards the sediment surface, and (ii) the
resulting increased supply of reducing compounds and energy sources to Beggiatoa mats
at the sediment surface controls the differential positioning of orange and white
Beggiatoa filaments.
Supposing our interpretation of this system is accurate and flux of energy sources
is greatest to the predominantly orange center of the mat, a possible explanation for this is
that orange Beggiatoa filaments have a smaller capacity than white filaments for storage
of electron donor in the form of elemental sulfur, and therefore cannot persist as long as
white filaments during periods of inadequate sulfide delivery. This is consistent with the
observation that white filaments typically fall within the largest width group, ~120 µm,
while orange filaments are classified into the two smaller width classes of ~25 µm and
~35 µm. Although we know little concerning the volume of the thin cytoplasmic layer
where elemental sulfur is stored, a large white filament is likely to have more storage
space than a thin orange filament. This could also explain why some white filaments
were found in the orange portions of mats and no orange filaments were observed in the
white sections, as white filaments may have the ability to grow further from the direct
hydrothermal source than orange filaments. However, depending on the ratio of
cytoplasmic volume to total biomass, an increase in electron donor storage space might
also mean a relative increase in biomass to support. Further studies to assess the
microscopy (Costello 2006; Larkin and Henk 1996), or direct concentration
measurements of elemental sulfur stored within filaments (Zopfi et al., 2001), are needed
to determine a Beggiatoa filament’s capacity for storage of electron donors.
Conclusion
The as-yet uncultivated Beggiatoa spp. at Guaymas Basin represent at least five
separate phylotypes and colonize the surface of hydrothermal sediments in contact with
seawater at about 3°C. Temperatures at the Beggiatoa-inhabited sediment-water interface usually range between 3 and 16°C but may reach as much as 60°C, while surface
temperatures of non-Beggiatoa inhabited sediments are typically nearer ambient seawater
temperatures of 3-4°C. Because in situ temperature peaks were observed more frequently in orange mat areas than in white mat areas, we suggest that orange filaments may be
more thermotolerant than white filaments, but further studies are necessary to confirm
this.
Within a given mat, orange Beggiatoa spp. are usually restricted to surface
sediments above the steepest subsurface temperature gradients as well as more
compressed sulfide concentration profiles. We conclude that the delivery rate of, and
proximity to electron sources in the microbially active shallow subsurface, rather than the
in situ temperature range by itself, controls the differential positioning of orange and
white filaments in a Beggiatoa mat. Future work will integrate functional-gene
sulfide, dissolved inorganic carbon and organic acid gradients, and in situ temperature
logger data that document temperature fluctuations and Beggiatoa mat response over
Appendix I: Table 1
A. The upper sections (-‐5 – 20 cmbsf) of all temperature profiles
Profiles highlighted in grey are from Beggiatoa mats with only white filaments (where no orange filaments were detected).
Dive-Profile Year Location -5 0 2 4 5 8 10 12 15 16 20
4483-HT1 2008 Orange mat 3 14 35 55
4483-HT1a 2008 Orange mat 2.8 17 43 58 68
4489-HF4 2008 Orange mat 34
4489-HF8 2008 Orange mat 6.7 58 91.6 4489-HF9 2008 Orange mat 57.7 96 104
4490-HF1 2008 Orange mat 3.2 3.6 11 33.8 71.3 77.3 4492-HF3 2008 Orange mat 7 54 127
4493-HF2 2008 Orange mat 15.2 33.1 36
4493-HF3 2008 Orange mat 4.3 28.9 59.2 4493-HF4 2008 Orange mat 23.4 85.4 91.7 4493-HF6 2008 Orange mat 10 38 85
4483-HT2a 2008 Orange mat 3 12 36 54
4483-HF1 2008 Orange mat 2.8 3.7 30 67
4483-HF3 2008 Orange mat 3 6 34 27
4483-HF4 2008 Orange mat 3 25 87 100
4483-HF7 2008 Orange mat 3 30 19 27
4485-HF7 2008 Orange mat 4.3 9.5 41.5
4485-HF14 2008 Orange mat X
4489-HF2 2008 Orange mat 11.3 37.2
4489-HF3 2008 Orange mat 8.2 36.8 39.5
4490-HF2 2008 Orange mat 3.4 4.4 20.9 36.9 50.1 62.6
4568-INS1-HF5 2009 Orange mat 5.3 61.5 85.5
4573-M24-HF1 2009 Orange mat 28.9 91.3 103.1 96.7 77.2
4563-M14-HF4 2009 Orange mat 3.0 10.0 27.0
4568-INS1-HF3 2009 Orange mat 3.5 16.7 16.4 84.7 85.4
4569-M14-HF3 2009 Orange mat 13.0 48.0 65.3
23
Dive-Profile Year Location -5 0 2 4 5 8 10 12 15 16 20
4562-WMM-HT1 2009 Orange mat 24.0
4562-WMM-HT2 2009 Orange mat 8.0
4562-WMM-HT3 2009 Orange mat 10.0
4483-HT3a 2008 White mat 3 14 30 44 54
4483-HF8 2008 White mat 3 15.5 80.3 81.1
4483-HF2 2008 White mat 3 56 94 95
4483-HT1b 2008 White mat 6 105 107 106
4483-HT4b 2008 White mat 3 37 103 109
4483-HT5b 2008 White mat 15 64 95 107
4483-HF9 2008 White mat 2.8 54 99 105
4484-HF1 2008 White mat 21 119 134
4484-HF4 2008 White mat 3 14 35
4484-HT1 2008 White mat 1.8 39 61 84.4 98
4485-HF8 2008 White mat 4.1 20.2 116.4
4485-HF13 2008 White mat 7 55.9 155.1
4485-HF17 2008 White mat 3 15.7 45.7
4485-HF18 2008 White mat 5.2 37 68
4485-HF19 2008 White mat 3.1 7.5 30
4486-HT3 2008 White mat 3 57 101 130
4486-HF6 2008 White mat 55 111
4490-HF3 2008 White mat 3.6 5.7 22.1 34 43.5 42
4490-HF6 2008 White mat 4.3 13.4 48.6 73.3 87.4 100.2
4490-HF7 2008 White mat 2 15 64
4492-HF2 2008 White mat 6 50 76
4493-HF1 2008 White mat 3.2 11 15
4493-HF5 2008 White mat 10 57.3 95.6
4483-HT4a 2008 White mat 3 16 28 41 51
4483-HF5 2008 White mat 3 6.3 29 44
4483-HF6 2008 White mat 3 4.1 19 36
4483-HT2b 2008 White mat 6 16 29 40
24
Dive-Profile Year Location -5 0 2 4 5 8 10 12 15 16 20
4483-HT3b 2008 White mat 3 10 18 28
4483-HF10 2008 White mat 3 4.9 21 36
4484-HT2 2008 White mat 16.6 31.8 36.5 38.5
4485-HF 2008 White mat 2.94 4.9 9.5 39.5 58.9 75.6
4485-HF1 2008 White mat 4.1 16.8 39.9
4485-HF2 2008 White mat 3.4 14 20.8 36 59.2 75.8
4485-HF3 2008 White mat 3.4 16.5 30.9 51.2 77.4 100.9
4485-HF4 2008 White mat 3.2 5.9 30.5 39.3 73.4 84.6
4485-HF5 2008 White mat 3.2 12 15.2 37.3 48.6 62.5
4485-HF6 2008 White mat 4 6.3 19.8
4485-HF9 2008 White mat 5.5 34 119.1
4485-HF10 2008 White mat 3.5 19.4 50.2
4485-HF12 2008 White mat 7.6 21
4485-HF15 2008 White mat 3.2 35.6 69.7
4486-HF7 2008 White mat 31 68
4489-HF5 2008 White mat 6.2 63 104
4489-HF6 2008 White mat 3.3 25 56.9
4489-HF7 2008 White mat 5.4 35.4 70
4490-HF4 2008 White mat 3.4 4.3 25.3 31.9 45.9 46
4491-HF1 2008 White mat 3.1 8.7 18.5
4491-HF4 2008 White mat 3 67 126
4491-HF5 2008 White mat 6 94 82
4491-HF6 2008 White mat 4
4491-HF7 2008 White mat 4 26 57
4562-M1-HF1 2009 White mat 5.6 24.6 34.6 52.0 60.1
4562-M1-HF2 2009 White mat 3.9 24.7 23.9 50.4 64.4
4562-M1-HF6 2009 White mat 4.5 18.7 29.5 44.9 54.1
4563-M6-HF3 2009 White mat 3.2 6.5 36.6
4564-M27-HF1 2009 White mat 15.0 28.5 54.5
4564-M27-HF2 2009 White mat 55.0 77.6 95.7
4564-M27-HF3 2009 White mat 4.8 29.7 52.0
25
Dive-Profile Year Location -5 0 2 4 5 8 10 12 15 16 20
4568-INS1-HF1 2009 White mat 3.2 13.7 23.7 45.1 56.6
4568-INS1-HF2 2009 White mat 3.2 13.1 17.5 43.1 43.6
4568-INS1-HF4 2009 White mat 5.0 16.4 47.3
4569-M14-HF2 2009 White mat 3.6 20.8 38.7
4569-INS1-HF1 2009 White mat 23.4 57.9 91.6
4569-INS1-HF3 2009 White mat 15.1 47.5 69.0
4569-INS1-HF4 2009 White mat 9.8 56.1 92.4
4569-M3-HF1 2009 White mat 7.0 20.6 34.7
4571-M4-HF3 2009 White mat 28.0 61.0 85.0
4573-M24-HF4 2009 White mat 4.1 28.1 37.1 64.7 68.5
4562-M1-HF3 2009 White mat 8.0 24.0 36.8 48.9 59.8
4562-M1-HF4 2009 White mat 7.0 16.3 25.9 37.5 47.4
4563-M6-HF2 2009 White mat 3.1 3.1 21.0
4569-M3-HF2 2009 White mat 6.7 13.8 28.2
4483-HT5a 2008 <1m Sediment 3 5 20 39
4485-HF 2008 <1m Sediment 2.92 2.95 2.88 2.88 2.96 3.01 4485-HF 2008 <1m Sediment 2.93 2.93 2.83 2.91 3.16 3.43 4485-HF16 2008 <1m Sediment 3 5.8 10.2 26.7 31.6 48
4486-HT1 2008 <1m Sediment 3 16 31 45 61 4486-HT2 2008 <1m Sediment 3 27 52 73
4486-HF4 2008 <1m Sediment 10 36
4486-HF5 2008 <1m Sediment 14 39
4486-HF8 2008 <1m Sediment 22 47
4486-HF9 2008 <1m Sediment 16 47
4486-HF10 2008 <1m Sediment 23 44
4486-HF11 2008 <1m Sediment 24 40
4490-HF5 2008 <1m Sediment 3 4.3 6.2 22.5 26.2 39.8 4490-HF8 2008 <1m Sediment 3.2 20.1 45.1 4491-HF3 2008 <1m Sediment 3 5 10
4492-HF1 2008 <1m Sediment 7 24 37
26
Dive-Profile Year Location -5 0 2 4 5 8 10 12 15 16 20
4562-M1-HF5 2009 <1m Sediment 3.3 6.9 11.8 17.5 20.6
4571-M4-HF1 2009 <1m Sediment 6.9 27.7 43.7
4571-M4-HF2 2009 <1m Sediment 13.7 31.5 40.1
4572-M27-HF3 2009 <1m Sediment
4485-HF 2008 >1m Background 2.94 2.95 2.84 2.87 2.93 2.95
4485-HF 2008 >1m Background 2.92 2.93 2.86 2.86 2.93 2.94
4491-HF2 2008 >1m Background 2.99 2.85 2.99
4562-M6-HF1 2009 >1m Background 3.2 3.4 3.8
4564-HF1 2009 >1m Background 4.8 5.2 8.9 9.9 14.2
4567-HF1 2009 >1m Background 3.2 3.4
4569-M14-HF1 2009 >1m Background 3.3 7.0 13.2
4569-YM-HF2 2009 >1m Background 2.9 2.9 2.9
4569-HF1 2009 >1m Background 2.9 2.9 2.9
B. The lower sections (22 – 55 cmbsf) of all temperature profiles
Profiles highlighted in grey are from Beggiatoa mats with only white filaments (where no orange filaments were detected).
Dive-Profile 22 24 25 28 30 32 35 37 40 42 45 55
4483-HT1 71 82
4483-HT1a 75 82 88
4489-HF4 54 60 64 65
4489-HF8 105 110
4489-HF9 102 104
4490-HF1 88.28 98.7 110 115.7
4492-HF3 149 164
4493-HF2 40.9 49
4493-HF3 80.1 90.4
4493-HF4 84.6 90.3
4493-HF6 94 83
27
Dive-Profile 22 24 25 28 30 32 35 37 40 42 45 55
4483-HT2a 64 70 75 80
4483-HF1 91 96
4483-HF3 24 18
4483-HF4 102 101
4483-HF7 43 37
4485-HF7 120
4485-HF14 4489-HF2 41.8 43.2 44.4 4489-HF3 41 40.8 4490-HF2 76.8 89.2 98 105
4568-INS1-HF5 90.7 96.4 4573-M24-HF1 68.5 57.8 68.0 86.4 91.4 4563-M14-HF4 43.0 54.0 4568-INS1-HF3 98.3 96.5 100.3 99.6 103.6 4569-M14-HF3 83.4 93.7 4562-WMM-HT1 4562-WMM-HT2 4562-WMM-HT3 4483-HT3a 59 70 76
4483-HF8 85.6 94.1 4483-HF2 97 100
4483-HT1b 107 107
4483-HT4b 109 109
4483-HT5b 107 107
4483-HF9 108 107
4484-HF1 152 162
4484-HF4 55 71 82
4484-HT1 104.9 107.1 108.1 109.2
4485-HF8 149.8
4485-HF13 189.9 198.9 201.8
28
Dive-Profile 22 24 25 28 30 32 35 37 40 42 45 55
4485-HF17 73.2 96.2
4485-HF18 95.7 122.4
4485-HF19 66.3 106.5
4486-HT3 155 161 164 165
4486-HF6 142 163 163
4490-HF3 57.2 70.1 90.5 97
4490-HF6 102.6 103.7 101.1 101.5
4490-HF7 105 138
4492-HF2 86 90
4493-HF1 17 33
4493-HF5 125.9 131.21
4483-HT4a 60 66 72
4483-HF5 48 67
4483-HF6 52 60
4483-HT2b 44 46 47
4483-HT3b 33 34 35
4483-HF10 45 51
4484-HT2 39 35.8 28.8 21.6
4485-HF 85.9 91 89.1 93.3
4485-HF1 72.4
4485-HF2 89.8 113.7 121.3 133.7
4485-HF3 115.9 120.5 123.5 130.6
4485-HF4 93.2 108.2 111.3 119.5
4485-HF5 66.5 80.7 83.9 98.2
4485-HF6 23 39.3
4485-HF9 131.1 133 134.5
4485-HF10 65.2 80.4
4485-HF12 46.3
4485-HF15
4486-HF7 97 122 138
4489-HF5 137 160
29
Dive-Profile 22 24 25 28 30 32 35 37 40 42 45 55
4489-HF6 87.7 116
4489-HF7 92 118
4490-HF4 72.1 79.1 91.3 95.8 4491-HF1 27.4 41.3 4491-HF4 146 183
4491-HF5 125 130
4491-HF6 110
4491-HF7 90 112
4562-M1-HF1 74.7 81.5 94.0 99.9 111.0 4562-M1-HF2 75.2 86.6 95.7 105.7 113.0 4562-M1-HF6 68.8 77.5 89.0 95.8 104.5 4563-M6-HF3 34.0 15.0 4564-M27-HF1 70.2 104.0 4564-M27-HF2 107.6 102.0 4564-M27-HF3 74.0 88.0 4568-INS1-HF1 78.6 88.6 102.3 108.6 115.0 4568-INS1-HF2 81.3 90.0 98.1 102.6 103.9 4568-INS1-HF4 95.0 96.7 4569-M14-HF2 52.1 62.3 4569-INS1-HF1 110.1 118.0 4569-INS1-HF3 95.0 116.0 4569-INS1-HF4 119.4 151.3 4569-M3-HF1 49.8 58.0 4571-M4-HF3 105.0 129.0 4573-M24-HF4 78.2 78.6 82.3 82.7 86.5 4562-M1-HF3 68.0 76.5 82.5 91.5 98.5 4562-M1-HF4 59.3 68.1 78.0 84.3 93.6 4563-M6-HF2 34.0 36.0 4569-M3-HF2 32.5 36.5 4483-HT5a 50 56 62 68
30
Dive-Profile 22 24 25 28 30 32 35 37 40 42 45 55
4485-HF 3.12 3.25 3.27 3.45
4485-HF 3.84 4.57 5.35 5.67
4485-HF16 53.6 68 72.1 93.3
4486-HT1 75 86 99
4486-HT2 94 115 129 142
4486-HF4 55 75 94
4486-HF5 64 88 109
4486-HF8 70 91 110
4486-HF9 73 96 118
4486-HF10 65 82 101
4486-HF11 54 70 84
4490-HF5 43.4 66.7 75.1 88.7 4490-HF8 67.1 84.1 4491-HF3 16 25
4492-HF1 51 61
4562-M1-HF5 32.1 36.7 48.8 54.3 64.8
4571-M4-HF1 55.0 63.2
4571-M4-HF2 45.3 49.7
4572-M27-HF3
4485-HF 2.99 3 2.97 2.97
4485-HF 2.99 3.02 2.99 3.01
4491-HF2 3.1 3.1
4562-M6-HF1 4.6 5.5
4564-HF1 15.5 22.0 22.5 27.0 28.6
4567-HF1 3.6 3.8
4569-M14-HF1 18.9 23.1
4569-YM-HF2 3.0 3.0
4569-HF1 2.9 2.9
31
References
Campbell BJ, Engel AS, Porter ML, and Takai K (2006) The versatile
epsilon-Proteobacteria: Key players in sulphidic habitats. Nature Reviews Microbiology4,
458–468.
Cline, JD (1969) Spectrophotometric determination of hydrogen sulfide in natural waters.
Limnology and Oceanography14, 454-458.
Costello, MJ (2006) Cryo-electron microscopy of biological samples. Ultrastructural
Pathology30, 361-371.
Dhillon A, Teske A, Dillon J, Stahl DA, Sogin ML (2003) Molecular Characterization of
Sulfate-Reducing Bacteria in the Guaymas Basin. Applied and Environmental
Microbiology69,2765-2772.
Dhillon A, Lever M, Lloyd KG, Albert DB, Sogin ML, Teske A (2005) Methanogen diversity evidenced by molecular characterization of methyl coenzyme M
reductase (mcrA) genes in hydrothermal sediments of the Guaymas Basin.
Applied and Environmental Microbiology.71,4592-4601.
Edmond JM, Von Damm K (1985) Chemistry of ridge crest hot springs. Biological
Society of Washington Bulletin 6, 43–47.
Einsele G, Gieskes JM, Curray J, Moore DM, Aguayo E, Aubry MP, Fornari D, Guerrero J, Kastner M, Kelts K, Lyle M, Matoba Y, Molina-Cruz A, Niemitz J, Rueda J, Saunders A, Schrader H, Simoneit B, Vacquier V (1980) Intrusion of basaltic sills
into highly porous sediments, and resulting hydrothermal activity. Nature283,
441-445.
Elsgaard L, Isaksen MF, Jørgensen BB, Alayse AM, Jannasch HW (1994) Microbial sulfate reduction in deep-sea sediments at the Guaymas Basin hydrothermal vent
area: Influence of temperature and substrates. Geochimica et Cosmochimica Acta
58, 3335-3343.
Gundersen, JK, Jørgensen BB, Larsen E, Jannasch HW (1992) Mats of giant sulphur
bacteria on deep-sea sediments due to fluctuating hydrothermal flow. Nature360,
454-456.
Jannasch HW, Nelson DC, Wirsen CO (1989) Massive natural occurrence of unusually
large bacteria (Beggiatoa sp.) at a hydrothermal deep-sea vent site. Nature342,
834-836.
Jørgensen BB, Zawacki LX, Jannasch HW (1990) Thermophilic bacterial sulfate
reduction in deep-sea sediments at the Guaymas Basin hydrothermal vents (Gulf
Kalanetra KM, Huston, SL, Nelson, DC (2004) Novel, attached, sulfur-oxidizing bacteria at shallow hydrothermal vents possess vacuoles not involved in respiratory nitrate
accumulation. Applied and Environmental Microbiology70,7487-7496.
Larkin JM, Henk MC (1996) Filamentous Sulfide-Oxidizing Bacteria at Hydrocarbon
Seeps of the Gulf of Mexico. Microscopy Research and Technique 33, 23-31.
Lloyd KG, Albert DB, Biddle JF, Chanton JP, Pizarro O, Teske A (2010) Spatial Structure and Activity of Sedimentary Microbial Communities Underlying a
Beggiatoa spp. Mat in a Gulf of Mexico Hydrocarbon Seep. PLoS One 5, e8738.
Ludwig W, Strunk O, Westram R, Richter L, Meier H, et al. (2004) ARB: a software
environment for sequence data. Nucleic Acids Research32, 1363-1371.
Martens CS, Albert DB, Alperin MJ (1999) Stable isotope tracing of anaerobic methane oxidation in the gassy sediments of Eckernförde Bay, German Baltic Sea.
American Journal of Science 299, 589–610.
McCollom TM, Shock EL (1997) Geochemical constraints on chemolithoautotrophic
metabolism by microorganisms in seafloor hydrothermal systems. Geochimica et
Cosmochimica Acta61, 4375–4391.
McHatton SC, Barry JP, Jannasch HW, Nelson DC (1996) High nitrate concentrations in
vacuolate, autotrophic marine Beggiatoa. Applied and Environmental
Microbiology62, 954-958.
Nelson DC, Wirsen CO, Jannasch HW (1989) Characterization of large, autotrophic
Beggiatoa spp. abundant at hydrothermal vents of the Guaymas Basin. Applied and Environmental Microbiology55, 2909-2917.
Nikolaus R, Ammerman JW, MacDonald IR (2003) Distinct pigmentation and trophic
modes in Beggiatoa from hydrocarbon seeps in the Gulf of Mexico. Aquatic
Microbial Ecology32, 85-93.
Prince RC, Stokley KE, Haith CE, Jannasch HW (1988) The cytochromes of a marine
Beggiatoa. Archives of Microbiology150, 193-196.
Pruesse E, Quast C, Knittel K, Fuchs B, Ludwig W, Peplies J, Glöckner FO (2007) SILVA: a comprehensive online resource for quality checked and aligned
ribosomal RNA sequence data compatible with ARB. Nucleic Acids Research35,
7188-7196.
Schulz HN, Jørgensen BB (2001) Big Bacteria. Annual Review of Microbiology55,
Teske A, Hinrichs K, Edgcomb V, Gomez A, Kysela D, Sylva SP, Sogin ML, Jannasch HW (2002) Microbial Diversity of Hydrothermal Sediments in the Guaymas
Basin: Evidence for Anaerobic Methanotrophic Communities. Applied and
Environmental Microbiology68, 1994-2007.
Teske A, Edgcomb V, Rivers AR, Thompson JR, Gomez A, Molyneaux SJ, Wirsen CO (2009) A molecular and physiological survey of a diverse collection of
hydrothermal vent Thermococcus and Pyrococcus isolates. Extremophiles13,
905-915.
Von Damm KL, Edmond JM, Measures CI, Grant B (1985) Chemistry of submarine
hydrothermal solutions at Guaymas Basin, Gulf of California. Geochimica et
Cosmochimica Acta49, 2221–2237.
Weber A, Jørgensen BB (2002)Bacterial sulfate reduction in hydrothermal sediments of
the Guaymas Basin, Gulf of California, Mexico. Deep-Sea Research Part I 49,
827–841.
Zopfi J, Kjær T, Nielsen LP, Jørgensen BB (2001) Ecology of Thioploca spp.: nitrate and
sulfur storage in relation to chemical microgradients and influence of Thioploca
spp. on the sedimentary nitrogen cycle. Applied and Environmental Microbiology