Making Molecules for Light-Driven Water Splitting
Michael R. Norris
“A dissertation submitted to the faculty of The University of North Carolina at Chapel Hill in partial fulfillment of the requirements for the degree of Doctor of Philosophy in the Department of Chemistry.”
Chapel Hill 2013
iii
ABSTRACTMICHAEL R. NORRIS: Making Molecules for Light-Driven Water Splitting (Under the direction of Professors Thomas J. Meyer and Joseph L. Templeton)
To meet growing global energy demand, methods to transform solar energy into chemical fuels are necessary. Photosynthesis provides a blueprint: using electrons from the photo-driven oxidation of water to generate reductive equivalents, which ultimately convert CO2 to carbohydrates. Key to any artificial photosynthetic device that attempts to mimic this process is
the light-driven water oxidation reaction, 2H2O + 4hν O2 + 4e-. Incorporation of a
chromophoric material for absorption of light and a catalyst for water oxidation are therefore required.
Several monomeric, single-site Ru polypryidyl catalysts have been investigated for this transformation. Electrochemical or CeIV oxidation results in homogeneous catalytic water oxidation. Catalytic rates and onset potentials were found to be highly tunable based on the ligand environment. Water oxidation catalysts built with first-row transition metals were also
investigated. Electrochemical studies of these complexes indicated complexes of Fe and Cu were catalysts for water oxidation at elevated pH.
iv
For artificial photosynthetic devices to operate in aqueous media, it is necessary to form stable anchors to metal oxide surfaces. New synthetic procedures for making phosphonic acid-derivatized bipyridine ligands and their Ru polypyridyl complexes were devised, and these routes allow easy access to important ligands and to complexes that can bind to metal oxide surfaces.
v
ACKNOWLEDGEMENTS
I must first acknowledge my advisors, Profs. Joseph L. Templeton and Thomas J. Meyer, without whom this thesis would not be possible. Tom and Joe provided countless hours of advice, leadership, and encouragement. They have not only taught me a wealth of chemistry, but also important life lessons that have shaped who I am.
I also must thank my friends that I have made during my time at UNC, including all the past and present memebers of the Meyer and Templeton groups. I would also like to especially thank Javier Concepcion for all the guidance and mentorship he provided during my tenure. He is an exceptional chemist and has been a great friend as well. I wish him all the best at his new position at Brookhaven National Lab.
I want to thank my family for all their help, support, and encouragement in all my endeavors. Finally, I have to thank Katie for everything she has done. I don’t think I could have stayed sane
vi
TABLE OF CONTENTS
LIST OF TABLES ... viii
LIST OF FIGURES ... ix
LIST OF SCHEMES ... xvii
LIST OF SYMBOLS AND ABBREVIATIONS ... xviii
CHAPTERS I. Using the Sun to Power the Planet ... 1
II. Water Oxidation by Single-Site Ruthenium Catalysts ... 17
III. First-Row Transition Metal Complexes of Multi-Dentate Ligands for Water Oxidation Catalysis ... 43
IV. Heteroleptic Polypyridyl Ruthenium Chromophore/Redox Mediator Complexes for Solar Conversion ... 61
V. Perylene Diimide as an Organic Dye and Semiconductor ... 80
VI. Synthesis of Phosphonic Acid-Derivatized Bipyridine Ligands and Their Ruthenium Complexes ... 97
VII. Redox Mediator Effect on Water Oxidation in a Ruthenium-Based Chromophore-Catalyst Assembly ... 126
VIII. Low Overpotential Water Oxidation by a Surface-Bound Ruthenium-Chromophore-Ruthenium-Catalyst Assembly ... 146
vii
APPENDICESA. Water Oxidation by Single-Site Ruthenium Catalysts ... 184
B. First-Row Transition Metal Complexes of Multi-Dentate Ligands for Water
Oxidation Catalysis ... 198
C. Heteroleptic Polypyridyl Ruthenium Chromophore/Redox Mediator Complexes for Solar Conversion ... 221
D. Perylene Diimide as an Organic Dye and Semiconductor ... 227
E. Synthesis of Phosphonic Acid-Derivatized Bipyridine Ligands and Their Ruthenium Complexes ... 232
F. Redox Mediator Effect on Water Oxidation in a Ruthenium-Based
Chromophore-Catalyst Assembly ... 236
G. Low Overpotential Water Oxidation by a Surface-Bound Ruthenium-Chromophore-Ruthenium-Catalyst Assembly ... 260
viii
LIST OF TABLES
Table 2.1. Water Oxidation Rate Constants and E1/2 (V vs NHE) Values for the RuIII/II, RuIV/III, and RuV/IV Couples in the Series [Ru(tpy)(LL)(OH2)]n+ in
0.1 M HNO3a ... 36
Table 2.2. As in Table 1 for the Series [Ru(LLL)(bpy)(OH2)]2+ ... 37
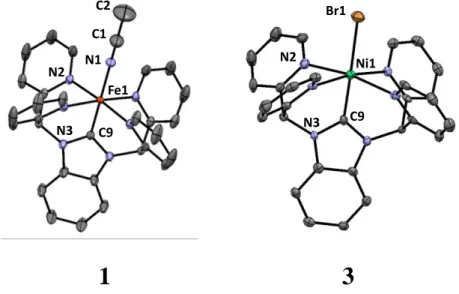
Table 3.1. Select Bond Distances and Angles for the Crystal Structures of 1 and 3. ... 51
Table 6.1. Summary of Spectroscopic and Electrochemical Properties of the Ru
ix
LIST OF FIGURES
Figure 1.1. Diagram of a typical dye-sensitized solar cell showing the relative energetics and electron transfer processes leading to photo-current generation: (1) Light absorption to generate an excited state, (2) rapid excited-state electron transfer into the conduction band of the metal oxide, (3) regeneration of the dye by I-, (4) electron migration through the metal oxide film, and (5) reduction of I3- at the counter electrode; and the competing, deleterious processes: (6) excited state decay without injection, (7) charge recombination of injected electrons with the oxidized dye, and
(8) back electron transfer to the oxidized redox electrolyte. ... 2
Figure 1.2. The crystal structure of the Photosystem II dimer at 1.9 Å resolution. Structure, protein subunits, and cofactors obtained and assigned by Umena
and coworkers. ... 4
Figure 1.3. S-state cycle for oxygen evolution in PS II first suggested by Kok et al.
showing five steps and 4e-/4+ transformation of water oxidation. ... 5
Figure 1.4. Latimer diagrams detailing the one-electron intermediates for the O2/H2O couple (top) and the CO2/CH4 couple at pH = 0 (bottom). The reported
redox potentials are vs. NHE. ... 7
Figure 1.5. Diagram of a dye-sensitized-photoelectrosynthesis cell (DSPEC) showing the relative energetics and electron transfer processes leading to water oxidation: (1) Light absorption to generate an excited state, (2) rapid excited-state electron transfer into the conduction band of a metal oxide, (3) oxidation of a molecular water oxidation catalyst (four cycles of these events leads to water oxidation), (4) electron migration through the metal oxide film; and CO2 reduction: (5) light absorption to generated an excited state, (6) hole injection into a metal oxide to create a reduced dye, (7) electron transfer from the reduced dye to a CO2 reduction catalyst (4 – 8 cycles required depending on CO2 reduced product), and (8) filling of the injected hole by electrons through the external circuit generated from
water oxidation... 9
Figure 1.6. Conduction and valence band energies for some common wide band-gap semiconductors for application in DSPECs showing the relationship of the band energies to relevant couples for solar fuels production. Values for absolute band energies and band gaps are reported in V vs. NHE at pH = 0
and are taken from literature. ... 10
x
Figure 2.2. 1H NMR spectra of (top) cis- and trans-[Ru(tpy)(Mebimpy)(CD3CN)]2+ reaction mixture in CD3CN, (middle) cis-[Ru(tpy)(Mebimpy)(CH3CN)]2+. in D2O, and (bottom) trans-[Ru(tpy)(Mebimpy)(H2O)]2+ in MeOD. ... 33
Figure 2.3. ORTEP structure at the 30% probability level of trans -[Ru(tpy)(Mebimpy)(OH2)]2+ cation as the ClO4- salt (right) and cis -[Ru(tpy)(Mebimpy)(CH3CN)]2+ cation as the PF6- (left). H-atoms omitted
for clarity. ... 33
Figure 2.4. Representative cyclic voltammograms for monomeric catalysts in 0.1 M HNO3 with 1.0 mM complex with a glassy carbon working electrode, Ag/AgCl reference electrode, and Pt counter electrode. CVs were taken
with a scan rate of 10 mV/s and potentials are reported vs NHE. ... 34
Figure 2.5. Cyclic voltammograms for [Ru(tpy)(acac)(OH2)]+ in 0.1 M HNO3 with 1.0 mM complex using a glassy carbon working electrode, Ag/AgCl reference electrode, and Pt counter electrode. CVs show increasing catalytic current
with slower scan rates. ... 35
Figure 2.6. Plots of E1/2 vs pH for the RuIII/II, RIV/III, and RuV/IV couples of [Ru(Mebimpy)(bpy)(OH2)]2+ at a glassy carbon working electrode with I =
0.1 M and a scan rate of 100 mV/s. ... 35
Figure 2.7. Oxygen evolution/number of turnovers vs time plot for the addition of 30 equivalents of CeIV to 8.0 mL of 1.0 x 10⁻³ M
[Ru(MEbimpy)(bpy)(OH2)](OTf)2 in 0.1 M HNO3 at 298 K. ... 38
Figure 3.1. Penta-coordinate ligand sets featuring polypyridyl and carbene moieties synthesized in the literature that provide stable architectures for first-row
transition metals. ... 43
Figure 3.2. Ligand architectures and metal complexes studied in this report. Complexes 1 – 4 are new complexes, while 5 and 6 have been previously
synthesized, albeit without aqueous electrochemical characterization. ... 44
Figure 3.3. UV/vis spectra of 1 ([Fe(PY4bim)Cl]+, red), 2 ([Co(PY4bim)Cl]+, blue), 3 ([Ni(PY4bim)Cl]+, green), and 4 ([Cu(PY4bim)Cl]+, pink) in MeOH. 1 shows strong MLCT absorptions while the spectra for 2 – 4 consist of a
strong absorption ~275 nm. ... 48
Figure 3.4. 1H NMR spectrum of 1 in D2O/MeOD as [Fe(PY4bim)(OD2)]2+ with
xi
Figure 3.5. 1H NMR spectrum of 2 in CD3CN as a mixture of [Co(PY4bim)(OH2)]2+ and [Co(PY4bim)(CD3CN)]2+. In order to take the 1H NMR in CD3CN, the Cl- salt of 2 was dissolved in H2O and precipitated with NH4PF6,
giving [Co(PY4bim)(OH2)](PF6)2. ... 49
Figure 3.6. X-ray structure at the 30% probability level of 12+ as the PF6- salt (left) and
32+ as the Br- salt (right). H-atoms omitted for clarity. ... 50
Figure 3.7. Representative cyclic voltammograms for 1 ([Fe(PY4bim)(OH2)]2+, green), 2 ([Co(PY4bim)(OH2)]2+, pink), 3 ([Ni(PY4bim)(OH2)]2+, red), 4 ([Cu(PY4bim)(OH2)]2+, blue), and [PY4bim](Br) (black) in 0.1 M HNO3 with 1.0 mM complex with a glassy carbon working electrode, Ag/AgCl reference electrode, and Pt counter electrode. CVs were taken with a scan
rate of 100 mV/s and potentials are reported vs. NHE. ... 52
Figure 3.8. Cyclic voltammograms of 6 at 100 mV/s (green), 50 mV/s (blue), 25 mV/s (red), and 10 mV/s (black) in 0.1 M phosphate buffer (pH = 7.5) with 1.0 mM complex with a glassy carbon working electrode, Ag/AgCl reference
electrode, and Pt counter electrode. Potentials are reported vs. NHE. ... 52
Figure 3.9. Plot of E1/2 (V vs NHE) vs. pH for the FeIII/II and FeIV/III redox couples of 1
(I = 0.1 M; GC working electrode; scan rate = 100 mV/s). ... 53
Figure 3.10. Cyclic voltammograms of 1 at 100 mV/s scanning just past the FeIII/II potential (blue) and scanning into H2O oxidation (red) in 0.1 M phosphate buffer (pH = 7) with 1.0 mM complex with an FTO working electrode, Ag/AgCl reference electrode, and Pt counter electrode. Potentials are
reported vs NHE. ... 55
Figure 4.1. Ru(bpy)32+ and the nine targeted heteroleptic CRM complexes under
investigation. ... 62
Figure 4.2. UV/vis spectra of select complexes (2 and 9) and Ru(bpy)32+ for
comparison in CH3CN at approximately 0.05 mM. ... 70
Figure 4.3. CVs of 7 (black), 4 (red), 1 (blue), Ru(bpy)3 (green), and 3 (magenta) in CH3CN with 0.1 M nBu4NPF6 with 1 mM complex showing the
systematic potential differences of the RuIII/II couple across the series. ... 71
Figure 4.4. CVs of Ru(bpy)3 (black), 1 (red), 3 (green), and 7 (blue) in CH3CN with 0.1 M nBu4NPF6 with 1 mM complex showing the first three reduction
xii
Figure 4.5. Normalized emission spectra of Ru(bpy)3 and 1 – 9 in argon de arated
acetonitrile at room temperature. ... 73
Figure 5.1. Structure of the four PDI-based dyes synthesized and investigated in this
work. ... 82
Figure 5.2. UV/vis spectra of each step in the reaction to form assemblies 3 and 4 showing the addition of the absorptions of both the perylene dye and the of [Fe(tpy-PhNH2)2]2+. UV/vis spectra were taken by holding the thin-film area of the slide perpendicular to the spectrophotometer beam open to air
at 298 ± 3 K... 86
Figure 5.3. CV of 3 attached to TiO2 in 0.1 M HClO4 with a Ag/AgNO3 reference and
Pt mesh counter electrodes taken at 10 mV/s at 298 ± 3 K. ... 87
Figure 5.4. Full TA spectra of 1-TiO2 (A) at 20 ns (green) and 100 ns (pink) and 1 -ZrO2 (B) at 20 ns in 0.1 M HClO4 under Argon with a 4.6 mJ excitation at
450 nm at 298 ± 3 K. ... 88
Figure 5.5. Absorption – time traces comparing 1-ZrO2 (green, A) and 1-TiO2 (pink, A) for the first 10 µs and 1-TiO2 (B) for the first 400 µs in Ar-deaerated
0.1 M HClO4 at 298 ± 3 K. ... 88
Figure 5.6. Full TA difference spectra of 3-TiO2 (A) at 20 ns (green) and 100 ns (pink) and 4-TiO2 (B) at 20 ns (green), 100 ns (pink), and 1 µs (blue) in 0.1 M
HClO4 under Argon with a 4.6 mJ excitation at 450 nm at 298 ± 3 K. ... 89
Figure 5.7. UV/vis spectra of IA-TiO2 (orange), [Fe(tpy-PhNH2)2]2+ (in CH3CN, purple), 4-TiO2 (green), and an addition of IA and [Fe(tpy-PhNH2)2]2+ (blue). Molar absorptivities of IA and 4 were estimated from the molar
absorptivity of the soluble PDI unit of 4 in CH3Cl. ... 91
Figure 6.1. Structures of the six complexes synthesized and characterized in this study. Complexes with the methylene spacer are labeled “CP” followed by the number of functionalized bipyridines and with the ring directly functionalized by “P” followed by the number of phosphonate-substituted
ligands. ... 98
Figure 6.2. 1H and 31P NMR spectra in CDCl3 at 295 K of 4,4′-bis(diethyl phosphonomethyl)-2,2′-bipyridine showing the expected aromatic and
aliphatic resonances. ... 107
Figure 6.3. 1H NMR (top) and 31P NMR (bottom) in CDCl3 at 295 K of P showing
xiii
Figure 6.4. UV/vis absorption spectra for the RuP series (A: RuP (black), RuP2 (red), and RuP3 (blue)) and RuCP series (B: RuCP (black), RuCP2 (red), and RuCP3 (blue)) with an MLCT absorption appearing at ~460 nm for
each complex. ... 114
Figure 6.5. A) Cyclic voltammograms of RuP (black), RuP2 (red), and RuP3 (blue), B) square wave voltammograms of RuP (black), RuP2 (red), and RuP3 (blue), C) cyclic voltammograms of RuCP (black), RuCP2 (red), and RuCP3 (blue), and D) square wave voltammograms of RuCP (black), RuCP2 (red), and RuCP3 (blue) loaded on a planar FTO coated glass slide (1x10⁻¹⁰ mol/cm2) in 0.1 M HClO4 with a 100 mV/s scan rate at 298 ±
3 K. ... 115
Figure 6.6. 1H NMR spectra in D2O at 295 K for RuP (3, top), RuP2 (2, middle) and
RuP3 (1, bottom) showing the aromatic region of the spectra. ... 119
Figure 7.1. Chromophore-catalyst assembly 1 studied in this work and catalyst 2 that
has been previously reported. ... 127
Figure 7.2. Preparation of assembly 1 utlizing the selective bridging ligand. Synthesis of 1 is achieved through the use of microwave irradiation over the course
of 30 min. ... 130
Figure 7.3. 1H NMR of 1 in CD3CN at 298 ± 3 K. Methylene spacer shows as two roofed doublets between 4.65 and 5.0 ppm. Downfield doublet at 10.1 ppm is due to the o-proton of the pyridine in the [bim-py] ligand of the
catalyst. ... 131
Figure 7.4. X-Ray structure of the cation in trans-[(bpy)2Rua(4-Mebpy-4′-CH2bimpy)Rub(tpy)(CH3CN)](PF6)4 (1(PF6)4) with thermal ellipsoids shown at the 50% probability level. Hydrogen atoms have been omitted
for clarity. ... 131
Figure 7.5. UV/vis spectra of 1 (black), 2 (blue), [Ru(bpy)2(4,4′-Me2bpy)]2+ (green),
and the addition of 2 and [Ru(bpy)2(4,4′-Me2bpy)]2+ (red) in 0.1 M HNO3. ... 132
Figure 7.6. Cyclic voltammogram of 1 in 0.1 M HNO3, 0.5 M in KNO3 at 10 mV s-1 with a glassy carbon working electrode (0.07 cm2, red) and a square wave
voltammogram (blue) at 298 ± 3 K. ... 133
Figure 7.7. Pourbaix (E1/2 vs. pH) diagram of 1 in aqueous buffers (0.1 M phosphate, acetate, or borate with 0.5 M KNO3) vs. Ag/AgCl at 10 mV s-1 with a glassy carbon working electrode (0.07 cm2) and platinum wire counter
xiv
Figure 7.8. Oxygen appearance traces as measured with a Foxy fluorescence probe in the headspace over 10 ml solutions 0.1 mM in 1 (red) or 2 (blue) in 0.1 M
HNO3 with 30 equivalents of added CAN at 298 ± 3 K. ... 135
Figure 7.9. Spectrum of the catalytic “rest state” that comprises of a mixture of species after 30 eq of CAN were mixed with 6.5 x 10⁻⁵ M 1 in 0.1 M HNO3, and the initial spectrum (t = 1.2 s) taken after mixing (inset) showing a feature
for the [RuaIII-RubIII-OH2]6+ species with a band at 655 nm. ... 135
Figure 7.10. First order decay of CeIV as monitored at 347 nm during a hand operated syringe mixing experiment in which 30 eq of CAN were mixed with 6.5 x
10-5 M 1 in 0.1 M HNO3 (red points) and fit of the data (black trace). ... 136
Figure 7.11. Plot of the first order rate constants for CeIV consumption at different concentrations of 1 used to determine the second order rate constant for the
reaction. ... 137
Figure 7.12. Absorbance of 1 before mixing (black), and after complete consumption of CAN (1 eq, blue; 2 eq, brown; 3 eq, green; 4 eq, red; 10 eq, orange; and 30 eq, purple; only chromophore, dashed). After the CeIV was consumed, spectra were collected until a maximum absorption was reached (100 –
2500 s with longer times required for increasing CeIV). ... 140
Figure 8.1. Structure of chromophore-catalyst assembly with phosphonic acids to anchor to metal oxide surfaces (1) and solution-based assembly previously
studied (2). ... 147
Figure 8.2. Cyclic voltammogram (red) of 1 attached to FTO in 0.1 M HClO4 at a scan rate of 10 mV/s showing the oxidations of the catalyst and chromophore,
and square wave voltammogram (blue) of 1. ... 152
Figure 8.3. Pourbaix (E1/2 vs. pH) diagram of 1 on FTO in aqueous buffers (0.1 M phosphate or acetate with 0.5 M NaClO4) vs. NHE with 1 on FTO as the
working electrode and platinum wire counter electrode. ... 153
Figure 8.4. Diagram of the modified RRDE derivatized with nanoITO and loaded with
1. Oxygen produced at the modified disc is then detected at the ring... 154
Figure 8.5. CV of 1 on nanoITO coated glassy carbon disc on a RRDE by a dual potentiostat at a scan rate of 100 mV/s with a Ag/AgCl reference and
platinum wire counter electrode at 295 ± 3 K. ... 155
Figure 8.6. Dual electrode cyclic voltammogram of 1 anchored to the derivatized
xv
NHE (red). The current response at the ring (blue) is shown over the same
range at a potential of -0.017 V vs NHE at 295 ± 3 K. ... 156
Figure 8.7. Faradaic efficiency as a function of applied potential for 1 in a DECV
experiment at a 10 mV/s sweep rate. ... 157
Figure 8.8. Turn-over-frequency (TOF) vs. applied potential for electrocatalytic water oxidation with 1 on nanoITO on the disc of the RRDE in a DECV experiment showing the TOF calculated from both the disc current (red)
and the ring current (blue). These values are lower limits. ... 157
Figure 9.1. Diagram of 1 bound to TiO2. Upon excitation, the chromophore in 1 injects an electron into the conduction band of TiO2. This is followed by
hole-transfer oxidation of the catalyst. ... 164
Figure 9.2. UV/vis spectra of 1 (blue), 1 anchored to TiO2 (red), and a blank TiO2
slide (black) in 0.1 M HClO4 with slides held at a 45° angle to the beam. ... 169
Figure 9.3. UV/vis difference spectra from the starting [nanoITO-RuaII-RubII-OH2]4+ after a 30 s controlled potential electrolysis at the stated potentials. Negative absorption represents the lack of MLCT contributions from the
[nanoITO-RuaII-RubII-OH2]4+ as the RuII states are oxidized. ... 171
Figure 9.4. Transient absorption difference spectra taken after pulsed laser excitation of 1 on TiO2 in 0.1 M HClO4 at 295 K. A positive feature appears at 513
nm within 100 ns and reaches a maximum at 1.5 µs. ... 172
Figure 9.5. Kinetic traces of the bleach at 450 nm (green curve) and at 515 nm (pink curve) following 425 nm excitation at 3.3 mJ on a fully loaded TiO2 slide
of 1 in 0.1 M HClO4 at 295 K followed for 10 µs. ... 172
Figure 9.6. Kinetic traces at 515 nm (A) following 425 nm excitation at 3.2 mJ (blue curve), 1.5 mJ (pink curve), and 0.5 mJ (green curve) and (B) following 532 nm excitation at 5.6 mJ (green curve) and 0.5 mJ (pink curve) on a
fully loaded TiO2 slide of 1 in 0.1 M HClO4 at 295 K followed for 10 µs. ... 173
Figure 9.7. Transient absorption difference spectra taken after 425 nm excitation of pre-oxidized 1 on TiO2 in 0.1 M HClO4 at 295 K. The positive feature
appears at 513 nm within 100 ns and reaches a maximum at 1.5 µs. ... 174
Figure 9.8. Kinetic traces at 515 nm following 425 nm excitation at 3.3 mJ on a fully loaded TiO2 slide of pre-oxidized 1 (blue curve) and native 1 (pink curve)
xvi
Figure 9.9. Kinetic traces at 515 nm following 425 nm excitation at 3.3 mJ on a fully loaded TiO2 slide of pre-oxidized 1 (green curve), a 50% coverage slide of pre-oxidized 1 (pink curve), and a 50% coverage slide of 1 (blue curve) in
0.1 M HClO4 at 295 K followed for 10 µs. ... 175
Figure 9.10. Spectral deconvolution of the spectroelectrochemical data using SPECFIT/32 to elucidate the expected spectral features if the baseline is [MxOy-RuaII-RubIII-OH2]5+ and [MxOy-RuaII-RubII-OH2]4+ is formed in the
reaction. ... 176
Figure 9.11. Side-view (left) of RRDE apparatus with a Ti disc coated with the
nanoITO/TiO2 mesopourous material and 1, at Pt ring to detect oxygen, and a 532 nm laser illuminating the sample from the bottom, and (right)
the structure of 1 bound to TiO2/nanoITO-Ti disc. ... 177
Figure 9.12. Photolysis of 1 bound to a nanoITO/TiO2 modified Ti-disc in controlled potential RRDE experiment at pH = 4.6 (20 mM acetate buffer, 0.5 M LiClO4) showing the disc current (red) and ring current (blue) generated
under illumination. ... 178
Figure 9.13. Diagram of 1 bound to the new nanoITO/TiO2 hybrid material that was attached to the disc of an RRDE. The thin film of TiO2 allows for electron injection from 1 in the usual way, but the electron can be quickly removed as the path-length it has to travel to reach the conducting nanoITO is much
xvii
LIST OF SCHEMES
Scheme 2.1. Single-Site Water Oxidation Mechanism with CeIV as the Oxidant ... 18
Scheme 4.1. Synthesis of L1 by a Condensation Reaction. ... 69
Scheme 4.2. Acid Catalyzed Condensation Leading to L2 and L4. ... 69
Scheme 4.3. Friedländer Condensation to Synthesize L3, L5, L6, L7, and L9. ... 70
Scheme 5.1. Step-wise Solid-State Synthesis of PDI Assemblies on Metal Oxide Surfaces. ... 85
Scheme 6.1. Synthesis of 4.4′-bis(diethyl phosphonate)-2,2′-bipyridine by Two Routes ... 109
Scheme 7.1. Proposed Mechanism of CeIV Driven Water Oxidation by 1. ... 138
Scheme 7.2. The Redox Mediator Effect ... 141
Scheme 8.1. Origin of Redox Mediator Effect in CeIV-Driven Water Oxidation by 2. ... 148
xviii
LIST OF SYMBOLS AND ABBREVIATIONS
A area
cm centimeter
EPR electron paramagnetic resonance eV electron-volt
fs femtosecond
FTO fluoride-doped tin oxide
i current
IR infrared
ITO tin-doped indium oxide
K Kelvin
m meter
M molar
ms millisecond
NHE normal hydrogen electrode
nm nanometer
ns nanosecond
PDI perylene diimide
ps picosecond
s second
SCE saturated calomel electrode
TW terawatt
UV ultraviolet
V volt
vis visible
xix
Å angstrom
° or deg degrees
ε molar extinction coefficient
Γ surface coverage
µA microampere
µs microsecond
CHAPTER 1
Using the Sun to Power the Planet
Given the current state of global energy demand and the search for alternatives to fossil fuels, harnessing solar energy has become one of the current great challenges of science.1-3 The need for alternative energy is evident, with unprecedented CO2 emissions, growing population, and the depletion of fossil fuel resources. To power the future, an energy source must be abundant, inexpensive, and environmentally benign to be a viable option. Solar energy is an ideal candidate as it is an inexhaustible power source that provides 120,000 TW worldwide, enough to easily supply the current global energy demand of 17 TW (1 TW = 1012 J/s).4 A straightforward approach to tapping this resource is to convert solar energy directly into electricity.
This approach has given rise to intense investigation into photovoltaic (PV) cells and dye-sensitized solar cells (DSSCs) or Grätzel cells. In the most basic sense, these devices capture solar energy and use the absorbed photons to generate electron-hole pairs, which are directionally separated in order to generate current. Efficient devices must make use of a broad range of wavelengths of light with high quantum yield. To do this, DSSCs employ a large band-gap semiconductor material (typically TiO2, although ZnO,5-7 Nb2O5,8-10 and SrTiO3,11-13 among others14,15 have been studied) that is “sensitized” with a dye molecule to increase the amount of light that is absorbed.
2
metal oxide (2).16 After electron transfer into the conduction band of the metal oxide, the dye is left in an oxidized state, which is reduced by a redox mediator in solution (3), typically iodide or Co2+. This regenerates the dye to prepare it for another photon absorption. Meanwhile, the injected electron diffuses through the metal oxide to the back contact (electrode) (4) where it is run through an external circuit to generate current (electricity). The electron travels to the counter electrode (usually Pt) where it is used to reduce the oxidized redox mediator, I3- or Co3+ (5). Theoretically, the amount of current generated is equal to the thermodynamic energy difference between the Fermi level of the metal oxide and the redox mediator couple.17
2 1 3 4 5 TiO2
(S+/S) (S+/S*)
(I-/I 3-)
dye redox
electrolyte
counter electrode photoanode
e- e
-e -e -e -e -e -load 6 7 En ergy 8
Figure 1.1. Diagram of a typical dye-sensitized solar cell showing the relative energetics and electron transfer processes leading to photo-current generation: (1) Light absorption to generate an excited state, (2) rapid excited-state electron transfer into the conduction band of the metal oxide, (3) regeneration of the dye by I-, (4) electron migration through the metal oxide film, and (5) reduction of I
3
The success of DSSCs lies in the inhibition of unfavorable back electron transfer (BET) events that cause a loss in efficiency. A deleterious process of excited state decay (6) is limited due to rapid injection, on the femto- to picosecond time-scale.16 BET from the electron in the conduction band of semiconductor to the oxidized dye (7) is also inhibited due to the rapid dye regeneration by the redox electrolyte.17,18 This process is one of many favorable kinetic phenomena that allow the Grätzel cell to work, and it is the main reason why the most effective redox electrolyte remains the I-/I3- couple. Even with favorable kinetics Grätzel cell efficiencies are limited by light-absorption, radiative and nonradiative decay pathways, and energy losses necessary for appropriate thermodynamics to drive electron injection and dye regeneration. DSSCs have also been limited by the small variety of viable redox electrolytes, which in turn limit the maximum amount of voltage that can be generated by the cell.
A limitation of all photon-to-current devices is the inherent diffuse and intermittent nature of the sun. Even in areas that receive little to no rain or cloud cover, the diurnal nature of sunlight means any one area will only be illuminated ~8 hours/day. Additionally, the need for powering planes, trains, and automobiles require mechanisms for solar energy storage, as over 80 % of current energy use comes from non-renewable fossil fuels.19 For this reason, it becomes attractive to use solar energy to generate liquid fuels. The harnessing of solar energy to generate fuels is not a new idea; in fact, it has been in practice for 2.4 billion years. Photosynthesis is a large-scale, well tested and effective method of harvesting and storing solar energy. The overall efficiency of photosynthesis to generate useful fuels for human consumption is low, however, due to the myriad of peripheral (and not so peripheral) processes that green plants must power (e.g. growth and reproduction). It would be useful, however, to understand how photosynthesis works in order to simplify it to its most basic interpretation, and then extract the main concepts for implementation in a more direct light-to-fuels device.
4
production of fuels begins by absorbing energy in the form of sunlight. On such a large and worldwide scale, the most accessible source of electrons is water. Green plants thus take energy from the sun, use it to oxidize water, then use the electrons and protons generated from the reaction (Equation 1.1) to eventually reduce CO2 to carbohydrates. These reactions are incredibly demanding; the water oxidation half of the equation alone requires transfer of 4e- and 4H+ and has a ΔG° of 1.23 eV. In order to achieve water oxidation, plants couple antenna systems used to
efficiently gather light at wavelengths available in the environment, then transfer the excitation energy into a reaction center known as the oxygen evolving complex (OEC) which resides in Photosystem II (Figure 1.2.)
2H2O O2 + 4H+ + 4e- (Eq. 1.1)
Figure 1.2.20 The crystal structure of the Photosystem II dimer at 1.9 Å resolution. Structure, protein
5
Single electron activation of the OEC in Photosystem II occurs via the Kok cycle which is a set of step-wise single-photon-absorption, single-electron-transfer events that remove the required 4e- and 4H+ (Figure 1.3).21 These reductive equivalents are then transported by a series of redox couples, and are eventually used to synthesize adenosine triphosphate (ATP) by ATP synthase, and niotinamide adenine dinucleotide phosphate (NADPH) by Photosystem I. The entire system is carefully tuned energetically so that all electron transfers and reactions (other than photon absorption) are exergonic, and tuned kinetically to drive the catalyst centers at optimal rates to avoid high-energy and reactive intermediates. Photosynthesis also includes protective mechanisms to prevent damage from excess light, but the reaction is still so demanding that the OEC is regenerated every 30 minutes. Remarkably, chemical energy is produced from solar energy, and then, by a second reaction, the ATP and NADPH are used to reduce CO2 to carbohydrates in the Calvin cycle in Photosystem I. These two Photosystems are able to store 4.56 eV per cycle in the two photogenerated NADPH molecules in addition to seven equivalents of ATP with 7.5 kcal/mol of stored energy each.22
6
In Photosystem I, electrons from the OEC are transported through a series of electron-transfer mediators, and are supplied to a chlorophyll, P700, which undergoes photon absorption and reductive quenching to enhance the reducing strength of the system. This second photon absorption is necessary to generate enough redox potential to reduce NADP+ to NADPH, the second component, (along with ATP from ATP synthase in Photosystem II), needed for the fixation of CO2 through the Calvin cycle. This completes the overall conversion of sunlight, water, and CO2 into carbohydrates (Equation 1.2).
6CO2 + 6H2O + 24hν C6H12O6 + 6O2 : ΔG°′ = 29.1 eV, n = 24 (Eq. 1.2)
Photosynthesis relies on many carefully balanced factors, and these factors are important to consider when designing artificial photosynthetic systems. Artificial photosynthesis is attractive because it provides a way to generate fuel from abundant sunlight. However, a practical device will require that the complicated nature of photosynthesis be simplified and streamlined. The most important design schemes for an artificial photosynthetic device come from poignant lessons learned from the biological blueprint. An artificial photosynthetic fuel production system requires chromophore/redox mediator (CRM) complexes to harvest sunlight and generate electrochemical potential, catalysts for water oxidation, and catalysts for either H+ or CO2 reduction. Not only will a successful system require the careful design of components, but also clever systems engineering that will need to incorporate important design features, such as visible light absorption, rapid and long-range charge separation, Proton-Coupled Electron Transfer (PCET) to avoid high energy intermediates, and catalyst turnover frequencies > 1s-1 to keep up with the solar flux.
7
photosynthesis is challenging because it requires the integration of multiple chemical functions in a stable chemical architecture. For this reason, progress in artificial photosynthetic systems has been slower to develop than the technologies for direct sunlight-to-electricity conversion. Just as in natural photosynthesis, it is desirable to reduce CO2 to fuels in artificial photosynthesis, with electrons coming from the oxidation of water. Unlike natural photosynthesis, however, reducing the CO2 to methane or methanol, as opposed to carbohydrates, would be more easily integrated into current energy infrastructure. The half reactions are shown in Equations 1.3 and 1.4.
2H2O + 4hν O2 + 2H2 (Eq. 1.3)
2H2O + CO2 + 8hν 2O2 + CH4 (Eq. 1.4)
O2 HO2 H2O2 H2O
OH
H2O+
-0.13 V 1.50 V 1.23 V
0.72 V 2.8 V
2.9 V
CO2 HCO2H H2CO CH3OH
-0.11 V -0.03 V 0.03 V
0.17 V
CO2
CH4
0.24 V 0.58 V
Figure 1.4. Latimer diagrams detailing the one-electron intermediates for the O2/H2O couple (top) and the CO2/CH4 couple at pH = 0 (bottom). The reported redox potentials are vs. NHE.
8
that both the photochemical fuel-forming reactions and their subsequent recombination are slow under ambient conditions. The effect of these high energy intermediates is demonstrated in the Latimer diagrams in Figure 1.4. Both half reactions must therefore be catalyzed and involve PCET reactions if they are to occur at appreciable rates. The desiging of catalysts for the multi-electron, multi-proton transformations associated with artificial photosynthesis is a significant challenge. Light-driven, single-electron activation of multi-electron catalysis with accessible electron-proton transfer (EPT) pathways must be available to avoid the high energy intermediates.
An approach to simplifying photosynthesis into manageable synthetic components is to separate the half-reactions at discrete electrodes in an electrochemical cell (Figure 1.5). The potential necessary for the reactions is supplied by sunlight.29 This Dye-Sensitized-Photoelectrosynthesis Cell (DSPEC) design simplifies integration of these two complex multi-electron multi-proton reactions. The two half reactions are connected by multi-electron flow through an external circuit in order to maintain charge neutrality. This design requires stable interfacial links to attached molecules and molecular assemblies, and the links must support facile electron transfer to and from the electrode or semiconductor surface.
9
Careful attention to energetics, materials, and rates is necessary with a delicate balance of properties required for successful light-driven reactions. First, the metal oxide must be transparent (have a large band-gap), be a semiconductor with a discreet conduction band (CB) energy, and that CB must be energy-matched to the excited state of the CRM (exited state reduction potential of CRM must be more negative than the CB). Several metal oxides that have been studied for a possible photoanode material are shown in Figure 1.6, with TiO2 being the most prominent and well-studied. The CRM molecule must also have specific properties; (1) absorption of visible light, (2) an excited state reduction potential able to inject electrons, and (3) an oxidation potential capable of driving the water oxidation reaction. Finally, the molecular catalyst must be able to oxidize water at the potential provided by the CRM and turn-over on a timescale that is competitive with BET processes.
2 1 3 4 5 TiO2
(S+/S) (S+/S*)
(Catox) dye H2O ox
catalyst photocathode
photoanode
8e- 8e
-8e -8e -e -8e -load En ergy
2H2O
O2 Water Oxidation 8H+ 4H+ NiO 7 6
(S+/S) (S+/S*) (Catred)
dye CO2red catalyst
CO2 2H2O
CH4 8e
-e
-8
PEM
Figure 1.5. Diagram of a dye-sensitized-photoelectrosynthesis cell (DSPEC) showing the relative energetics and electron transfer processes leading to water oxidation: (1) Light absorption to generate an excited state, (2) rapid excited-state electron transfer into the conduction band of a metal oxide, (3) oxidation of a molecular water oxidation catalyst (four cycles of these events leads to water oxidation), (4) electron migration through the metal oxide film; and CO2 reduction: (5) light absorption to generated an excited state, (6) hole injection into a metal oxide to create a reduced dye, (7) electron transfer from the reduced dye to a CO2 reduction catalyst (4 – 8 cycles required depending on CO2 reduced product), and (8) filling of the injected hole by electrons through the external circuit generated from water oxidation.
10
metal oxides have insufficient CB energies to reduce CO2 directly (Figure 1.6). Metal oxides that do have strongly reducing CB energies like ZrO2 will not work on the anode as the CB energies are too negative for any CRM complexes to efficiently inject electrons into. For this reason the design of the cathode borrows another principle from photosynthesis and employs a second CRM to boost the reducing power of the electrons. For the DSPEC device, this involves photon absorption by a CRM followed by hole-injection into a metal oxide (or reductive quenching by an electron in the valence band of the metal oxide). Reductive quenching of a CRM can lead to strongly reducing materials with potentials for Ru-polypyridyl dyes of -1.2 V vs. NHE. Most of the semiconductor literature is a result of studies of DSSCs, rather than DSPECs, so few materials are known for this application, although research efforts are increasing. NiO is one of the materials best suited for this purpose. It is also shown in Figure 1.6. The photocathode of the DSPEC has the same inherent demands placed on the molecular assembly. Luckily, given the modular nature of the device, the two electrodes for water oxidation and CO2 reduction may be studied independently to find the optimal design, and then be combined in an overall working device. 4.0 3.0 2.0 1.0 0.0 -1.0 -2.0 -3.0 V vs. N H E (at p H =
0) ZrO2
KTaO3 SrTiO3 TiO2
SnO2
NiO
H+/H 2
O2/H2O
CO2/CH4(pH 7)
5.0eV 3.4eV 3.2eV 3.0eV 3.8eV
3.6eV
11
Research is needed to design molecular assemblies for both photocathodes and photoanodes capable of these demanding transformations. Ubiquitous to any device design, however, where fuel is produced from protons or CO2 is water oxidation at the photoanode. This dissertation focuses on the design and synthesis of a molecular assembly capable of light-driven water oxidation for use in the anode of a DSPEC. This may be coupled with proton or CO2 reduction to generate fuels. The following chapters will focus on several topics relevant to the design principles of a molecular assembly for light-driven water oxidation.
Chapter 2 – Water Oxidation by Single-Site Ruthenium Complexes.
Investigations into Ru polypyridyl complexes for water oxidation have led to a family of catalysts with properties that can be tuned based on careful control of ligand environments. The control of catalyst properties is important for catalysts that operate under necessary conditions for a photoanode application.
Chapter 3 – First-Row Transition Metal Complexes of Multi-Dentate Ligands for Water
Oxidation Catalysis.
With the success in studying Ru polypyridyl catalysts and the understanding of reaction mechanism afforded by studying complexes of Ru, we applied these design principles to the synthesis of first-row transition metal complexes for water oxidation. These studies led to important findings for applying first-row transition metals to water oxidation and resulted in the synthesis and characterization of an Fe complex that can catalyze water oxidation at pH = 7.
Chapter 4 – Heteroleptic Polypyridyl Ruthenium Chromophore/Redox Mediator Complexes
for Solar Conversion.
An important component in the photoanode is design of CRM complexes for photon absorption and electron injection. This chapter details controlling the properties of CRM complexes through careful ligand manipulation.
12
Although Ru complexes are excellent CRM materials, it is desirable to find organic molecules that could be used as sensitizers for large-scale applications. We have investigated an organic dye through transient absorption spectroscopy and show excited state charge separation and hole collection leading to a long-lived charge separated state.
Chapter 6 – Synthesis of Phosphonic Acid-Derivatized Bipyridine Ligands and Their
Ruthenium Complexes.
For a photoanode, it is important that the CRM or molecular assembly be attached to a metal oxide surface, and that attachment must be stable under solar irradiation and redox cycling. We have investigated and improved the synthesis of phosphonic acid-derivatized ligands for use in molecular assemblies that are stable anchors to metal oxides.
Chapter 7 – Redox Mediator Effect on Water Oxidation in a Ruthenium-Based
Chromophore-Catalyst Assembly.
Necessary for a photonanode is the synthesis of molecular assemblies that incorporate both a CRM and a catalyst. In this chapter we report one of the few examples of the successful synthesis of a molecular assembly incorporating these complexes and the enhanced ability of the assembly to catalyze water oxidation with rates 8X faster than the rates of the catalyst alone.
Chapter 8 – Low Overpotential Water Oxidation by a Surface-Bound
Ruthenium-Chromophore-Ruthenium-Catalyst Assembly.
Extending the work from the previous chapter with a CRM-catalyst molecular assembly, we derivatized the assembly with phosphonic acid groups for attachment to metal oxide surfaces. The assembly is an electrocatalyst for water oxidation and importantly is shown to begin catalysis at the potential required to oxidize the CRM.
Chapter 9 – Multiple Charge Build-Up Leading to Water Oxidation in a
13
14
REFERENCES(1) Meyer, T. J. Acc. Chem. Res.1989, 22, 163.
(2) Gust, D.; Moore, T. A.; Moore, A. L. Acc. Chem. Res.2009, 42, 1890.
(3) Youngblood, W. J.; Lee, S.-H. A.; Maeda, K.; Mallouk, T. E. Acc. Chem. Res. 2009, 42, 1966.
(4) Lewis, N. S.; Nocera, D. G. Proc. Natl. Acad. Sci. U. S. A.2006, 103, 15729.
(5) Qurashi, A.; Hossain, M. F.; Faiz, M.; Tabet, N.; Alam, M. W.; Koteeswara Reddy, N.
Journal of Alloys and Compounds2010, 503, L40.
(6) Chang, C.-J.; Kuo, E.-H. Colloids and Surfaces A: Physicochemical and Engineering Aspects2010, 363, 22.
(7) Yan, X.; Li, Z.; Zou, C.; Li, S.; Yang, J.; Chen, R.; Han, J.; Gao, W. The Journal of Physical Chemistry C2010, 114, 1436.
(8) Xia, J.; Masaki, N.; Jiang, K.; Yanagida, S. The Journal of Physical Chemistry C 2007,
111, 8092.
(9) Chen, S. G.; Chappel, S.; Diamant, Y.; Zaban, A. Chem. Mater.2001, 13, 4629.
(10) de Barros Filho, D.; Abreu Filho, P.; Werner, U.; Aegerter, M. Journal of Sol-Gel Science and Technology1997, 8, 735.
(11) Lenzmann, F.; Krueger, J.; Burnside, S.; Brooks, K.; Grätzel, M.; Gal, D.; Rühle, S.; Cahen, D. J. Phys. Chem. B2001, 105, 6347.
(12) Hod, I.; Shalom, M.; Tachan, Z.; Rühle, S.; Zaban, A. The Journal of Physical Chemistry C2010, 114, 10015.
(13) Yang, S.; Kou, H.; Wang, J.; Xue, H.; Han, H. The Journal of Physical Chemistry C 2010, 114, 4245.
(14) Jose, R.; Thavasi, V.; Ramakrishna, S. Journal of the American Ceramic Society 2009,
15
(15) Bandara, J.; Weerasinghe, H. C. Solar Energy Materials and Solar Cells2005, 88, 341.
(16) Wenger, B.; Grätzel, M.; Moser, J.-E. J. Am. Chem. Soc.2005, 127, 12150.
(17) Grätzel, M. Inorg. Chem.2005, 44, 6841.
(18) Ardo, S.; Meyer, G. J. Chem. Soc. Rev.2009, 38, 115.
(19) Hammarström, L.; Hammes-Schiffer, S. Acc. Chem. Res.2009, 42, 1859.
(20) Umena, Y.; Kawakami, K.; Shen, J.-R.; Kamiya, N. Nature2011, 473, 55.
(21) Kok, B.; Forbush, B.; McGloin, M. Photochemistry and Photobiology1970, 11, 457.
(22) Gagliardi, C. J.; Westlake, B. C.; Kent, C. A.; Paul, J. J.; Papanikolas, J. M.; Meyer, T. J.
Coord. Chem. Rev.2010, 254, 2459.
(23) Barber, J. Current Opinion in Structural Biology2002, 12, 523.
(24) Flamigni, L.; Armaroli, N.; Barigelletti, F.; Balzani, V.; Collin, J.-P.; Dalbavie, J.-O.; Heitz, V.; Sauvage, J.-P. J. Phys. Chem. B1997, 101, 5936.
(25) Falkenström, M.; Johansson, O.; Hammarström, L. Inorg. Chim. Acta2007, 360, 741.
(26) Gust, D.; Moore, T. A.; Moore, A. L. Acc. Chem. Res.2000, 34, 40.
(27) Wasielewski, M. R. Chemical Reviews1992, 92, 435.
(28) Redmore, N. P.; Rubtsov, I. V.; Therien, M. J. J. Am. Chem. Soc.2003, 125, 8769.
(29) Alstrum-Acevedo, J. H.; Brennaman, M. K.; Meyer, T. J. Inorg. Chem.2005, 44, 6802.
(30) Kudo, A.; Miseki, Y. Chem. Soc. Rev.2009, 38, 253.
16
CHAPTER 2
Water Oxidation by Single-Site Ruthenium Catalysts
Reprinted in part with permission from Concepcion, J. J.; Jurss, J. W.; Norris, M. R.; Chen, Z.; Templeton, J. L.; Meyer, T. J. Inorg. Chem. 2010, 49, 1277 – 1279. Copyright 2010 American
Chemical Society.
INTRODUCTION
Well defined, molecular catalysts for the conversion of water to solar fuels are highly sought for their possible applications in the capture and storage of solar energy. An important half reaction in the utilization of solar fuels is the water oxidation reaction. In the past few years a multitude of transition metal polypyridyl catalysts have been reported for water oxidation.1-7 Some of the most active and robust catalysts are polypyridyl ruthenium complexes.2,6,8,9 Ru catalysts are promising for their high TOFs and TONs, as well as the ability to study and understand the mechanistic details of the water oxidation reaction, giving way to logical design advances and improvements to the activities of these catalysts.
In 2008, Concepcion et al. reported that [Ru(tpy)(bpm)(OH2)]2+ and [Ru(tpy)(bpz)(OH2)]2+ (tpy = 2,2′:6′,2′′-terpyridine; bpm = 2,2′-bipyrimidine; bpz = 2,2′-bipyrazine) act as single-site catalysts for water oxidation.8 Mechanistic studies revealed a well-defined, stepwise mechanism featuring proton-coupled electron transfer (PCET),10,11 a high-oxidation-state RuV=On+ intermediate, which undergoes O—O coupling with H2O, and a series of peroxidic intermediates. The sequence of reactions is illustrated in Scheme 2.1.
18
Does surface attachment affect the catalysis of these complexes? Importantly, are the lessons learned from single-site ruthenium complexes applicable to first-row transition metals? This last question will be dealt with in the next chapter.
We report here catalytic water oxidation by a series of single-site polypyridyl ruthenium complexes, both in solution and preliminary studies on metal oxide electrodes. The diversity of ligand environments, their influence on the rates and reaction thermodynamics, and the breadth of reactivity are remarkable. They point to a family of catalysts at the molecular scale with reactivity controllable by ligand variations that, by suitable modification, can be incorporated into molecular assemblies, nanostructured arrays, or at interfaces.
Scheme 2.1. Single-Site Water Oxidation Mechanism with CeIV as the Oxidant
EXPERIMENTAL
Materials and Methods.Distilled water was further purified using a Milli-Q Ultrapure water
19
purchased from Fisher Scientific and perchloric acid (70%, purified by redistillation, 99.999% trace metals basis) was purchased from Aldrich. 2,2′-bipyrimidine (97%) and RuCl3×3H2O were purchased from Aldrich and used as received. 2,2′-bipyrazine12 and [Ru(tpy)Cl3]13 were prepared as described in the literature. [Ru(tpy)(bpm)(OH2)](PF6)2 and [Ru(tpy)(bpz)(OH2)](PF6)2 (bpm is 2,2′-bipyrimidine and bpz is 2,2′-bipyrazine) were available from a previous study.8 All other reagents were ACS grade and used without additional purification.
Elemental analyses were conducted by Atlantic Microlab, Inc., Atlanta, Georgia. UV/Vis spectra and UV/Vis spectra vs. time were recorded on an Agilent Technologies Model 8453 diode-array spectrophotometer. Kinetic measurements were also performed on a Shimadzu UV-Vis-NIR Spectrophotometer Model UV-3600 by monitoring the disappearance of CeIV at 360 nm. Electrochemical measurements were performed on an EG&G Princeton Applied Research model 273A potentiostat/galvanostat. Voltammetric measurements were made with a planar EG&G PARC G0229 glassy carbon millielectrode, a platinum wire EG&G PARC K0266 counter electrode, and Ag/AgCl EG&G PARC K0265 reference electrode. 1H NMR spectra were recorded on Bruker Avance 400 MHz or Bruker 600 MHz spectrometers.
Oxygen evolution experiments. Oxygen measurements were performed with a calibrated O2
electrode (YSI, Inc., Model 550A) or with a fluorescence-based YSI ProODO O2 calibrated electrode. In a typical experiment, 30 equivalents of CeIV were added to stirred solutions containing 1.0-2.9×10⁻³ M ruthenium complex in 1.0 or 0.1 M HNO3. The air-tight reaction cell was purged with argon prior to the addition of the CeIV until the digital readout had stabilized. O2 evolution vs. time was recorded and the theoretical maximum was achieved ± 3 %.
Synthesis and characterization.
Ligands
20
mmol) in 40 mL of 85% phosphoric acid was stirred at ca. 230 ºC for 4 h. The dark green melt was poured into 1L of vigorously stirred cold water. After it was cooled to room temperature, the blue precipitate was collected by filtration, then slurried into 300 mL of hot aqueous sodium carbonate solution (10%). The resulting solid was filtered off and recrystallized from methanol to give a white solid. Yield: 5.77 g, 85%. 1H NMR (CDCl3): δ 8.42 (d, 2H), 8.05 (t, 1H), 7.86–7.89 (m, 2H), 7.44–7.48 (m, 2H), 7.33–7.41 (m, 4H), 4.25 (s, 6H, 2CH3). This ligand was pure by 1 H-NMR and was used without further purification.
2,6-bis(dimethylaminomethyl)pyridine (bDMAP). This ligand was prepared by a literature procedure.15
N-Methyl-N′-2-pyridylimidazolium hexafluorophosphate (MeIm-py+PF6-). This ligand
was synthesized by a modification of a literature procedure.16 A mixture of 2-bromopyridine (3.16 g, 20.0 mmol) and 1-methylimidazole (1.64 g, 20.0 mmol) was kept neat at 160 °C for 48 h. After cooling to ca. 50 ºC, acetone was added and the resulting solid was filtered and washed with acetone and ether. The solid was dissolved in water, filtered and added to aqueous ammonium hexafluorophosphate. Upon standing for 2 hours the solid was isolated by filtration and washed with water and ether. Yield: 4.27 g (70%). 1H NMR (CD3CN): δ 9.25 (s, 1H, NCHN), 8.59 (d, 1H), 8.08-8.12 (dt, 1H), 8.06 (t, 1H), 7.72 (d, 1H), 7.56-7.59 (dd, 1H), 7.54 (t, 1H), 3.96 (s, 3H, CH3). This ligand was pure by 1H-NMR and was used without further purification.
N-Methyl-N′-2-pyridylbenzimidazolium iodide (Mebim-py+I-). A mixture of
21
N-Methyl-N′-2-pyrazylbenzimidazolium iodide (Mebim-pz+I-). A mixture of
2-iodopyrazine (2.0 g, 9.7 mmol) and 1-methylbenzimidazole (1.28 g, 9.7 mmol) was kept neat at 135 °C for 72 h. After cooling to ca. 50 ºC, acetone was added and the resulting solid was filtered and washed with acetone and ether. Yield: 1.1 g (34%). 1H NMR (DMSO-d6): δ 10.59 (s, 1H, NCHN), 9.36 (s, 1H, pz), 8.97 (d, 1H), 8.88-8.90 (m, 1H), 8.47-8.49 (m, 1H), 8.17-8.19 (m, 1H), 7.79-7.85 (m, 2H), 4.23 (s, 3H, CH3). This ligand was pure by 1H-NMR and was used without further purification.
4,4′-Bis(diethylmethylphosphonate)-2,2′-bipyridine (4,4′-(H2O3PCH2)2-bpy). This ligand
was prepared by a literature procedure.17
Complexes
Ru(tpy)Cl3. This complex was synthesized by a literature procedure.13
Ru(Mebimpy)Cl3. This complex was synthesized as reported for Ru(tpy)Cl313 using Mebimpy
intead of tpy. In a typical experiment RuCl3×3H2O (1.00 g, 3.83 mmol) and Mebimpy (1.30 g, 3.83 mmol) were mixed in 400 mL of ethanol and the mixture refluxed for 3 hours. Upon cooling to room temperature, the brown solid was filtered, washed with ethanol until the ethanol came out clear and finally with ether. Yield: 1.6 g, 76%. This compound was used without further purification.
Ru(bDMAP)Cl3. This complex was synthesized by a modification of a literature procedure.15
RuCl3×3H2O (2.0 g, 7.66 mmol) and bDMAP (1.48 g, 7.66 mmol) were refluxed in ethanol (50 mL) for 3 hours. Upon cooling the green solid was filtered and washed with ethanol and ether. This solid was refluxed in 30 mL of concentrated HCl for ~ 30 min to yield the product as an orange powder that was collected by filtration and washed with water and ether. This compound was used without further purification.
((Mebimpy)(Cl)Ru)2Cl2. Ru(Mebimpy)Cl3 (500 mg, 0.91 mmol) was suspended in ethanol
22
washed with ethanol and ether to remove [Ru(Mebimpy)2]Cl2, which is soluble in ethanol. This impurity is the result of reduction of [Ru(Mebimpy)2]Cl3 that forms as a byproduct in the synthesis of Ru(Mebimpy)Cl3. Yield: 421 mg (90%). [((Mebimpy)(Cl)Ru)2Cl2] was used without further purification.
Ru(NCCH3)4(Mebim-py)(PF6)2. A suspension of Ag2O (1.32 g, 5.69 mmol) and
[Mebim-py](PF6] (1.01 g, 2.84 mmol) in acetonitrile (30 mL) was degassed with Ar and heated at 50 °C for 4 h. The warm reaction mixture was then filtered through Celite to remove unreacted Ag2O. To the filtrate was then added [(Bz)RuCl]2(Cl2) (0.71 g, 1.4 mmo) and the reaction was heated at reflux under Ar overnight. After cooling, the reaction mixture was filtered through Celite to remove AgCl and the acetonitrile was removed from the filtrate to give an orange residue. The residue was dissolved in water and an aqueous NH4PF6 solution was added to precipitate the product. The yellow solid was filtered and washed with water and Et2O. Yield: 1.23 g (57 %). 1H NMR (CD3CN): δ 8.97 (dd, 1H), 8.26 (d, 1H), 8.17 (m, 2H), 7.77 (dd, 1H), 7.57 (qd, 2H),
7.47 (t, 1H), 4.26 (s, 3H), 2.55 (s, 3H), 2.06 (s, 6H).
Ru(tpy)(bpy)(OH2)(ClO4)2. This complex was prepared as reported in the literature.18
trans-Ru(tpy)(Mebim-py)(OH2)(ClO4)2•2H2O. Ru(tpy)Cl3 (500 mg, 1.13 mmol) and
Mebim-py+I- (382 mg, 1.13 mmol) were suspended in ethyleneglycol and degassed by bubbling argon. Triethylamine (1.0 mL) was added with a syringe and the mixture was heated at 150 ºC for 3 hours. The crude product was isolated by addition of aqueous ammonium hexafluorophosphate and washed with water and ether. The brown solid obtained was dissolved in acetone and aqueous potassium nitrate was added. The solvents were removed by rotary evaporation and a small amount of 0.1 M HNO3 was added. The mixture was filtered to remove undissolved materials and the filtrate was loaded on a column (Sephadex LH-20) and eluted with 0.1 M HNO3. The yellow-orange band was collected and added to saturated aqueous sodium perchlorate. Upon standing in the refrigerator overnight crystals of Ru(tpy)(Mebim-py)(OH2)(ClO4)2•2H2O formed. The product
23
Found (Calc.) for C28H28Cl2N6O11Ru: C, 42.25 (42.22); N, 10.68 (10.55); H, 3.45 (3.54). 1H NMR (CD3CN, as Ru(tpy)(Mebim-py)(CD3CN)2+): δ 9.44 (d, 1H), 8.52 (d, 3H), 8.40 (d, 2H), 8.35-8.39 (dt, 1H), 8.27-8.31 (t, 1H), 8.16 (d, 1H), 7.99-8.03 (dt, 2H), 7.73-7.76 (m, 1H), 7.59 (d, 2H), 7.41-7.45 (dt, 1H), 7.35-7.39 (dt, 1H), 7.30-7.34 (m, 2H), 7.27 (d, 1H), 2.90 (s, 3H, CH3).
trans-Ru(tpy)(Mebim-py)(OH2)(Cl)2 (Microwave). Ru(tpy)Cl3 (500 mg, 1.13 mmol) and
Mebim-pz+I- (382 mg, 1.13 mmol) were suspended in 1:1 EtOH/H2O (30 mL) in a microwave vessel and degassed by bubbling nitrogen. Triethylamine (0.2 mL, 1.5 mmol) was added with a syringe and the mixture was heated in the microwave ramping the temperature to 165 ºC over 5 min, then holding the temperature at 165 ºC for 20 min. After cooling, the reaction mixture was reduced to ~5 mL on a rotary evaporator and the product was purified on a column of Sephadex LH-20. Yield: 373 mg (52 %). 1H NMR (CD3OD): δ 9.34 (d, 1H), 8.75 (m, 3H), 8.62 (d, 2H), 8.46 (dt, 1H), 8.38 (t, 1H), 8.31 (d, 1H), 8.11 (dt, 2H), 7.88 (dt, 1H), 7.67 (d, 2H), 7.44 (dt, 3H), 7.30-7.43 (m, 2H), 3.07 (s, 3H, CH3).
cis-Ru(tpy)(Mebim-py)(NCCH3)(Cl)2. Ru(NCCH3)4(Mebim-py)(PF6)2 (300 mg, 0.39 mmol)
and 2,2′:6′,2′′-terpyridine (92 mg, 0.39 mmol) were dissolved in 1:1 EtOH/H2O (30 mL), placed under argon, and heated at reflux overnight. A 1H NMR of this reaction mixture showed complete conversion to product, but an approximately 1:1 mixture of the cis and trans isomers. The mixture of products was purified on a Sephadex LH-20 column eluting with 1:1 MeOH/0.1 M HCl. The cis isomer eluted first as a bright orange band. Like fractions were combined and the solvent volume was removed to give an orange solid. Yield: 32 mg (13 %). 1H NMR (D2O as cis-Ru(tpy)(Mebim-py)(NCCH3)(Cl)2 with small amount of isomer as cis- Ru(tpy)(Mebim-py)(Cl)(Cl)): δ 8.49 (d, 2H), 8.27 (m, 3H), 8.04 (t, 2H), 7.63 – 7.79 (m, 6H), 7.48 (t, 1H), 7.39 (t, 1H), 7.12 (d, 1H), 7.02 (t, 2H), 6.69 (t, 1H), 4.37 (s, 3H, CH3), 3.17 (s, 3H).
trans-Ru(tpy)(Mebim-pz)(OH2)(NO3)(PF6)•2H2O. Ru(tpy)Cl3 (500 mg, 1.13 mmol) and
24
2 hours. The crude product was isolated by addition of aqueous ammonium hexafluorophosphate and washed with water and ether. The brown solid obtained was dissolved in acetone and aqueous potassium nitrate was added. The mixture was filtered to remove undissolved materials and the filtrate was allowed to stand for several days. The dark red crystals of Ru(tpy)(Mebim-pz)(OH2)(NO3)(PF6)•2H2O were isolated by filtration, washed with ice-cold water, ether and
air-dried. Yield: 450 mg, 49%. Anal. Found (Calc.) for C27H27F6N8O6PRu: C, 40.81 (40.25); N, 13.58 (13.91); H, 3.28 (3.38). 1H NMR (CD3CN, as Ru(tpy)(Mebim-pz)(CD3CN)2+): δ 10.2 (d, 1H), 9.72 (s, 1H, pz) 8.80 (d, 1H), 8.49 (d, 2H), 8.6 (d, 2H), 8.19-8.23 (t, 2H), 7.90-7.94 (t, 2H), 7.54 (d, 2H), 7.34-7.43 (m, 2H), 7.21-7.24 (dd, 3H), 2.96 (s, 3H, CH3).
trans-Ru(tpy)(MeIm-py)(OH2)(ClO4)2. Ru(tpy)Cl3 (500 mg, 1.13 mmol) and MeIm-py+PF6
-(345 mg, 1.13 mmol) were suspended in ethyleneglycol and degassed by bubbling argon. Triethylamine (1.0 mL) was added with a syringe and the mixture was heated at 150 ºC for 2 hours. Aqueous sodium perchlorate was added and the mixture was filtered. The filtrate was allowed to stand for several hours and a black microcrystalline solid formed. It was isolated by filtration, washed with ice-cold water and air-dried. Yield: 520 mg, 65%. Anal. Found (Calc.) for C24H22Cl2N6O9Ru: C, 40.50 (40.57); N, 11.72 (11.83); H, 3.12 (3.13). 1H NMR (CD3CN, as Ru(tpy)(MeIm-py)(CD3CN)2+): δ 9.36 (d, 1H), 8.49 (d, 2H) 8.39 (d, 2H), 8.26-8.30 (t, 1H), 8.21-8.25 (t, 1H), 8.00-8.06 (m, 3H), 7.90 (d, 1H), 7.70-7.74 (t, 1H), 7.60 (d, 2H), 7.34-7.37 (t, 2H), 6.85 (d, 1H), 2.71 (s, 3H, CH3).
Ru(tpy)(acac)(OH2)(PF6). This complex was prepared as reported in the literature.19
25
8.71 (d, 2H), 8.44-8.48 (td, 1H), 8.36 (d, 1H), 8.20-8.24 (t, 1H), 8.09-8.12 (td, 1H), 7.69 (d, 2H), 7.56-7.60 (td, 1H), 7.46 (d, 1H), 7.38-7.42 (t, 2H), 4.51 (s, 6H, 2CH3). This compound was used without further purification.
[Ru(Mebimpy)(bpy)(OTf)](OTf)•4H2O (OTf is the triflate anion). A mixture of
[Ru(Mebimpy)(bpy)(Cl)](Cl) (267 mg, 0.40 mmol) and AgOTf (218 mg, 0.85 mmol) in MeOH (20 mL) were stirred under argon at room temperature overnight. The silver chloride was removed by filtration using a bed of Celite and the filtrate was taken to dryness by rotary evaporation. Diethyl ether was added and the solid was filtered, washed with ether and air dried. Yield: 348 mg, 90%. Anal. Found (Calc.) for C33H33F6N7O10RuS2: C, 41.09 (40.99); N, 10.13 (10.14); H, 2.86 (3.44). 1H-NMR (CD3CN, 400 MHz, as [Ru(Mebimpy)(bpy)(CD3CN)](OTf)2) δ 10.10 (d, 1H), 8.70 (d, 1H), 8.67 (d, 2H), 8.49 (td, 1H), 8.36 (t, 1H), 8.28 (d, 1H), 8.07-8.10 (m, 1H), 7.72 (td, 2H), 7.69 (d, 2H), 7.44-7.48 (m, 2H), 7.41 (d, 1H), 7.13-7.17 (m, 2H), 7.07-7.10 (m, 1H), 6.20 (d, 2H), 4.44 (s, 6H, 2CH3).
[Ru(Mebimpy)(bpy)(OH2)](OTf)2. This complex was prepared in-situ dissolving
[Ru(Mebimpy)(bpy)(OTf)](OTf) in water. UV-Vis (0.1 M HNO3) λmax, nm (ε, M-1cm-1): 487
(12600), 358 (40460), 343 (34700), 315 (27150), 290 (46300), 253 (sh, 32000), 245 (34700). UV-Vis (0.01 M NaOH) λmax, nm (ε, M-1cm-1): 600 (sh, 3970), 518 (11620), 357 (39500), 342
(33050), 315 (24450), 292 (50500), 255 (sh, 26650), 241 (31770).

![Figure 2.3. ORTEP structure at the 30% probability level of trans-[Ru(tpy)(Mebimpy)(OH 2 )] 2+ cation as the ClO 4 - salt (right) and cis-[Ru(tpy)(Mebimpy)(CH 3 CN)] 2+ cation as the PF 6 - (left)](https://thumb-us.123doks.com/thumbv2/123dok_us/8284974.2194013/52.918.219.718.778.990/figure-ortep-structure-probability-mebimpy-cation-mebimpy-cation.webp)
![Figure 3.3. UV/vis spectra of 1 ([Fe(PY4bim)Cl] + , red), 2 ([Co(PY4bim)Cl] + , blue), 3 ([Ni(PY4bim)Cl] + , green), and 4 ([Cu(PY4bim)Cl] + , pink) in MeOH](https://thumb-us.123doks.com/thumbv2/123dok_us/8284974.2194013/67.918.206.663.142.503/figure-spectra-blue-bim-green-cl-pink-meoh.webp)