Does gaining health insurance improve access to appropriate sources of
primary care? Evidence from Medicaid Expansion in New York State
Isabel Caprise
Honors Thesis Economics Department
University of North Carolina at Chapel Hill
Thesis Advisor: Dr. Qing Gong Faculty Advisor: Dr. Jane Fruehwirth
April 2020
Approved:
Abstract
Acknowledgements
1. Introduction
The United States spends more money than any other country (in total and per capita) on healthcare—about 17.6% of national GDP, and the trend is continuing upward (Askin & Moore, 2019). Yet, we have some of the poorest health outcomes of the developed countries. The U.S. is ranked last in health outcomes and overall healthcare performance in a comparison of eleven developed countries (see Appendix A) (Schneider et al., 2017). Life expectancy is increasing at a slower rate than other countries, and the U.S. ranks poorly in infant and maternal mortality, preventative care, and chronic disease care (Askin & Moore, 2019; Schneider et al., 2017). Disparities within the United States in health status and health outcomes are seen across insurance status, race, income, gender, and location. Those in lower socioeconomic statuses suffer from poorer health status, which in turn increases the likelihood of diseases and chronic conditions.
support for the effect of coverage expansion on access to care, especially among the most vulnerable populations.
The research question I seek to address in this paper is: does healthcare coverage actually improve access to appropriate sources of primary care? One extremely inefficient care delivery model, and what this paper will focus on, is receiving primary care through a local emergency department. Currently, emergency departments are overutilized in the United States. One reason is that due to a shortage of primary care physicians, some patients have difficulty getting primary care through traditional avenues (New Findings Confirm Predictions on Physician Shortage, 2019). Further, emergency departments are bound under the Emergency Medical Treatment and Labor Act (EMTALA) to treat all patients regardless of their ability to pay (Emergency Medical Treatment & Labor Act (EMTALA), 2012). As a result, some patients (especially uninsured and Medicaid patients) seek primary or non-urgent care in emergency departments. This is likely because these two groups have the greatest difficulty seeing a primary care provider (further discussed in background section).
Previous literature has studied emergency department utilization through many different lenses. This paper focuses on classifying the nature of visits (emergent or primary-care natured) and examining how a change in insurance status alone affects the nature and frequency of visits. There have been similar studies performed in the past, however none have examined the effects of the Medicaid Expansion policy by studying emergency department data.
This paper intends to examine emergency department visit-level data before and after Medicaid Expansion in New York State to determine if gaining healthcare coverage through Expansion improves access to appropriate and efficient sources of care. Medicaid Expansion, which is discussed further in the background section, expanded the program from coverage of individuals with income at or below 100% of the Federal Poverty Level (FPL) to include individuals with income at or below 138% of the FPL. This policy change allows me to examine the isolated effects of gaining Medicaid coverage, assuming there are not any major changes in individuals aside from their qualification status for Medicaid.
codes of other payor status, to examine the effect. I utilize visit-level data from the Healthcare Cost and Utilization Project (HCUP) State Emergency Department Databases (SEDD) for the state of New York for the years 2012 through 2014. The findings indicate that patients who were previously uninsured and became covered as a result of Medicaid Expansion increase utilization of the emergency department for primary care-natured reasons, meaning the policy, while increasing access to care overall, may not have been effective in increasing access to appropriate sources of primary care.
The paper proceeds as follows: Section 2 describes the Affordable Care Act, access to care, and emergency department utilization; Section 3 reviews the existing literature on Medicaid Expansion and emergency department visits; Section 4 describes the data; Section 5 presents the empirical strategy; Section 6 presents results; Section 7 offers discussion; and Section 8 provides concluding remarks.
2. Background
2.1Affordable Care Act
In 2010, the Patient Protection and Affordable Care Act was signed into law by President Obama and implemented in 2014 with the goal of helping the uninsured population and providing coverage for more Americans. This was the largest healthcare transformation in the United States since the founding of Medicare and Medicaid in 1965. The uninsured population decreased by 8,516,600 lives (Health Insurance Coverage of the Total Population, 2019). Three provisions of the Act focused on coverage.
underwriting, and the elimination of annual or lifetime benefit limits. This made it easier for individuals to get private insurance.
The second was the individual mandate. This mandated citizens to obtain insurance, subject to exceptions, or face a tax penalty. Research indicates that there was little effect in increased coverage associated with the mandate (Frean et al., 2017). Additionally, the Supreme Court ruled in 2017 that the mandate was unconstitutional, and it was repealed January 1, 2019 (Kamal et al., 2018).
The third, and what this paper focuses on, was Medicaid Expansion. This policy expanded the Medicaid program to cover all adults with income at or below 138% of the federal poverty level. Medicaid is a federally- and state-funded program that is administered by the state. It was intended to provide coverage for the poor and medically needy or disabled. Previously, it provided coverage for individuals at or below 100% of the federal poverty level, pregnant women and children, and individuals with disabilities. It excluded a large group of low-income adults who were not below the federal poverty level. This population was too poor to afford private insurance or did not receive it through an employer but was not poor enough to receive coverage through the government program. The expansion of Medicaid was intended to provide coverage for this group of excluded people.
Expansion, enrollment began October 1, 2013, and coverage began January 1, 2014. By November 2014, nearly 25% of uninsured Americans had acquired healthcare coverage (Tolbert et al., 2019). As most Americans get health insurance either through their employer or a government program, changes in insurance status are often a result of employment changes. These might include being laid off from or hired to a company that offers employer-sponsored health insurance, or changes in income level which may qualify or disqualify an individual from a government program. These changes may be associated with or indicative of changes in health status. Using Medicaid Expansion as a natural experiment allows for changes in insurance status to be studied separately from other changes that may affect health status, as qualification status now changes without changes in income.
2.2Access to Primary Care
Many patients in the United States have difficulty seeing a primary care physician. One reason for this is the shortage of primary care physicians in the U.S. It is projected the shortage is expected to increase to 55,000 primary care physicians by 2032 (New Findings Confirm Predictions on Physician Shortage, 2019). Unlike specialists who see patients irregularly, primary care physicians typically see patients on a routine basis with scheduled appointments. This creates a finite construct which limits the number of patients a primary care physician can see in a year. With that consideration, patients of all payor statuses have some difficulty seeing a primary care physician, mostly reflected in long wait times for appointments.
practices cannot rely solely on government payors and need to find a balance of private and government payors to survive financially. A study examining determinants of physicians’ acceptance of new Medicaid patients found that physicians are less likely to accept patients if the physicians currently have no Medicaid patients, have ownership in the practice, work in a small practice, have a low relative geographic reimbursement, or are a primary care physician (Bradbury, 2015).
2.3Emergency Department Utilization
As previously mentioned, emergency departments are overutilized. This is often due to the difficulty or inability to seek care elsewhere, when appropriate. However, it is not only uninsured patients showing up frequently in emergency departments. Medicaid patients have long been shown to overutilize emergency departments. As of 2016, 38% of patients visiting the emergency department are Medicaid patients, while only 21% of the population are covered by Medicaid (Center for Disease Control, 2016). They consistently make up the largest proportion of admissions into emergency departments. If we assume that medical emergencies are random, then we would expect to see the same proportion of payor status in the emergency department as in the total population.
The two biggest obstacles to care for patients are cost and time. Patients experience a restriction due to cost that causes some to go without treatment—only 55-70% of Americans receive the care they need (Askin & Moore, 2019). Additionally, when patients have trouble seeking the care they need, they might go to a systematically inefficient site of care. Emergency departments are seen as a catch-all for symptoms and are required to provide care regardless of payor status. According to the 2016 National Hospital Ambulatory Medical Care Survey, the majority of patients (70.6% of visits) were seen by a physician in the emergency department within an hour (Center for Disease Control, 2016). This is much faster than the weeks or months it might take to schedule an appointment with a primary care provider. This survey also recorded triage status, which included Immediate, Emergent, Urgent, Semi-Urgent, and Non-Urgent. The largest portion of Non-Urgent visits was made by uninsured patients, followed closely by Medicaid patients. The two lowest urgency statuses (Semi-Urgent and Non-Urgent) account for 37.2% of visits for the uninsured and 33.6% of visits for Medicaid patients. This percentage is higher for both groups when compared to the privately-insured group (27.1%). However, it is possible that patients are assigned a certain urgency status or diagnosis code because the provider is taking the patient’s payor status into account, such as assigning a lower payor status patient a lower urgency status. As a result, the diagnosis may be endogenous to the payor status of the patient. While this is a concern, the data still provides motivation for this research question by demonstrating that uninsured and Medicaid patients are inefficiently utilizing the emergency departments.
3. Literature Review
Association (JAMA), Health Affairs, and other medical specialty journals. There is a more limited body of research found in economic journals. Studies published in medical journals tend to focus more on utilization and health outcomes while economic journals tend to focus on changes in healthcare coverage. This study will contribute to the existing literature by examining access to primary care through emergency department utilization using Medicaid Expansion as a natural experiment.
The existing literature focuses on the two waves of Medicaid expansion in the United States. The first was the gradual expansion of parental Medicaid eligibility in the late 1990’s, and the more recent expansion in 2014 was a result of the Affordable Care Act. Studies on these policies have focused on the effects on enrollment or specific treatment utilization. Hamersma & Kim (2013) found that expansion in the late 1990’s increased Medicaid participation, with no evidence of crowding out. This finding was supported by a more recent study that examined the effects of both private and public insurance provisions of the Affordable Care Act and found that 60% of the increased total coverage was explained by increased Medicaid enrollment while the other 40% was explained by exchange premium subsidies. Interestingly, increases in coverage were seen in both the newly-eligible as well as previously-eligible populations in both expansion and non-expansion states, indicating Medicaid Expansion had some spillover effects (Frean et al., 2017). Medicaid enrollment in expansion states has increased 34.4% since 2013 (MACPAC, 2019). These findings indicate that these two large Medicaid policy changes, including the recent Medicaid Expansion, were successful in increasing the number of Americans with healthcare coverage.
Expansion and treatment utilization, meaning as patients gain coverage, they start to receive more healthcare. Wen et al. (2017) examined the utilization of the buprenorphine drug for opioid use disorder treatment and found that Medicaid Expansion was associated with a 70% increase in Medicaid-covered buprenorphine prescription. Another study found a significant increase in orthopedic procedures, which are typically elective, received by Medicaid patients after expansion (Williamson et al., 2019). Gordon et al. (2020) found an increase in the number of postpartum outpatient visits and improved stability of postpartum coverage in states that expanded Medicaid. These studies suggest that healthcare coverage improves access to specialty care.
However, an increase in care received does not necessarily indicate equity in access to care across patients of different payor statuses. Studies have shown that providers make decisions about patients based on their payor status and financial incentives. Sirovich et al. (2008) found that physicians in high-spending regions saw patients more frequently and recommended more tests and interventions compared to physicians in low-spending regions. Similarly, Brekke et al. (2017) found that general practitioners in Norway increased their number of patient visits when there was an increase in the consultation fee. These findings indicate that physicians are more likely to see patients with better payor status and offer those patients more treatments, though arguably unnecessarily.
nursing homes shorten the stay of Medicaid patients if needed to allow for more profitable out-of-pocket payers. Overall, physicians do consider and respond to financial incentives, so Medicaid (as a low reimbursor) may be an impediment to patients receiving the appropriate healthcare.
while uninsured visits decreased 31.4% (Pines et al., 2016). This study did not examine primary care visits.
My study contributes to the existing literature by examining access to primary care through emergency department utilization. It adds to both bodies of Medicaid Expansion literature as well as emergency department utilization literature. Focusing on Medicaid Expansion as a policy change to highlight how access to primary care changes with insurance coverage, this study adds to previous studies by contributing findings from a more recent policy.
4. Data
This paper uses the Healthcare Cost and Utilization Project (HCUP) State Emergency Department Databases (SEDD) for the state of New York from 2012 to 2014. Each year of data covers the universe of emergency department visits across all hospitals in New York state. Each observation is an emergency department visit with information on the timing of the visit (by month), the patient (age, gender, race, location), the diagnoses, the treatment, the cost, and outcome of the visit. The patients are identified by a randomly-assigned, unique patient identification number, allowing me to track them over time.
The data set is constructed by selecting a random 5% sample of the patients who had any visit in 2012 and tracking them over the three years. As a result, there are fewer patients and visits in the data set for 2013 and 2014. Any observations with missing key identifiable information (unique patient ID, payor status, age, gender, race, etc.) are dropped from the data set. Patients over 65 are excluded as they are eligible for Medicare. Patients living in a ZIP code with median household income in the 3rd or 4th national quartile are excluded as well. This variable is the best
and control groups more similar. Table B1 in Appendix B displays the Federal Poverty Levels as well as 138% of the FPL (the new Medicaid eligibility cut off), and Table B2 displays the income ranges for the quartiles. Assuming the majority of households have at most six people, the eligibility cut off is within the 1st or 2nd quartile. If a patient does not show up in a certain month,
it is assumed they did not visit any emergency department, however it is possible they moved. International Classification of Diseases, 9th Edition (ICD-9) codes are used by all hospitals
injury, or unclassified, it is not assigned an urgency probability by the algorithm and thus is dropped from the data set (Allen et al., 2019).
Figure 1. NYU ED Algorithm Classification Tree
Source: NYU ED Visit Algorithm
The two lowest urgency categories (non-emergent and emergent/primary care treatable) are summed to obtain the probability that a visit is primary care-natured. If the summed probability is greater than 50%, the visit is classified primary care-natured (Gandhi & Sabik, 2014). Similarly, if the summed probability is less than 50%, the visit is classified emergent.
The group of interest is patients who were previously uninsured and then covered by Medicaid after January 1, 2014. Two dummy variables are created to capture both the change from uninsured to Medicaid as well as the change in time period (explained further in the methods section).
not visit the emergency department every month, so I run analysis on this data set as well for aggregated results.
Table 1 provides summary statistics for 2012-2014 patient characteristics including age, race, gender, payor status, patient location, and median household income for their ZIP code. Among the 78,415 patients in the data set, the majority were female, between the ages of 20 and 39, and Black. The largest payor was Medicaid, followed by private insurance and then self-pay (uninsured). While the total number of patients decreased each year due to selection, the percent of Medicaid patients increased nearly 10% from 2012 to 2014. The percent of patients with private insurance or self-pay both decreased, meaning these groups utilized the emergency department less consistently, even before Medicaid Expansion. The majority of patients live in ZIP codes in the first quartile of median household income and in a large metropolitan area. The percent of patients who visit the emergency department multiple times within the same year increases from 2012 to 2014. This is likely because of the data set construction. If an individual is showing up every year in the emergency room, they are likely to be “frequent flyers” and show up multiple times each year.
Table 1. Patient Characteristics by Year
2012 2013 2014
N % N % N %
Total Patients 69,446 26,719 23,628
Sex
Female 39,735 57.22 16,100 60.26 14,046 59.45
Male 29,711 42.78 10,619 39.74 9,582 40.55
Age group (Years)
Under 20 21,768 31.35 7,561 28.30 5,960 25.22
20 to 39 26,721 38.48 10,957 41.01 9,416 39.85
40 to 65 20,957 30.18 8,201 30.69 8,252 34.92
Race/Ethnicity
White 21,282 30.65 7,467 27.95 6,757 28.60
Black 20,314 29.25 9,142 34.22 8,237 34.86
Hispanic 17,936 25.83 7,015 26.25 5,829 24.67
Other 10,605 15.27 3,629 13.58 2,805 11.87
Primary Payor
Medicaid 31,914 45.96 14,403 53.91 12,882 54.52
Private insurance 19,246 27.71 5,928 22.19 5,121 21.67
Self-pay 13,212 19.02 3,888 14.55 3,215 13.61
Medicare 2,818 4.06 1,631 6.10 1,662 7.03
Other 2,192 3.16 840 3.14 734 3.11
No charge 65 0.09 29 0.11 14 0.06
Median Household Income National Quartile for Patient ZIP Code
First Quartile 41,852 60.27 15,330 57.37 13,827 58.52
Second Quartile 27,594 39.73 11,389 42.63 9,801 41.48
Patient Location
Large Metropolitan 50,138 72.20 19,291 72.20 17,738 75.07
Small Metropolitan 9,705 13.97 3,746 14.02 2,951 12.49
Micropolitan 7,084 10.20 2,784 10.42 2,191 9.27
Other 2,519 3.63 898 3.36 748 3.17
Chronic Conditions
None 48,650 70.05 17,189 64.33 14,278 60.43
One or more 20,796 29.95 9,530 35.67 9,350 39.57
Revisit
Yes 20,508 29.53 15,503 58.02 14,221 60.19
No 48,938 70.47 11,216 41.98 9,407 39.81
Source: Author’s calculations from HCUP SEDD.
Notes: Patients over 65 were excluded from the data set. Other Race/Ethnicity includes Asian or Pacific Islander, Native American, and Other. Other primary payor includes Worker’s Compensation, CHAMPUS, CHAMPVA, Title V, and other government programs. In 2012, the first quartile income range was $1-38,999, second quartile was $39,000-47,999. In 2013, the first quartile income range was $1-37,999, second quartile was $38,000-47,999. In 2014, the first quartile income range was $1-39,999, second quartile was $40,000-50,999. Large metropolitan areas include more than 1 million residents. Small
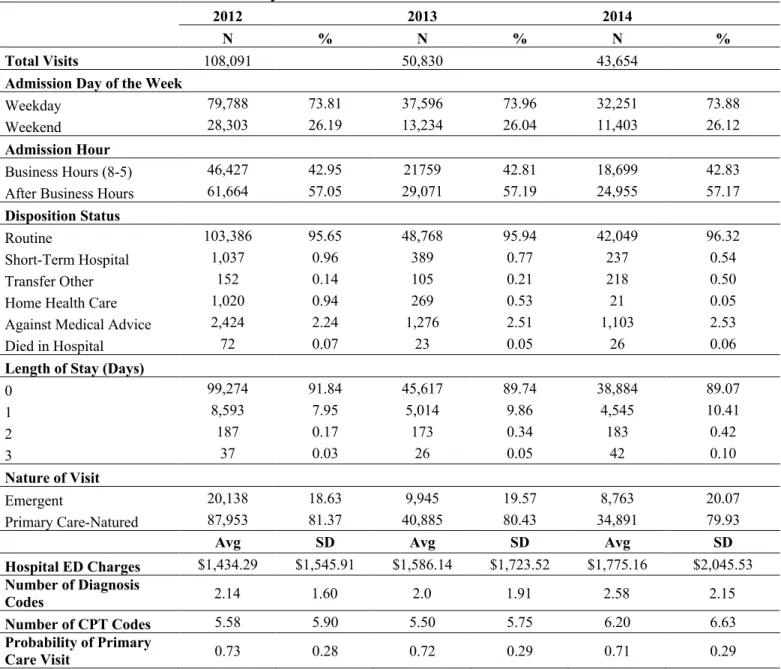
Table 2. Admission Characteristics by Year
2012 2013 2014
N % N % N %
Total Visits 108,091 50,830 43,654
Admission Day of the Week
Weekday 79,788 73.81 37,596 73.96 32,251 73.88
Weekend 28,303 26.19 13,234 26.04 11,403 26.12
Admission Hour
Business Hours (8-5) 46,427 42.95 21759 42.81 18,699 42.83
After Business Hours 61,664 57.05 29,071 57.19 24,955 57.17
Disposition Status
Routine 103,386 95.65 48,768 95.94 42,049 96.32
Short-Term Hospital 1,037 0.96 389 0.77 237 0.54
Transfer Other 152 0.14 105 0.21 218 0.50
Home Health Care 1,020 0.94 269 0.53 21 0.05
Against Medical Advice 2,424 2.24 1,276 2.51 1,103 2.53
Died in Hospital 72 0.07 23 0.05 26 0.06
Length of Stay (Days)
0 99,274 91.84 45,617 89.74 38,884 89.07
1 8,593 7.95 5,014 9.86 4,545 10.41
2 187 0.17 173 0.34 183 0.42
3 37 0.03 26 0.05 42 0.10
Nature of Visit
Emergent 20,138 18.63 9,945 19.57 8,763 20.07
Primary Care-Natured 87,953 81.37 40,885 80.43 34,891 79.93
Avg SD Avg SD Avg SD
Hospital ED Charges $1,434.29 $1,545.91 $1,586.14 $1,723.52 $1,775.16 $2,045.53 Number of Diagnosis
Codes 2.14 1.60 2.0 1.91 2.58 2.15
Number of CPT Codes 5.58 5.90 5.50 5.75 6.20 6.63
Probability of Primary
Care Visit 0.73 0.28 0.72 0.29 0.71 0.29
Source: Author’s calculations from HCUP SEDD.
as result of using the NYU ED Algorithm. Many of the observations that fell under mental health related, alcohol related, etc. were likely emergent. The average total charge per visit increases over the years, though the dollars have not been adjusted for inflation. The probability of a primary care-natured visit did not seem to significantly change across year.
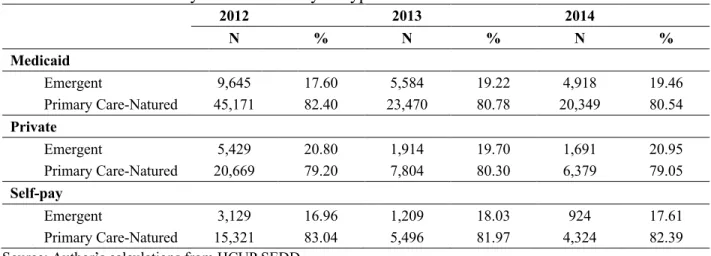
Table 3. Nature of Visit by Three Main Payor Type
2012 2013 2014
N % N % N %
Medicaid
Emergent 9,645 17.60 5,584 19.22 4,918 19.46
Primary Care-Natured 45,171 82.40 23,470 80.78 20,349 80.54
Private
Emergent 5,429 20.80 1,914 19.70 1,691 20.95
Primary Care-Natured 20,669 79.20 7,804 80.30 6,379 79.05
Self-pay
Emergent 3,129 16.96 1,209 18.03 924 17.61
Primary Care-Natured 15,321 83.04 5,496 81.97 4,324 82.39
Source: Author’s calculations from HCUP SEDD.
Table 3 displays the breakdown of the nature of the visit by payor type. Within and across payor types, the percent of primary care-natured visits are roughly the same. In 2012, Medicaid and uninsured patients had slightly more PCN visits than privately-insured patients.
probability of a visit being primary care-natured and the percent of primary care-natured visits each year are higher in the constructed data set. This is likely due to the observations that were dropped (that were likely emergent) as a result of using the NYU ED Visit Algorithm leading to a higher percentage of primary care-natured visits.
Table 4 displays motivating evidence about changes in payor status. The treatment group (*) is the population that changed from uninsured to Medicaid. If they were previously covered by Medicaid and then covered by Other (includes private, Medicare, etc.), it is possible they started receiving coverage through an employer or a family member. If they were previously covered by Medicaid and then uninsured, it is possible their income increased enough to no longer qualify for Medicaid, but they are not covered by or cannot afford private insurance. The table demonstrates that there is a large population of patients who became covered by Medicaid after Medicaid Expansion (nearly 40% of previously uninsured). This percent was slightly larger than the percent of people who gained Medicaid from a previously uninsured status in 2013 (about 34%). The majority of patients kept the same payor status after Medicaid Expansion, however the change from uninsured to Medicaid was the largest change in the data set.
Table 4. Patients’ Insurance Status Before and After Medicaid Expansion
After
Be
fo
re
Uninsured Medicaid Other Total
Uninsured (45.67%) 1,381 (38.29%) 1,158* (16.04%) 485 3,024
Medicaid (8.18%) 892 (84.01%) 9,159 (7.81%) 851 10,902
Other (6.71%) 402 (13.84%) 829 (79.46%) 4,761 5,992
Total 2,675 11,146 6,097 19,918
Source: Author’s calculations from HCUP SEDD
Figure 2 displays the number of visits (total and primary care-natured) by month for the year leading up to and after Medicaid Expansion (implemented January 1, 2014). There is a decrease in the total number of visits (due to selection as explained previously) and in the number of primary care-natured visits. The average number of visits was 4,236 per month for 2013 and 3,638 per month in 2014. The average number of primary care-natured visits was 3,407 per month in 2013 and 2,908 per month in 2014. It appears that the proportion of primary care-natured visits of the total number of visits remains relatively constant.
Figure 2. Number of Visits and Primary Care-Natured Visits per Month
Source: Author’s calculations from HCUP SEDD.
Notes: The number of total visits measures the number of emergency department admissions. The number of primary natured visits measures the number of emergency department admissions that were classified primary care-natured by the NYU ED Visit Algorithm. The figure displays visits for the year leading up to and the year after the implementation of Medicaid Expansion on January 1, 2014 (indicated by vertical line).
Figure 3 displays the percent of visits (total and primary care-natured) made by Medicaid patients for the year leading up to and after Medicaid Expansion. In 2013, the average percent of visits by Medicaid patients was 57.06% and increased slightly to 57.29% in 2014. The average percent of primary care-natured (PCN) visits by Medicaid patients in 2013 was 57.39% and also increased slightly to 58.34%. The dotted line appears to track the solid line very closely over the
0 1000 2000 3000 4000 5000 6000 Ja n-13 M ar-13 M ay-13
Jul-13 Sep-13Nov-13 Ja n-14
M ar-14
M ay-14
Jul-14Sep-14Nov-14
Nu m be r of Vi si ts Total Visits
two years, indicating that Medicaid patients are not disproportionately showing up for primary care-natured visits compared to emergent visits. However, there is a chance that Medicaid patients utilize the emergency department for primary care so frequently that the total number of visits by Medicaid patients is essentially the same as the number of PCN visits by Medicaid patients.
Figure 3. Percent of Visits and Primary Care-Natured Visits by Medicaid Patients
Source: Author’s calculations from HCUP SEDD.
Notes: Medicaid patients are those who have Medicaid as their primary payor. The percent of visits was calculated both for the total number of ED visits as well as the number of primary care-natured visits. The figure displays visits for the year leading up to and the year after the implementation of Medicaid Expansion on January 1, 2014 (indicated by vertical line).
Figure 4 displays the number of total visits and the number of primary care-natured visits by month by Medicaid patients. This figure looks similar to Figure 2, indicating the Medicaid population follows the same utilization trends as the total population. This figure also displays the differences in the number of total visits and the number of primary care-natured visits, supporting the interpretation of Figure 3, that Medicaid patients are not showing up disproportionately for primary care visits. The average number of visits by Medicaid patients was 2,421 per month in 2013 and 2,106 per month in 2014. The average number of PCN visits by Medicaid patients was 1,956 per month in 2013 and 1,696 per month in 2014.
40 45 50 55 60 65 Ja n-13 M ar-13 M ay-13
Jul-13 Sep-13Nov-13 Ja n-14
M ar-14
M ay-14
Jul-14 Sep-14Nov-14
Pe
rc
ent
Percent of Visits by Medicaid Patients
Figure 4. Number of Visits and Primary Care-Natured Visits per Month by Medicaid Patients
Source: Author’s calculations from HCUP SEDD.
Notes: Medicaid patients are those who have Medicaid as their primary payor. The number of total visits measures the number of emergency department admissions. The number of primary care-natured visits measures the number of emergency department admissions that were classified primary care-natured by the NYU ED Visit Algorithm. The figure displays visits for the year leading up to and the year after the implementation of Medicaid Expansion on January 1, 2014 (indicated by vertical line).
5. Empirical Model
I use a difference-in-difference strategy to examine the change in primary care-natured visits between payor types before and after Medicaid Expansion and to determine causality. The first difference in the model is the time period: before and after Medicaid Expansion (After). The second difference is the change in payor status (GotMedicaid) which represents a change from uninsured to Medicaid. The differences control for any variation in utilization seen between patients of all payor types and related changes. This model allows for any unobserved time-invariant characteristics in the data (e.g., health status or health habits) to be differenced out and any change in emergency department visits to be attributed to the policy change. The equation is as follows:
!!" = ##+ #$&'()*!"+ #%(,-(.)/0120/)!"+ #&(&'()* ∗ ,-(.)/0120/)!" + #'5!"+ 6!
+ 7!"
0 500 1000 1500 2000 2500 3000 3500 Ja n-13 M ar-13 M ay-13
Jul-13Sep-13Nov-13 Ja n-14
M ar-14
M ay-14
Jul-14Sep-14Nov-14
Nu m be r of Vi si ts
Total Visits by Medicaid
!!" is the outcome variable of interest, the utilization of emergency departments. Specifically, I construct six different measures of utilization: the number of monthly visits by an individual, the probability of a visit being primary care-natured (PCN), the number of monthly PCN visits, the number of monthly PCN visits during business hours, the number of monthly PCN visits outside of business hours, and the number of monthly emergent visits. I also aggregate the data at the yearly level creating six new dependent variables: the number of yearly visits by an individual, the average probability of a visit being PCN, the number of yearly PCN visits, the number of yearly PCN visits during business hours, the number of yearly PCN visits outside of business hours, and the number of yearly emergent visits. In total, there are 12 different outcome variables. The number of visits, the number of PCN visits, and the probability of a visit being PCN are used for the main results. The number of PCN visits during and outside of business hours and the number of emergent visits are used for supplemental results.
Afterit is an indicator variable where the value is equal to one if the patient visit occurs on or after January 1, 2014 and is equal to zero if the visits occurs before that date. GotMedicaidit is an indicator variable where the value is equal to one if the patient’s payor status changed from uninsured to Medicaid at any point in time and equal to zero for everything else. The interaction term is the combination of the two previous variables. This term captures the effect of gaining Medicaid as a result of the Medicaid Expansion policy. Xit is a vector of time-varying patient characteristic controls.
a
i is a vector of patient fixed effects.e
it is the error term, clustered at the patient level.b
1 captures the change in number of visits over time for all patients.b
2 captures the changethe treatment group relative to the control group. Again, the treatment group (those who gain Medicaid through Expansion) are compared to patients who look similar in terms of income (by limiting to low-income ZIP codes) as that is a proxy for insurance status and qualification status.
If there is a decrease in the number of primary care-natured visits by patients that gain coverage, I can assume they are now seeking primary care elsewhere. If it remains the same, newly-covered patients have not changed their utilization decisions. If there is an increase in utilization, then there is some other factor influencing site-of-care decisions.
I then corroborate the difference-in-difference results with a fixed effects model. This model allows me to assume that anything unobservable in the data stays unchanged over time within the same patient. With this assumption, any change in emergency department utilization patterns within the same patient is attributed to gaining Medicaid coverage. The fixed effects model is as follows:
!!" = ##+ #$(,-(.)/0120/)!"+ #%5!"+ 6! + 7!".
This model allows me to examine how the within-patient variation in visits is affected by gaining Medicaid. This model is also run with the same dependent variables as the previous model.
The GotMedicaidit indicator variable is defined the same way. Xit is a vector of time-varying patient characteristic controls.
a
i captures the unobserved time-invariant patient effect.b
1 captures the change in number of visits within an individual who gains Medicaid from uninsured status.Of these different methods, the two difference-in-difference models (with and without fixed effects) are of primary interest to examine the effect of the Medicaid Expansion policy on primary care-natured emergency department visits. These models capture the effect of receiving coverage as a result of the policy (through a change in qualification status) rather than simply the effect of receiving Medicaid coverage. The two models offer different interpretations of the results in terms of measuring variation within the sample or within an individual.
6. Results
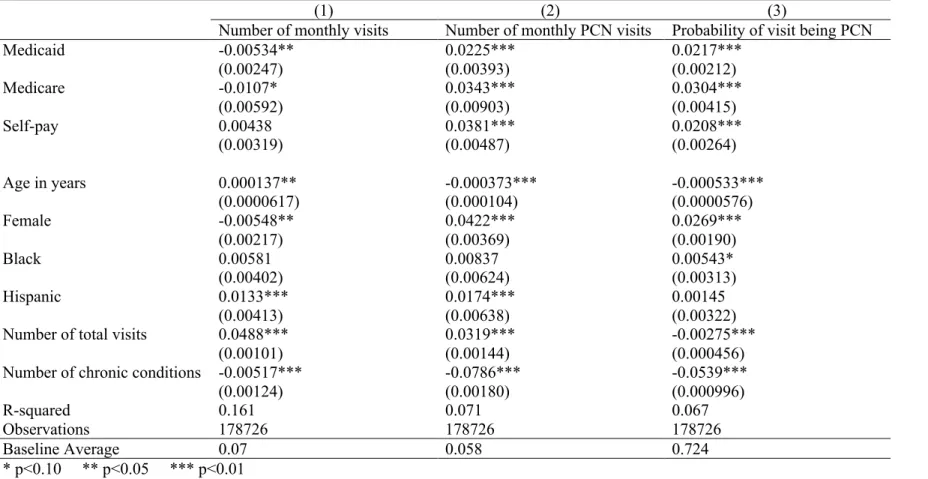
An ordinary least squares (OLS) regression is initially run to examine the basic effect of payor status on emergency department visits. This regression is run on the three monthly outcome variables (number of monthly visits, number of monthly primary care-natured (PCN) visits, and probability of a primary care-natured visit). Table 5 displays these results with private insurance as the reference payor status.1 Medicaid and Medicare patients have fewer monthly emergency
department visits compared to privately-insured patients. Uninsured patients have more monthly visits than privately-insured patients, but the effect is insignificantly estimated. All three payor status groups have more monthly primary care-natured visits and a higher probability of a visit being primary care-natured than the privately-insured group.
Table 5. OLS Regression by Payor Status: Private Reference
(1) (2) (3)
Number of monthly visits Number of monthly PCN visits Probability of visit being PCN
Medicaid -0.00534** 0.0225*** 0.0217***
(0.00247) (0.00393) (0.00212)
Medicare -0.0107* 0.0343*** 0.0304***
(0.00592) (0.00903) (0.00415)
Self-pay 0.00438 0.0381*** 0.0208***
(0.00319) (0.00487) (0.00264)
Age in years 0.000137** -0.000373*** -0.000533***
(0.0000617) (0.000104) (0.0000576)
Female -0.00548** 0.0422*** 0.0269***
(0.00217) (0.00369) (0.00190)
Black 0.00581 0.00837 0.00543*
(0.00402) (0.00624) (0.00313)
Hispanic 0.0133*** 0.0174*** 0.00145
(0.00413) (0.00638) (0.00322)
Number of total visits 0.0488*** 0.0319*** -0.00275***
(0.00101) (0.00144) (0.000456)
Number of chronic conditions -0.00517*** -0.0786*** -0.0539***
(0.00124) (0.00180) (0.000996)
R-squared 0.161 0.071 0.067
Observations 178726 178726 178726
Baseline Average 0.07 0.058 0.724
* p<0.10 ** p<0.05 *** p<0.01
Notes: An observation is a unique patient-month combination. PCN stands for primary care-natured. Payor status also includes Other and No charge groups. These are included in the regression but not reported. The baseline group for race is White. Asian/Pacific Island, Native American, and Other race are included as controls but not reported. Patient location, ZIP code, and the constant term are included but not reported. The standard errors clustered at patient level are
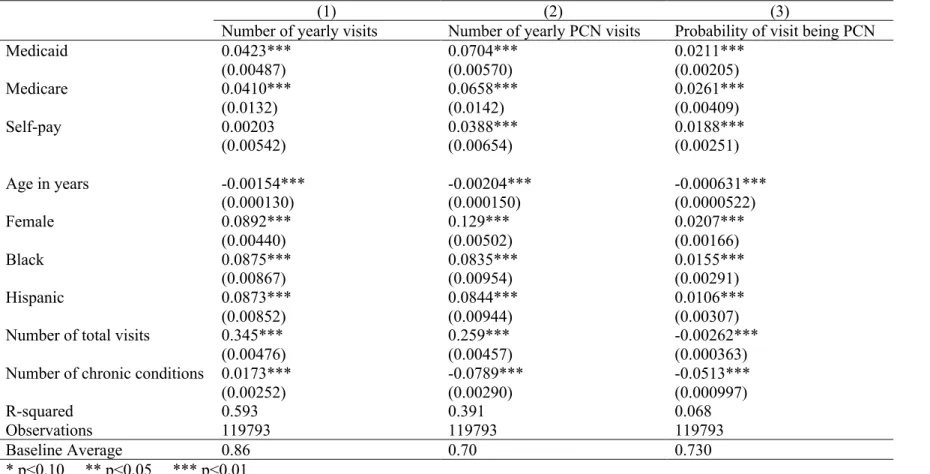
Table 6. OLS Regression by Payor Status: Private Reference (Yearly Aggregate)
(1) (2) (3)
Number of yearly visits Number of yearly PCN visits Probability of visit being PCN
Medicaid 0.0423*** 0.0704*** 0.0211***
(0.00487) (0.00570) (0.00205)
Medicare 0.0410*** 0.0658*** 0.0261***
(0.0132) (0.0142) (0.00409)
Self-pay 0.00203 0.0388*** 0.0188***
(0.00542) (0.00654) (0.00251)
Age in years -0.00154*** -0.00204*** -0.000631***
(0.000130) (0.000150) (0.0000522)
Female 0.0892*** 0.129*** 0.0207***
(0.00440) (0.00502) (0.00166)
Black 0.0875*** 0.0835*** 0.0155***
(0.00867) (0.00954) (0.00291)
Hispanic 0.0873*** 0.0844*** 0.0106***
(0.00852) (0.00944) (0.00307)
Number of total visits 0.345*** 0.259*** -0.00262***
(0.00476) (0.00457) (0.000363)
Number of chronic conditions 0.0173*** -0.0789*** -0.0513***
(0.00252) (0.00290) (0.000997)
R-squared 0.593 0.391 0.068
Observations 119793 119793 119793
Baseline Average 0.86 0.70 0.730
* p<0.10 ** p<0.05 *** p<0.01
month but more within a year than privately-insured patients with respect to the total number of
visits. However, Medicaid and Medicare patients have more monthly and yearly primary
care-natured visits than privately-insured patients.
Uninsured patients also visit the emergency department more than privately-insured
patients both in terms of total visits and PCN visits. It is important to note that the yearly effect is
not a mechanical translation of the monthly effect. For example, the yearly effect of Medicaid on
the number of PCN visits (0.0704) is smaller than the extrapolated monthly effect (0.27).
After documenting the effect of payor status on number of emergency department visits, I
now proceed to estimate the effect of the Medicaid Expansion policy. The results from the
difference-in-difference regression are displayed in Table 7. The number of monthly visits
decreases by 0.013 in the After group. The number of monthly PCN visits also decreases, though not significantly. This makes sense as there are fewer visits each year in this data set, displayed in
the summary statistics tables. While the coefficients in this table appear small, they are appropriate
in magnitude when compared to the baseline average. None of the results in the After x GotMedicaid row are significant, though all positive. This is the row of primary interest—the group that was uninsured and got Medicaid coverage through Medicaid Expansion. The results are
likely insignificant because most patients do not show up in the emergency department every
month. To get a better idea of what is happening, the difference-in-difference regression is run on
the yearly aggregated data set with results displayed in Table 8. Medicaid Expansion increases the
number of yearly visits by 0.231 and the number of yearly primary care-natured visits by 0.171 for
the treatment group, with the baseline average being 0.86 and 0.70, respectively. The probability
Table 7. Difference-in-Difference Regression
(1) (2) (3)
Number of monthly visits
Number of monthly PCN visits
Probability of visit being PCN
GotMedicaid 0.0101 0.00938 0.00114
(0.00942) (0.0117) (0.00547)
After -0.0127*** -0.000138 0.00466***
(0.00254) (0.00349) (0.00178)
After x GotMedicaid 0.00833 0.00640 0.000853
(0.0102) (0.0141) (0.00732)
Age in years 0.000158*** -0.000357*** -0.000555*** (0.0000583) (0.0000999) (0.0000557)
Female -0.00572*** 0.0413*** 0.0268***
(0.00218) (0.00369) (0.00190)
Black 0.00568 0.0104* 0.00705**
(0.00401) (0.00624) (0.00313)
Hispanic 0.0127*** 0.0202*** 0.00413
(0.00412) (0.00636) (0.00322)
Number of total visits 0.0487*** 0.0321*** -0.00243*** (0.000992) (0.00142) (0.000452) Number of chronic conditions -0.00529*** -0.0783*** -0.0534***
(0.00124) (0.00178) (0.000982)
R-squared 0.161 0.071 0.066
Observations 178726 178726 178726
Baseline Average 0.07 0.058 0.724
* p<0.10 ** p<0.05 *** p<0.01
Table 8. Difference-in-Difference Regression (Yearly Aggregate)
(1) (2) (3)
Number of yearly visits Number of yearly PCN visits
Probability of visit being PCN
GotMedicaid 0.433*** 0.364*** 0.000338
(0.0195) (0.0222) (0.00455)
After 0.0324*** 0.0379*** 0.00541***
(0.00496) (0.00559) (0.00189)
After x GotMedicaid 0.231*** 0.171*** 0.00139
(0.0222) (0.0247) (0.00640)
Age in years -0.00170*** -0.00226*** -0.000672***
(0.000123) (0.000143) (0.0000506)
Female 0.0905*** 0.130*** 0.0206***
(0.00436) (0.00499) (0.00165)
Black 0.0849*** 0.0848*** 0.0174***
(0.00861) (0.00949) (0.00291)
Hispanic 0.0900*** 0.0919*** 0.0136***
(0.00846) (0.00939) (0.00306)
Number of total visits 0.342*** 0.257*** -0.00219***
(0.00475) (0.00455) (0.000363)
Number of chronic conditions 0.0193*** -0.0769*** -0.0509***
(0.00249) (0.00286) (0.000988)
R-squared 0.597 0.393 0.067
Observations 119793 119793 119793
Baseline Average 0.86 0.70 0.730
* p<0.10 ** p<0.05 *** p<0.01
Notes: An observation is a unique patient-year combination. PCN stands for primary care-natured. The baseline group for race is White. Asian/Pacific Island, Native American, and Other race are included as controls but not reported. Patient location, ZIP code, and the constant term are included but not reported. The standard errors clustered at patient level are reported in
effect on the total number and the number of PCN visits from these two regressions was larger for
the yearly variables.
Table 9 displays the results from the fixed effects model. Within an individual patient,
gaining Medicaid coverage increases the number of monthly visits by 0.015. The number of
monthly PCN visits also increases, though not significantly. However, the probability of a visit
being PCN decreases, again not significantly. Similar to the difference-in-difference model, the
results are more significant from the aggregated data. Table 10 shows that when an individual
gains Medicaid coverage, the number of yearly visits increases by 0.55 and the number of yearly
PCN visits increases by 0.429. Again, the probability of a visit being PCN decreases, but again the
effect is imprecisely estimated. The magnitude of the effect on number of total visits and PCN
visits is again larger for the yearly variables. These findings support the results of the
difference-in-difference model, though there is a lower r-squared value. This is likely due to limited
month-to-month variation in the number of visits within the same patient in the short panel.
The difference-in-difference with fixed effects model bolsters the findings of the two
previous models. Table 11 shows that when an individual gains insurance through Medicaid
Expansion, the number of monthly visits and the number of monthly PCN visits increase and the
probability of a visit being PCN decreases, though all coefficients are insignificantly estimated.
The results from the aggregated data in Table 12 show that when an individual gains coverage
through Medicaid Expansion, the number of yearly visits increases by 0.314 and the number of
yearly primary care-natured visits increases by 0.253. Again, the yearly effect is larger than the
monthly effect. The probability of a visit being PCN increases by 0.0004, but once again is
Table 9. Patient Fixed Effects Regression
(1) (2) (3)
Number of monthly visits
Number of monthly PCN visits
Probability of visit being PCN
GotMedicaid 0.0152* 0.00190 -0.00504
(0.00877) (0.0102) (0.00463)
Number of chronic conditions -0.00391** -0.0611*** -0.0412***
(0.00173) (0.00201) (0.000916)
R-squared 0.000 0.009 0.020
Observations 178726 178726 178726
Baseline Average 0.07 0.058 0.724
* p<0.10 ** p<0.05 *** p<0.01
Notes: An observation is a unique patient-month combination. PCN stands for primary care-natured. Patient location, ZIP code, and the constant term are included but not reported. The standard errors clustered at patient level are reported in parentheses.
Table 10. Patient Fixed Effects Regression (Yearly Aggregate)
(1) (2) (3)
Number of yearly visits Number of yearly PCN visits
Probability of visit being PCN
GotMedicaid 0.550*** 0.429*** -0.00632
(0.0208) (0.0200) (0.00500)
Number of chronic conditions -0.0264*** -0.0843*** -0.0354***
(0.00562) (0.00540) (0.00135)
R-squared 0.017 0.017 0.016
Observations 119793 119793 119793
Baseline Average 0.86 0.70 0.730
* p<0.10 ** p<0.05 *** p<0.01
Table 11. Difference-in-Difference with Fixed Effects Regression
(1) (2) (3)
Number of monthly visits
Number of monthly PCN visits
Probability of visit being PCN
GotMedicaid 0.0163 -0.00443 -0.00728
(0.0110) (0.0128) (0.00583)
After -0.00802** -0.00305 0.00128
(0.00354) (0.00411) (0.00187)
After x GotMedicaid 0.00879 0.0107 -0.000547
(0.0143) (0.0165) (0.00752)
Number of chronic conditions -0.00360** -0.0610*** -0.0412***
(0.00174) (0.00202) (0.000919)
R-squared 0.000 0.009 0.020
Observations 178726 178726 178726
Baseline Average 0.07 0.058 0.724
* p<0.10 ** p<0.05 *** p<0.01
Notes: An observation is a unique patient-month combination. PCN stands for primary care-natured. Patient location, ZIP code, and the constant term are included but not reported. The standard errors clustered at patient level are reported in parentheses.
Table 12. Difference-in-Difference with Fixed Effects Regression (Yearly Aggregate)
(1) (2) (3)
Number of yearly visits Number of yearly PCN visits
Probability of visit being PCN
GotMedicaid 0.696*** 0.536*** -0.0110*
(0.0267) (0.0256) (0.00643)
After -0.0494*** -0.0417*** -0.0000659
(0.00900) (0.00865) (0.00217)
After x GotMedicaid 0.314*** 0.253*** 0.000477
(0.0317) (0.0305) (0.00765)
Number of chronic conditions -0.0219*** -0.0807*** -0.0354***
(0.00564) (0.00542) (0.00136)
R-squared 0.020 0.019 0.016
Observations 119793 119793 119793
Baseline Average 0.86 0.70 0.730
* p<0.10 ** p<0.05 *** p<0.01
a visit being primary care-natured. This is likely because the probability of a visit being PCN is
retrospectively assigned to each observation and therefore is a noisy measure.
I run two previous regressions (difference-in-difference and difference-in-difference with
fixed effects) on three more dependent variables to further support the results. I use the number of
monthly/yearly emergent visits, the number of monthly/yearly primary care-natured visits during
regular business hours, and the number of monthly/yearly primary care-natured visits outside of
regular business hours. The results are found in Appendix C.
Both regressions indicate that Medicaid Expansion increases the number of emergent visits
for the treatment group. For the regressions on the yearly aggregated data, the increase in number
of emergent visits is smaller than the increase in the number of primary care-natured visits (within
each respective regression). Neither regression on the monthly panel data yields statistically
significant results for the number of emergent visits.
These regressions also indicate that Medicaid Expansion increases the number of primary
care-natured visits that occur during regular business hours (Monday through Friday, 8:00 am to
5:00 pm). The number of primary care-natured visits that occur outside of regular business hours
increases as well as a result of Medicaid Expansion. Within each regression, the increase in PCN
visits outside of business hours is slightly greater than increase in PCN visits during business
hours.
It is important to note that the data set used includes only emergency department visits, not
all patients records, so I cannot definitively say that Medicaid patients are not also increasing the
number of visits at appropriate sources of primary care, such as a primary care provider. Also, the
urgency/nature of the visit was retrospectively classified as opposed to being determined at the
income information was estimated by their ZIP code median income. With more specific income
information, the treatment and control groups could be more comparable.
To confirm that the results are not driven by sample selection, I run a placebo regression
with the same treatment group but as if the policy implementation occurred in the previous year.
The placebo policy should not yield that same significant results as the real policy. To do this, I
change the difference-in-difference model so that Afterit equals one if the year is 2013 (rather than
2014). The second difference is ExpansionGroupi which equals one if that patient gained Medicaid
as a result of Medicaid Expansion (the same treatment group as before). The interaction term now
represents the placebo effect of Medicaid Expansion happening in a different year. This model is
run on both the monthly and yearly panel data.
The results of the monthly data are displayed in Table 13. The interaction term is significant
and negative for both the number of monthly visits as well as the number of monthly primary
care-natured visits. This is different from the results in Table 7, which were imprecisely estimated
positive effects. The results of the regression on the yearly data are displayed in Table 14. The
coefficient on the interaction term for the number of yearly visits and the number of PCN yearly
visits, though significant and positive, are only about 50-65% of the magnitude of the results in
Table 8. These results show the previous findings are not driven by confounding factors in sample
Table 13. Difference-in-Difference Regression (Placebo Effects)
(1) (2) (3)
Number of monthly visits
Number of monthly PCN visits
Probability of visit being PCN
ExpansionGroup -0.00571 -0.0157 -0.00910
(0.00995) (0.0155) (0.00735)
After (2013) -0.0119*** -0.00422 0.00293*
(0.00245) (0.00339) (0.00171)
After x ExpansionGroup -0.0227* -0.0398* -0.0116
(0.0126) (0.0215) (0.0102)
Age in years 0.000171*** -0.000278*** -0.000566***
(0.0000650) (0.000106) (0.0000582)
Female -0.00777*** 0.0372*** 0.0255***
(0.00237) (0.00376) (0.00195)
Black 0.00517 0.0131** 0.00817**
(0.00439) (0.00655) (0.00330)
Hispanic 0.0134*** 0.0210*** 0.00422
(0.00448) (0.00670) (0.00341)
Number of total visits 0.0497*** 0.0337*** -0.00205***
(0.00113) (0.00142) (0.000458)
Number of chronic conditions -0.00616*** -0.0855*** -0.0578***
(0.00149) (0.00211) (0.00115)
R-squared 0.160 0.075 0.069
Observations 140613 140613 140613
Baseline Average 0.056 0.045 0.726
* p<0.10 ** p<0.05 *** p<0.01
Table 14. Difference-in-Difference Regression (Yearly Aggregate) (Placebo Effects)
(1) (2) (3)
Number of yearly visits Number of yearly PCN visits
Probability of visit being PCN
ExpansionGroup 0.0706*** 0.0535** -0.00121
(0.0213) (0.0242) (0.00683)
After (2013) 0.0587*** 0.0570*** 0.00342*
(0.00485) (0.00546) (0.00180)
After x ExpansionGroup 0.152*** 0.0852** -0.000294
(0.0307) (0.0364) (0.00859)
Age in years -0.00184*** -0.00231*** -0.000692***
(0.000125) (0.000148) (0.0000542)
Female 0.0869*** 0.124*** 0.0193***
(0.00443) (0.00510) (0.00177)
Black 0.0838*** 0.0880*** 0.0184***
(0.00870) (0.00977) (0.00320)
Hispanic 0.0861*** 0.0893*** 0.0136***
(0.00861) (0.00972) (0.00336)
Number of total visits 0.349*** 0.265*** -0.00210***
(0.00515) (0.00483) (0.000392)
Number of chronic conditions 0.0192*** -0.0828*** -0.0548***
(0.00264) (0.00314) (0.00116)
R-squared 0.598 0.397 0.071
Observations 96165 96165 96165
Baseline Average 0.68 0.55 0.731
* p<0.10 ** p<0.05 *** p<0.01
Notes: An observation is a unique patient-year combination. PCN stands for primary care-natured. The baseline group for race is White. Asian/Pacific Island, Native American, and Other race are included as controls but not reported. Patient location, ZIP code, and the constant term are included but not reported. The standard errors clustered at patient level are reported in
7. Discussion
7.1Mechanisms
The results from multiple models suggest that patients who receive insurance through
Medicaid Expansion increasingly utilize the emergency department. The empirical models used
are constructed to identify not only association but causality. The primary models,
difference-in-difference and difference-in-difference-in-difference-in-difference with fixed effects, offer slightly different interpretations.
The original difference-in-difference model explains how emergency department utilization within
the population changes due to Medicaid Expansion while the difference-in-difference with patient
fixed effects explains how utilization varies within a patient as a result of Medicaid Expansion.
Both models support the finding that Medicaid Expansion leads newly-insured patients to increase
emergency department utilization. Medicaid Expansion causes an increase in the number of total
visits as well as the number of primary care-natured visits within this population.
There may be a few reasons for these results. After the policy implementation, some of the
previously uninsured group now has health insurance, meaning there is a reduced financial burden
to receiving health care. Reduced cost and improved insurance status may lead these patients to
increase the overall amount of health care they receive from various sources of care (including
primary care providers, specialty care providers, etc.), and that result is seen within emergency
department visits.
The increase in emergent visits supports the idea that the increased utilization is due to
reduced cost, as this is more likely than an increase in true health emergencies. When patients were
uninsured, it is likely that they were going untreated and underutilizing the emergency department
for health emergencies because of cost. Once covered, patients begin utilizing the emergency
Still, these now-Medicaid patients, though covered by insurance, may have difficulty
making appointments with primary care providers (PCPs) leading to the increase in number of
primary care-natured visits in the emergency department. This idea (lack of access to PCPs) is
supported by the increase in number of primary care-natured visits during regular business hours.
For patients visiting the emergency department while primary care providers offices are also open,
it is assumed that the limited hours of a PCP office is not the restrictive factor. Rather, it is likely
due to providers’ unwillingness to accept patients because of Medicaid status or the long wait
times for appointments that patients decide to seek primary care elsewhere (such as the emergency
department).
The number of primary care-natured visits outside of regular business hours also increase
which could mean that individuals are not able to visit the doctor during the day. This is likely
within the Medicaid population, which is made up of the lower income population who may work
jobs with few benefits (such as paid time off) or who are unable to skip a paycheck. It also could
be that patients are still unable to get an appointment with a primary care provider, so they decide
to receive care at a time convenient to them.
7.2Policy Implications
The Medicaid Expansion policy was designed for many reasons, not necessarily increasing
access to primary care, and has been successful in many aspects. Previous research has indicated
that Medicaid Expansion was successful in increasing the number of covered lives and increasing
access to certain types of care. However, the policy has not necessarily been successful in
providing all individuals equal access to primary care.
Specifically, these findings indicate that the policy has not been successful in improving
explained throughout the paper, Medicaid patients consistently have difficulty seeing a primary
care provider and inefficiently utilize the emergency department for primary care as a result. In a
healthcare system where insurance coverage is necessary for affordable healthcare and access to
care, gaining Medicaid does provide benefits to the individual such as lowering the out-of-pocket
cost of care and improving access to certain providers who do not accept uninsured patients.
However, because providers consider financial incentives, a Medicaid patient’s access to primary
care does not appear to very different from an uninsured patient’s access.
It could be argued that gaining Medicaid does improve access to primary care, by lowering
the cost of the emergency department, and the patient is better off as a result. However, this is
extremely inefficient for the healthcare system and still a more expensive alternative for the patient
than seeing a primary care provider. These results suggest that a different type of policy is needed
in improve access to primary care providers for all patients. Future healthcare policies should take
this into account as improving access would benefit both the patients as well as the healthcare
system.
8. Concluding Remarks
Medicaid patients have long been known to overutilize the emergency departments and
have difficulty accessing primary care providers. In terms of access to primary care, it seems as
though Medicaid coverage may not be much better than no coverage at all. Using a
difference-in-difference strategy, I identify the effect of the Medicaid Expansion policy on primary care-natured
visits in emergency departments. In particular, I find that Medicaid Expansion increases the
who gained insurance under the policy. These results suggest that issues with access to primary
care for Medicaid patients persist and continue to lead to inefficient delivery of primary care.
These findings support previous literature, highlighting the fact that Medicaid coverage
does not provide adequate access to appropriate sources of primary care. Future policy is required
References
Allen, L., Cummings, J., & Hockenberry, J. (2019). Urgent Care Centers and the Demand for
Non-Emergent Emergency Department Visits (No. w25428; p. w25428). National Bureau
of Economic Research. https://doi.org/10.3386/w25428
Annual Update of the HHS Poverty Guidelines. (2013, January 24). Federal Register.
https://www.federalregister.gov/documents/2013/01/24/2013-01422/annual-update-of-the-hhs-poverty-guidelines
Askin, E., & Moore, N. (2019). The Healthcare Handbook: A Clear and Concise Guide to the
United States Health Care System
Bradbury, C. (2015). Determinants of Physicians’ Acceptance of New Medicaid Patients.
Atlantic Economic Journal, 43(2), 247–260. https://doi.org/10.1007/s11293-015-9454-6
Brekke, K. R., Tor Helge Holmås, Karin Monstad, & Odd Rune Straume. (2017). Do treatment
decisions depend on physicians’ financial incentives? Journal of Public Economics, 155,
74–92.
Center for Disease Control. (2016). National Hospital Ambulatory Medical Care Survey: 2016
Emergency Department Summary Tables. 38.
Chen, W., Waters, T., & Chang, C. (2015). Insurance Impact on Nonurgent and Primary
Care-Sensitive Emergency Department Use. AJMC.
https://www.ajmc.com/journals/issue/2015/2015-vol21-n3/insurance-impact-on-nonurgent-and-primary-caresensitive-emergency-department-use
Eliason, P. J., Grieco, P. L. E., McDevitt, R. C., & Roberts, J. W. (2018). Strategic Patient
Discharge: The Case of Long-Term Care Hospitals. American Economic Review,
Emergency Medical Treatment & Labor Act (EMTALA) | CMS. (2012, March 26). Emergency
Medical Treatment & Labor Act (EMTALA).
https://www.cms.gov/Regulations-and-Guidance/Legislation/EMTALA/index
Frean, M., Gruber, J., & Sommers, B. D. (2017). Premium subsidies, the mandate, and Medicaid
expansion: Coverage effects of the Affordable Care Act. Journal of Health Economics,
53, 72–86. https://doi.org/10.1016/j.jhealeco.2017.02.004
Gandhi, S. O., & Sabik, L. (2014). Emergency Department Visit Classification Using the NYU
Algorithm. THE AMERICAN JOURNAL OF MANAGED CARE, 20(4), 6.
Gordon, S. H., Sommers, B. D., Wilson, I. B., & Trivedi, A. N. (2020). Effects Of Medicaid
Expansion On Postpartum Coverage And Outpatient Utilization: The effects of Medicaid
expansion on postpartum Medicaid enrollment and outpatient utilization. Comparing
Colorado, which expanded Medicaid, and Utah, which did not. Health Affairs, 39(1), 77–
84. https://doi.org/10.1377/hlthaff.2019.00547
Hackmann, M. B., & Pohl, R. V. (2018). Patient vs. Provider Incentives in Long Term Care. 79.
Hamersma, S., & Kim, M. (2013). Participation and crowd out: Assessing the effects of parental
Medicaid expansions. Journal of Health Economics, 32(1), 160–171.
https://doi.org/10.1016/j.jhealeco.2012.09.003
Health Insurance Coverage of the Total Population. (2019, December 4). The Henry J. Kaiser
Family Foundation. https://www.kff.org/other/state-indicator/total-population/
Hosseinichimeh, N., Martin, E. G., & Weinberg, S. (2016). Do Changes in Health Insurance
Coverage Explain Interstate Variation in Emergency Department Utilization? World
Johnston, K. J., Allen, L., Melanson, T. A., & Pitts, S. R. (2017). A “Patch” to the NYU
Emergency Department Visit Algorithm. Health Services Research, 52(4), 1264–1276.
https://doi.org/10.1111/1475-6773.12638
Kamal, R., Fehr, R., Ramirez, M., Horstman, K., & 2018. (2018, October 26). How Repeal of the
Individual Mandate and Expansion of Loosely Regulated Plans are Affecting 2019
Premiums. The Henry J. Kaiser Family Foundation.
https://www.kff.org/health-
costs/issue-brief/how-repeal-of-the-individual-mandate-and-expansion-of-loosely-regulated-plans-are-affecting-2019-premiums/
MACPAC. (2019). Medicaid enrollment changes following the ACA. MACPAC.
https://www.macpac.gov/subtopic/medicaid-enrollment-changes-following-the-aca/
Morley, C., Unwin, M., Peterson, G. M., Stankovich, J., & Kinsman, L. (2018). Emergency
department crowding: A systematic review of causes, consequences and solutions. PLOS
ONE, 13(8), e0203316. https://doi.org/10.1371/journal.pone.0203316
New Findings Confirm Predictions on Physician Shortage. (2019, April 23). AAMC.
https://www.aamc.org/news-insights/press-releases/new-findings-confirm-predictions-physician-shortage
Pines, J. M., Zocchi, M., Moghtaderi, A., Black, B., Farmer, S. A., Hufstetler, G., Klauer, K., &
Pilgrim, R. (2016). Medicaid Expansion In 2014 Did Not Increase Emergency
Department Use But Did Change Insurance Payer Mix. Health Affairs, 35(8), 1480–1486.
https://doi.org/10.1377/hlthaff.2015.1632
Schneider, E., Sarnak, Dana, Squires, David, Shah, Arnav, & Doty, Michelle. (2017, July 14).
Mirror, Mirror 2017: International Comparison.
Sirovich, B., Gallagher, P. M., Wennberg, D. E., & Fisher, E. S. (2008). Discretionary Decision
Making By Primary Care Physicians And The Cost Of U.S. Health Care. Health Affairs,
27(3), 813–823. https://doi.org/10.1377/hlthaff.27.3.813
Taubman, S. L., Allen, H. L., Wright, B. J., Baicker, K., & Finkelstein, A. N. (2014). Medicaid
Increases Emergency-Department Use: Evidence from Oregon’s Health Insurance
Experiment. Science (New York, N.Y.), 343(6168), 263–268.
https://doi.org/10.1126/science.1246183
Tolbert, J., Orgera, K., Singer, N., & Anthony Damico Published: (2019, December 13). Key
Facts about the Uninsured Population. The Henry J. Kaiser Family Foundation.
https://www.kff.org/uninsured/issue-brief/key-facts-about-the-uninsured-population/
Wen, H., Hockenberry, J. M., & Druss, B. G. (2017). Impact of Medicaid Expansion on
Medicaid-covered Utilization of Buprenorphine for Opioid Use Disorder Treatment.
Medical Care, 55(4), 6.
Williamson, T. R., Paoli, A. R., Hutzler, L., Zuckerman, J., & Bosco, J. (2019). Access to
Elective Orthopaedic Surgery After the Affordable Care Act Medicaid Expansion: The
New York State Experience. Journal of the American Academy of Orthopaedic Surgeons,