Metabolism Disrupting Chemicals and Metabolic Disorders
Jerrold J. Heindel1, Bruce Blumberg2, Mathew Cave3, Ronit Machtinger4, Alberto
Mantovani5, Michelle A. Mendez6, Angel Nadal7, Paola Palanza8, Giancarlo Panzica9, Robert Sargis10, Laura N. Vandenberg11, and Frederick vom Saal12
1National Institute of Environmental Health Sciences, Division of Extramural Research and
Training Research Triangle Park, NC, USA
2University of California, Department of Developmental and Cell Biology, Irvine CA, USA
3University of Louisville, Division of Gastroenterology, Hepatology and Nutrition, Louisville KY,
USA
4Sheba Medical Center and Tel Aviv University, Tel Aviv, Israel
5Instituto Superiore di Sanita, Rome, Italy
6University of North Carolina at Chapel Hill, School of Public Health, Chapel Hill NC, USA
7Institute of Bioengineering and CIBERDEM, Miguel Hernandez University of Elche, Elche,
Alicante, Spain
8University of Parma, Department of Neurosciences, Parma, Italy
9University of Turin, Department of Neuroscience and Neuroscience Institute Cavalieri Ottolenghi
(NICO), Turin, Italy
10University of Chicago, Section of Endocrinology, Diabetes and Metabolism, Department of
Medicine Chicago IL, USA
11University of Massachusetts, Department of Environmental Health Sciences, School of Public
Health & Health Sciences, Amherst MA, USA
12University of Missouri, Department of Biological Sciences, Columbia, MO, USA
Abstract
The recent epidemics of metabolic diseases, obesity, type 2 diabetes(T2D), liver lipid disorders and metabolic syndrome have largely been attributed to genetic background and changes in diet, exercise and aging. However, there is now considerable evidence that other environmental factors may contribute to the rapid increase in the incidence of these metabolic diseases. This review will examine changes to the incidence of obesity, T2D and non-alcoholic fatty liver disease (NAFLD), the contribution of genetics to these disorders and describe the role of the endocrine system in
Corresponding Author: Jerrold J Heindel, PhD, Division of Extramural Research and Training, National Institute of Environmental Health Sciences, 12233 TW Alexander Drive, RTP, NC 27709, Phone: 919 541-0781, [email protected].
Publisher's Disclaimer: This is a PDF file of an unedited manuscript that has been accepted for publication. As a service to our customers we are providing this early version of the manuscript. The manuscript will undergo copyediting, typesetting, and review of
HHS Public Access
Author manuscript
Reprod Toxicol
. Author manuscript; available in PMC 2018 March 01.Published in final edited form as:
Reprod Toxicol. 2017 March ; 68: 3–33. doi:10.1016/j.reprotox.2016.10.001.
A
uthor Man
uscr
ipt
A
uthor Man
uscr
ipt
A
uthor Man
uscr
ipt
A
uthor Man
uscr
these metabolic disorders. It will then specifically focus on the role of endocrine disrupting chemicals (EDCs) in the etiology of obesity, T2D and NAFLD while finally integrating the information on EDCs on multiple metabolic disorders that could lead to metabolic syndrome. We will specifically examine evidence linking EDC exposures during critical periods of development with metabolic diseases that manifest later in life and across generations.
Keywords
endocrine disruptors; obesogens; metabolism disruptors; developmental origins of health and disease; obesity; diabetes; lipid disorders
1. Introduction
Metabolic syndrome (MetS) is a complex condition characterized by insulin resistance, abdominal obesity, dyslipidemia, hypertension, and hyperglycemia; it is a risk factor for cardiovascular disease, T2D, stroke, chronic kidney disease and cancers [1, 2]. Its prevalence is increasing along with the increase in obesity, and it is reaching epidemic proportions affecting between 24% and 34% of the adult US population [3].
In the medical community, epidemics of metabolic diseases have largely been attributed to genetic background and changes in diet, exercise and aging. However, there is now considerable evidence that other environmental factors may contribute to the rapid increase in the incidence of obesity, T2D and other aspects of MetS observed over the past three decades [4]. One environmental factor that has begun to receive attention is a class of chemicals that can interfere with the action of hormones including metabolic hormones. These compounds, termed EDCs, are found in a wide variety of consumer products, and exposures are often widespread [5] Of particular concern is evidence that exposure to EDCs during critical periods when adipocytes are differentiating and the pancreas, liver, brain, etc. are developing can induce effects that manifest later in life, often as overt disease.
This review will examine changes to the incidence of obesity, T2D and NAFLD and its associated hyperlipidemia, the contribution of genetics and describe the role of the endocrine system in these metabolic disorders. It will then specifically focus on the role of EDCs in metabolic diseases, focusing on their role in the etiology of obesity, T2D and NAFLD while finally integrating the information on EDCs on multiple metabolic disorders that could lead to MetS. We will specifically examine evidence linking EDC exposures during critical periods of development with metabolic diseases that manifest later in life and across generations.
2. Metabolic Diseases
2.1 Obesity
Obesity is a global epidemic that affects infants, children and adults [6]. The global prevalence of obesity has nearly doubled over the past three decades and in the US it is the highest recorded in human history [7]. For the first time worldwide, the number of obese and overweight people is greater than the number of those who are underweight [8]. This
A
uthor Man
uscr
ipt
A
uthor Man
uscr
ipt
A
uthor Man
uscr
ipt
A
uthor Man
uscr
dramatic increase in the rate of abdominal obesity has been observed in both developed and developing countries [9, 10].
Obesity among children and adolescents has similarly increased [6]. Approximately one third of US children are overweight or obese, and over 60% of obese children will become obese adults [11]. There is also an obesity epidemic among infants six months of age and younger; an age group where food choices and limited physical activity cannot explain this outcome [12].
The obesity epidemic is not limited to humans but has also been observed as upward trends in body weight among primates and rodents living in research colonies, as well as among feral rodents, horses and domestic dogs and cats [13].
Staggering health care costs are associated with treating the co-morbidities that typically accompany obesity [14] including cardiovascular disease, hypertension, dyslipidemia, liver and gallbladder disease, insulin resistance, hyperglycemia and T2D [9]. Obesity is also associated with neurodegenerative diseases, cancers and obstructive sleep apnea. Thus, determining the factors that contribute to obesity has become a major public health issue.
2.2 Type 2 Diabetes
The American Diabetes Association (ADA) defines Diabetes Mellitus (DM) as: “a group of metabolic diseases characterized by hyperglycemia resulting from defects in insulin
secretion, insulin action, or both” [15]. DM can result from a deterioration in function and/or a loss of mass of pancreatic tissue [16] . T2D (formerly known as adult-onset or non-insulin-dependent diabetes or DM) accounts for 90-95% of diabetes cases and is characterized by increased insulin resistance and pancreatic beta cell dysfunction. More than 11% of individuals in the US older than 20 have diagnosed or undiagnosed T2D [7] and another 35% are estimated to be pre-diabetic. The World Health Organization (WHO) estimates that 347 million people globally suffer from diabetes (90% of which is T2D) [17]. Adolescents and even children have experienced significant increases in the prevalence of this disease over short periods [14, 18].
Obesity is the main environmental factor driving the increased incidence of T2D; 70% of the risk associated with T2D is related to weight gain. Obesity is associated with insulin
resistance that promotes beta cell proliferation, leading to hyperinsulinemia typical of early stages of T2D and MetS. However, obesity is neither necessary nor sufficient to cause T2D; these conditions can occur independently. Indeed, 20% of adults with T2D were not overweight and 57% of obese individuals do not have T2D [19].
2.3 Nonalcoholic Fatty Liver Disease and Hyperlipidemia
Liver is the central organ for lipid metabolism. Nonalcoholic fatty liver disease (NAFLD), characterized by excess triglyceride accumulation within hepatocytes, or steatosis, is
considered by some to be the hepatic manifestation of obesity and MetS. NAFLD is the most common liver disease, and it affects 25% of the global population [20] and almost 8% of children [21]. NAFLD and its more severe form, nonalcoholic steatohepatitis (NASH), are associated with increased liver-related and overall mortality [20], and NAFLD is a risk factor
A
uthor Man
uscr
ipt
A
uthor Man
uscr
ipt
A
uthor Man
uscr
ipt
A
uthor Man
uscr
for cardiovascular disease [22]. The metabolic condition most commonly associated with NAFLD is hyperlipidemia (69%), although NAFLD is also associated with obesity (51%), MetS (43%) and T2D (23%) [20]. NAFLD was initially thought to occur predominantly in women [23] but increasing evidence indicates that males and perhaps post-menopausal females are more susceptible to NAFLD [21, 24].
Hyperlipidemia is an elevation in blood triglycerides (hypertriglyceridemia), cholesterol (hypercholesterolemia), phospholipids, or a combination thereof. While there is an association between NAFLD and hyperlipidemia, not all patients with one disorder are affected by the other. The prevalence of hypertriglyceridemia in US adults is 25%, although it declined from 33% in 2001-2004 [25]. Total and LDL cholesterol have also been
declining, and these favorable changes may be attributed to increased awareness and utilization of lipid lowering medications [26]. Among adolescents and US children, the prevalence of hyperlipidemia was 20% (1999-2012) [27].
2.4 Metabolic Syndrome
The International Diabetes Federation estimates that 20-25% of the world’s adult population have MetS, which it defines as: “a cluster of the most dangerous heart attack risk factors: diabetes and prediabetes, abdominal obesity, high cholesterol and high blood pressure” (https://www.idf.org/metabolic-syndrome). The etiology of MetS is still a matter of research but insulin resistance and central obesity are significant contributors. Although there is still substantial debate, it is likely that components of MetS arise from insulin resistance. When insulin resistance occurs, there is an increase of fasting glucose and impaired glucose tolerance, often due to the abnormal expression of gluconeogenic enzymes. This metabolic state induces further insulin release, ultimately resulting in hyperinsulinemia.
Hyperinsulinemia then simulates transcription factors such as Srebp-1c in the liver, which drive hypertriglyceridemia and hepatic steatosis [28]. In addition, the overproduction and secretion of insulin by pancreatic β-cells can result in their exhaustion and death, initiating the onset of T2D. The most prevalent form of insulin resistance is associated with abdominal obesity and dysfunction of adipose tissue, indicating an important central role for obesity in MetS.
2.5 Genetic Contributions to Metabolic Diseases
2.5.1 Genetic Factors in Obesity—While the hereditary origins of obesity have long been assumed, a genetic contribution to obesity became evident only in the last two decades [29]. Evidence from twins and animal studies indicates that genetic factors account for 40-70% of the variation in BMI [30-33]. Although several single genes are linked to obesity, studies have confirmed that the genetic basis of high BMI is mainly polygenic (i.e., resulting from polymorphisms in several genes that are associated with appetite and metabolism) or results from single nucleotide polymorphisms [SNPs] rather than a single gene mutation [34]. Three SNPs are significantly related to obesity: one in FTO (fat mass and the obesity-associated gene), one near TMEM18 (transmembrane protein 18) and one near MC4R (melatocortin 4 receptor) [29, 34-36]. Only rare forms of obesity, usually parts of genetic syndromes, result from a single gene mutation or chromosomal abnormalities such as Prader-Willi and Bardet-Biedl syndromes [37]. Because many people who carry genetic
A
uthor Man
uscr
ipt
A
uthor Man
uscr
ipt
A
uthor Man
uscr
ipt
A
uthor Man
uscr
variants linked to increased BMI are not obese, it is anticipated that other environmental factors can influence these genetic predispositions.
2.5.2 Genetic Factors in Diabetes—Genetic factors are involved in the development of both type 1 and T2D. The most prominent genetic factor known to be associated with type 1 diabetes is located in the region of chromosome 6 that contains the highly polymorphic HLA class II genes and controls immune responsiveness [38]. Recently, whole-genome
investigations have detected more than 20 other genetic variants associated with type 1 diabetes [39].
Twin and family studies have provided strong evidence that T2D also has a solid genetic predisposition [40-42]. Genome wide association studies (GWAS) identified genetic variants associated with T2D; most of the loci identified are related to lipid metabolism, obesity and
β-cell pathways [43, 44]. TCF7L2 demonstrated the strongest effect of >70 loci associated with the disease [43]. Similar to the genetic basis for obesity, it is assumed that
predisposition to T2D involves multiple genes and SNPs.
2.5.3 Genetic Factors in Lipid Disorder Metabolism—Genetic predisposition to several lipid metabolism disorders was demonstrated based on twin and family studies with estimates that 40% to 80% of the variance in blood lipid levels results from genetic polymorphisms [45-47]. Familial hypercholesterolemia is an autosomal dominant disease characterized by elevated blood low-density lipoprotein levels (LDL). More than 150 mutations in the LDL receptor gene and in genes encoding the proteins apolipoprotein B (APOB), proprotein convertase subtilisin/kexin type 9 (PCSK9) and low density lipoprotein receptor adaptor protein 1 (LDLRAP1) that interact with the LDL receptor, are associated with the disease [48, 49].
High levels of very low-density lipoprotein (VLDL) and triglycerides characterize
hypertriglyceridemia. The hereditary form of this disease can result from mutations in genes that regulate the metabolism of triglyceride rich lipoproteins such as apolipoprotein A5 (APOA5) LPL, apolipoprotein C2 (APOC2), lipase maturation factor-1 (LMF1) and glycosylphosphatidylinositol anchored high density lipoprotein binding protein 1
(GPIHBP1). Hypobetalipoproteinemia is an autosomal dominant disease associated with low levels of LDL cholesterol and APOB-containing lipoproteins. Mutations in APOB and PCSK9 genes are common among patients [50].
2.5.4 Genetic Factors in NAFLD—Genetics have also been shown to contribute to variability in the occurrence of NAFLD [51]. In recent years, GWAS have identified two major genetic determinants associated with NAFLD. The most significant genetic linkage identified to date is a SNP in the gene patatin-like phospholipase domain-containing 3 (PNPLA3), a gene involved in the remodeling of hepatocellular lipid droplets [52]. This variant alters the mobilization of fatty acid, inhibits the activity of lipases and can cause hepatocellular accumulation of triglycerides [53]. Carriers of this genetic variant have increased susceptibility to liver damage when exposed to environmental stressors [53]. Another SNP in transmembrane six superfamily member 2 (TM6SF2) has been linked with
A
uthor Man
uscr
ipt
A
uthor Man
uscr
ipt
A
uthor Man
uscr
ipt
A
uthor Man
uscr
NAFLD. This gene variant is located on chromosome 19 and associated with increased hepatic triglyceride content and lower serum lipoproteins [54, 55].
3. Overview of Tissues and Hormones Controlling Metabolism
The endocrine system controls the tissues and organs that regulate weight and metabolism. Hormones and growth factors including estrogens, androgens, glucocorticoids, insulin and thyroid hormones (among others) regulate the pathways that control the number and content of adipocytes as well as appetite, satiety and energy balance [56-59]. Other hormones affect metabolism via actions in the gastrointestinal tract [ghrelin, cholecystokinin (CCK), glucagon like peptide (GLP-1)], the pancreas (insulin, glucagon), muscle (insulin), liver (glucagon, insulin, FGF21), adipose tissue (leptin, adiponection, and a variety of other factors), immune system, and brain [Neuropeptide Y (NPY), agouti related protein (AgRP), pro-opiomelanocortin (POMC), alpha melanocyte-stimulating hormone (alpha MSH)] [56-60]. These and other hormones, growth factors and neurotransmitters control the hedonic pathways in the brain that regulate food reward mechanisms, food cravings and addiction [61-63]. They also control glucose and lipid levels via pancreatic, muscle and liver responses. The pancreas responds to rising blood glucose levels by releasing insulin, which then promotes glucose uptake into tissues. It also responds to falling glucose levels in the blood by releasing glucagon, which acts on the liver to stimulate glycogenolysis and gluconeogenesis to raise blood sugar. The liver also regulates glucose and lipid metabolism via a number of nuclear hormone receptors including aryl hydrocarbon receptor - AhR, pregnane x receptor - PXR, and the constitutive androstane receptor – CAR.
Below we focus on the endocrine control of adipogenesis, glucose homeostasis and liver lipids.
3.1 Neuroendocrine Control
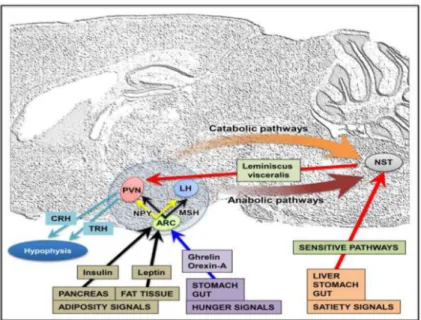
The neuroendocrine hypothalamus, together with some structures in the brainstem, plays a key role in the regulation of energy balance through the integration of peripheral signals and onward signal transmission (Figure 1). Peripheral signals conveying information about meal processing, gastrointestinal activity, and changes in energy stores access the brain via a number of routes, crossing or by-passing the blood-brain barrier from the systemic
circulation, or changing the firing rate of vagal or other sensory nerve fibers. In the medulla, the nucleus of the solitary tract and the area postrema are key sites for the integration of these peripheral signals and for sending them to other integration sites located in the hypothalamus (for reviews see [64, 65]).
The hypothalamus participates in the regulation of food intake and body weight with two neuroendocrine components: the afferent peripheral system (stimulated in response to a meal) and the efferent system (regulating the feeding behavior and energy metabolism) [66, 67]. The peripheral signals are the hormones insulin (secreted by the endocrine pancreas in response to changes in blood sugar), leptin (secreted by adipocytes in proportion to fat mass), ghrelin and orexin-A (secreted by the stomach and the gut)[68]. These hormones link the control of peripheral energy metabolism to the feeding behavior integrating neural units by modulating short term signals that determine meal initiation and termination as well as
A
uthor Man
uscr
ipt
A
uthor Man
uscr
ipt
A
uthor Man
uscr
ipt
A
uthor Man
uscr
energy balance [69]. Two neurochemically-distinct populations of hypothalamic neurons located in the arcuate nucleus (ARC) are critical for the integration of signals of nutritional status, and influence energy homeostasis [70]. One neuron group expresses the potent orexigenic neuropeptide NPY and AgRP and shows high concentrations of binding sites for many hormonal and metabolic signals such as insulin, leptin and ghrelin [71]. An increase in NPY release results in increased food intake and decreased energy expenditure. Another set of ARC neurons expresses the neuropeptide precursor POMC, which is processed to melanocortin peptides; activation of these neurons decreases food intake and increases energy expenditure [72-74]. These two populations of neurons thus exert opposite effects on energy intake and interact on several levels. The current hypothesis is that as adipose stores increase, both insulin and leptin levels increase along with POMC expression, while NPY synthesis and activity are inhibited and food intake is reduced. Conversely, when NPY synthesis and release are increased and POMC is decreased, the result is an increase in food intake [75-77]. Dysfunction of the NPY system has been implicated in obesity and T2D in humans [78, 79]
Peptidergic neurons in the ARC project to other hypothalamic nuclei such as the paraventricular nucleus (PVN), dorsomedial hypothalamus, lateral hypothalamic area (LHA), and perifornical area [80, 81]. These secondary centers process information regarding energy homeostasis. In particular, the PVN receives NPY/AgRP and POMC/ METSH/CART projections and contains secondary neurons which are involved, for instance, in emotional and stress responses, which have been shown to be physiologically involved in energy homeostasis (i.e. thyrotropin releasing hormone (TRH) and corticoid releasing factor) [82]. In addition, the liver (an important integrator of nutrient metabolism) produces an endocrine satiety signal (fibroblast growth factor 21, FGF21), that suppresses the consumption of simple sugars, and reduces sweet-seeking behavior, by acting centrally at the level of the PVN [83].
Estradiol, in addition to its function as a gonadal hormone, is involved in the regulation of metabolism through the modulation of food intake, body weight, glucose/insulin balance, body fat distribution, lipogenesis and lipolysis, and energy consumption. The central metabolic action of estradiol at the brain level occurs primarily in the ARC of the
hypothalamus where it targets directly the POMC neurons and indirectly the NPY cells [84]. Estradiol represses the synthesis of NPY and AgRP and thereby has an inhibitory function on food intake [85-88]. Recent data have shown that leptin and estradiol may use a common pathway to regulate energy metabolism, namely the STAT3 pathway in POMC neurons [87, 88].
This integrated pathway between reproductive and metabolic functions is confirmed by recent findings on the role of brain kisspeptin and its receptor KISS1R (reviewed by [89]), originally identified based on their endocrine functions of regulating puberty and fertility, through actions on hypothalamic gonadotropin releasing hormone production [90]. Emerging evidence demonstrates a significant role of kisspeptin for regulating glucose homeostasis, insulin secretion, as well as food intake and body composition [91], with deficient kisspeptin signaling resulting in decreased locomotor activity and increased adiposity in a sex-dependent manner [92]. Organization and function of the
kisspeptin-A
uthor Man
uscr
ipt
A
uthor Man
uscr
ipt
A
uthor Man
uscr
ipt
A
uthor Man
uscr
Kiss1R system is sex-specific, and sex steroid hormones play a crucial role in determining such sexual dimorphisms [93, 94]. The kisspeptin system is therefore a potential target of endocrine disruption; in rodent studies, exposure to EDCs altered the kisspeptin system in a region-, sex- and compound -specific manner, and induced effects on the timing of pubertal onset, estrous cycles, and socio-sexual behaviors [95-97].
3.2 Adipose Tissue
Adipose tissue is the key regulator of energy balance and nutritional homeostasis and consists of white, brown and beige fat. It is an endocrine organ with more than 20 endocrine, paracrine and autocrine secretions. The adipose tissue consists of several depots located in subcutaneous, intra-abdominal (visceral) and intra-thoracic areas. Visceral adipose tissue depots are metabolically different from subcutaneous compartments [98]. Intra-abdominal (visceral) depots are associated with T2D and cardiovascular disease while subcutaneous depots seem protective against these diseases [99].
White adipose tissue stores energy as triglyceride and also signals to other organs on the status of energy reserves via hormones, growth factors and cytokines [100]. Two major secretions of white adipose tissue are leptin and adiponectin. Leptin is secreted in proportion to fat mass; it acts on the brain to reduce food intake and increase energy expenditure. However, obese individuals typically have increased serum leptin levels due to leptin resistance [101]. Adiponectin is also secreted from adipose tissue and induces fatty acid oxidation in liver, improves pancreatic beta cell function, enhances peripheral insulin sensitivity, suppresses hepatic glucose production and reduces inflammation [102]. Adipose tissue also contains immune cells, from both the adaptive (B and T lymphocytes ) or innate ( macrophages) immune system thus it is an immune orgain. Obesity is considered a proinflammatory condition in which both hypertrophied adipoctyes and resident immune cells produce and release proinflammatory cytokines, including IL-6 and TNFα, which are associated with chronic low-level systemic inflammation, insulin resistance and T2D. In contrast, in non-obese individuals anti-inflammatory cytokines including adiponectin, interleukin −10, and transforming growth factor beta (TGFb) are preferentially secreted which, among other functions, improve insulin sensitivity [103].
Brown adipose tissue is present throughout life, but with highest volume in newborns. It generates body heat via non shivering thermogenesis while beige fat appears to be bifunctional, changing to either white or brown fat depending on the stimuli [104]. The sympathetic nervous system controls lipolysis in white adipose cells and stimulates the cold response in brown adipocytes.
In response to excess energy, adipocytes enlarge and/or increase in number [100]. Excess fat in these cells results in tissue dysfunction which leads to the development of other diseases and conditions including inflammation, T2D, heart disease, fatty liver, reproductive problems and some forms of cancer depending somewhat on the site of the added adipose tissue (e.g. visceral or subcutaneous) [100].
In humans, adipose tissue develops by the 14th week of gestation [105] followed by a second period of increased cellularity that continues after birth and lasts through adolescence [106].
A
uthor Man
uscr
ipt
A
uthor Man
uscr
ipt
A
uthor Man
uscr
ipt
A
uthor Man
uscr
The number of white adipocytes is usually fixed after that time [100] however adipocytes are replaced at a rate of about 10% per year in adulthood [106], thus the tissue is not static. In mice, most subcutaneous adipogenesis occurs late in gestation and after birth; differentiation of gonadal fat only appears postnatally between birth and puberty [107]. Overall, fat mass can continue to grow due to high fat feeding which induces both hyperplasia and
hypertrophy in rodents [107] with the hyperplasia occurring in the visceral tissue. Adult mice that are challenged with a high fat diet accumulate fat by hypertrophy in most adipose depots, with the exception of gonadal (visceral) fat which possesses higher capacity to expand by hyperplasia [107].
Specific genes play critical roles in fat cell development and control, including PPARγ and Runx2, often called the master regulators of fat cell differentiation [108] and sirtuins which play important roles in secretion of adipokines including leptin and adiponectin, hepatic glucose metabolism, insulin sensitivity and inflammation [109].
Adipocytes are derived from mesenchymal stem cells (MSCs), which can be
neuroectodermal or mesodermal depending on where the fat body originates; differentiation of adipocytes requires a committed pre-adipocyte progenitor [110, 111]. Visceral white adipose tissue (WAT) is primarily derived from the lateral plate mesoderm [112], brown fat is largely produced by the paraxial mesoderm [113] , and cranial WAT from the neural crest [114] . Beige (a.k.a brite) fat arises from WAT (precursors or mature cells). Despite this common origin, beige fat is thermogenic, like brown fat, so it plays a different metabolic role than WAT and has a correspondingly different transcriptional program than WAT [115] [116]. Mesenchymal stem cells harvested from adipose tissue or bone marrow can be made to differentiate into fat, bone, cartilage, and other lineages in culture [117]; commitment to each of these lineages is largely mutually exclusive and irreversible [118]. Transformation of an MSC into an adipocyte requires initial commitment to the adipose lineage, followed by terminal differentiation into a mature adipocyte (reviewed in [100, 111]). Adipocyte commitment is mediated by transcription factors Zfp423 [119], Zfp467 [120], Schnurri2 [121], Tcf7l1 [111] and the mTORC1 effector S6K1 [122]. Collectively these genes function to sensitize cells to BMP2/4 signaling while inhibiting canonical Wnt signaling and
promoting expression of the so-called master regulator of adipogenesis, PPARγ. Terminal differentiation is primarily controlled by PPARγ and CCAAT-enhancer-binding proteins (C/ EBP) −α, −β, and −δ [123, 124] which establish a sustained feedback loop. Treatment of committed pre-adipocytes with an "adipogenic cocktail” (glucocorticoids, cAMP agonists, and insulin) increases expression of PPARγ and C/EBP proteins and is marked by induction of metabolic genes and adipokines associated with mature adipocytes [124, 125].
3.3. Control of Glucose Homeostasis
Regulation of blood glucose within the normal range is accomplished through the concerted action of several organs: glucose absorption by the intestine, glucose-dependent secretion of insulin and glucagon from the endocrine pancreas, regulation of glucose production by the liver, and glucose uptake and metabolism by peripheral tissues. All these processes are further regulated by the neural system.
A
uthor Man
uscr
ipt
A
uthor Man
uscr
ipt
A
uthor Man
uscr
ipt
A
uthor Man
uscr
3.3.1Pancreas—The endocrine pancreas is comprised of the pancreatic islets of Langerhans, a heterogeneous population of 1000-3000 cells, where the predominant cell type is the insulin-releasing β-cell. Other cells include α-cells, responsible for glucagon secretion, and δ-cells, responsible for somatostatin release, pancreatic polypeptide-producing cells (PP-cells) and ε-cells that produce ghrelin [126, 127]. While β- and α-cell populations represent about 70-80% and 20% respectively of the total islet cell number in rodents, in humans the pancreas is comprised of 40-45% α-cells and 50% β-cells [128] and up to 10% δ-cells.
The number of β-cells rapidly expands in utero and in the neonatal period and then replication occurs only at very low levels in adult rodents [129] and humans [130]. β-cells replicate throughout life after physiologic challenges like high blood sugar, peripheral insulin resistance and pancreatic injury and their mass is controlled by insulin, placental lactogen and prolactin (reviewed in [131]). The liver may also control β-cell proliferation via a novel hormone, betatropin [131], which is upregulated in pregnancy and in the ob/ob and db/db diabetic mouse.
The regulation of blood glucose starts when glucose is taken up by β-cells where it undergoes intermediary metabolism. Insulin release takes place after glucose metabolism increases the ATP/ADP ratio, which closes plasma membrane ATP-sensitive K+ (KATP) channels that are responsible for the resting membrane potential. This results in cellular depolarization and ultimately insulin release from the cell. Insulin secreted into circulation then binds to receptors on the surface of target cells in the periphery to facilitate glucose uptake and metabolism. Impaired β-cell insulin production results in a rise in blood glucose levels that over time can lead to the development of diabetes (See figure 3). This metabolic transition can arise from frank β-cell destruction as seen in type 1 diabetes or to β-cell dysfunction arising from increased synthetic demand resulting from peripheral insulin resistance as in T2D.
Glucagon is another key glucose-regulating hormone. It is secreted by α-cells in response to falling blood glucose levels and principally stimulates the liver to increase glycogenolysis and gluconeogenesis to raise circulating blood sugar [132, 133]. When extracellular glucose concentrations rise to levels required for insulin release, glucagon release decreases [134]. Several paracrine and neural mechanisms also inhibit glucagon release [127, 135-138]. While pure hyperglucagonemia is a rare cause of diabetes, disruptions in the autoregulatory feedback loop linking insulin and glucagon secretion is thought to result in inappropriate glucagon secretion in both type 1 and T2D [139].
3.3.2 Liver—The liver is the principal location of glucose storage as glycogen, and the main source of glucose for all tissues. Because the pancreatic veins drain into the portal venous system, every hormone secreted by the pancreas must traverse the liver before entering systemic circulation. The liver is a major target for pancreatic insulin and glucagon action as well as their site of degradation. In fact, 70% of hepatic glucose output occurs via liver glycogenolysis and 30% via gluconeogenesis.
A
uthor Man
uscr
ipt
A
uthor Man
uscr
ipt
A
uthor Man
uscr
ipt
A
uthor Man
uscr
Insulin promotes glycogen synthesis and decreases its breakdown after enhancing the transcription of glucokinase and the activation of glycogen synthase through changes in its phosphorylation state. Insulin increases transcription of the glucokinase gene and other enzymes involved in glycolysis such as phosphofructokinase and pyruvate kinase, promoting glycolysis [140]. Insulin also inhibits gluconeogenesis by decreasing phosphoenolpyruvate carboxykinase (PEPCK) and fructose-1, 6-biphosphatase (FBPase) gene expression. As a result, insulin inhibits glucose production during the fed state, keeping glucose levels within the normal range. At the same time, high glucose levels inhibit glucose-6-phosphatase and decrease the activity of glycogen phosphorylase; all together, these processes considerably reduce the conversion of glycogen to glucose.
Insulin also promotes the storage of fat by stimulating lipogenesis. It inhibits the oxidation of fatty acids by decreasing fatty acid transport into the mitochondria. Additionally, insulin stimulates fatty acid synthase (FAS). All together, these pathways promote the formation of triglycerides that can either be stored in the liver or exported as very low
density-lipoproteins (VLDL).
On the other hand, glucagon signaling in the liver plays a key role during fasting, as well as in the adaptive response to hypoglycemia. After binding at its receptors, glucagon activates the cAMP/PKA pathway, which decreases glycolysis via a modulatory action on pyruvate kinase [127]. Glucagon increases gluconeogenesis after up-regulation of glucose-6-phosphatase and PEPCK through the activation of coactivators such as CREB-binding protein (CBP), P300, PGC-1 and TORC2 [134, 141-144]. In addition, glucagon also activates ketogenesis. All these effects favor hepatic release of glucose to maintain normal blood glucose levels during fasting. Glucagon also promotes the oxidation of fat in the liver, increasing the activity of the citric acid cycle and the generation of ketone bodies. Moreover, there is a glucagon-induced decrease of triglyceride, VLDL, cholesterol and fatty acid synthesis mediated by PPARα [145].
3.3.3 Skeletal muscle—Skeletal muscle is the major site of insulin-mediated glucose usage; it can clear up to 70% of the blood glucose pool. Unlike the liver, glucose transport in skeletal muscle is insulin dependent via the recruitment of the glucose transporter GLUT4 to the membrane. Insulin activation of hexokinase and glycogen synthase enhances glycogen synthesis. Activation of phosphofructokinase and pyruvate dehydrogenase enhances glucose breakdown and oxidation. The action of insulin in glucose utilization allows the muscle to store fat as triglycerides that together with glycogen can be used as sources of energy during exercise and heat generation.
3.3.4 White adipose tissue—Similar to skeletal muscle, insulin promotes recruitment of GLUT4 to the membrane and accelerates glucose transport into adipocytes. It then induces the breakdown of glucose to generate triglycerides. These triglycerides are stored in fat together with those delivered via the circulation as chylomicrons and VLDL. In addition, insulin inhibition of triglyceride lipase decreases triglyceride breakdown. Insulin decreases lipolysis through inhibition of hormone sensitive lipase in a cAMP-dependent manner [146, 147]. Insulin promotes the synthesis of lipoprotein lipase (LPL), which is exported to the endothelial cell plasma membrane. Once anchored there, LPL cleaves triglycerides from
A
uthor Man
uscr
ipt
A
uthor Man
uscr
ipt
A
uthor Man
uscr
ipt
A
uthor Man
uscr
VLDL and chylomicrons into glycerol and fatty acids that are taken up by nearby adipocytes to form triglycerides.
Although the role of glucagon in WAT is controversial, recent results point to a role in lipolysis [127]. This lipolytic action has been attributed to glucagon-induced release of fibroblast growth factor 21 (FGF21) [148] as well as to signals from the sympathetic nervous system [149].
3.3.5 Importance of Insulin Resistance—Insulin resistance is present in many cases of obesity and T2D. However, most insulin-resistant individuals do not develop hyperglycemia due to compensatory increases biosynthesis and the release of insulin as well as increases in pancreatic β-cell mass. For example, obese subjects secrete 2-5 times more insulin in response to glucose, while athletes secrete 2-5 times less insulin [150]. Insulin resistance developed during puberty and pregnancy is counteracted by adaptation of β-cell mass and function, with sex and maternal hormones playing important roles [151-155]. Insulin sensitivity, therefore, regulates β-cell function; insulin resistant subjects, whether they are obese or lean, have greater insulin response and lower insulin clearance than insulin-sensitive individuals. In order for insulin resistance to lead to T2D, β-cells adaptation must fail [156]. Regulation of β-cell mass may occur by hypertrophy of existing cells and proliferation. Glucose, non-esterified fatty acids, incretins, and neuronal signaling are involved in increasing β-cell mass and function, yet when glucose and lipids are increased for longer than normal β-cell are killed which generates the onset of T2D [157, 158].
The ability of pancreatic β-cells to integrate responses to changes in insulin sensitivity likely involves increased metabolism and metabolic signals. These include signaling molecules from adipocytes (e.g. NEFAs signaling via GPR40) as well as and fatty acyl-CoAs that augment insulin release via the exocytotic machinery and protein kinase C (PKC). Leptin, adiponectin, and proinflammatory cytokines such as TNFα, IL-6 and monocyte
chemoattractant protein (MCP-1) from macrophages and other cells infiltrating adipose tissue have a role as well [157]. Pancreatic α-cells are responsible for glucagon production and release. Thus alterations in the pancreatic α-cell function can also contribute to T2D [127]. Unlike β-cells, the mass of pancreatic α-cell does not decrease in T2D, resulting in an increased α-to-β cell ratio; this altered ratio also contributes to higher plasma levels of glucagon and therefore to hypoglycemia.
Thus, when β-cells are healthy, their adaptive responses counterbalance insulin resistance and preserve normal glucose tolerance. However, if β-cell dysfunction occurs due to genetic causes, environmental perturbations, or both, then the individual is more prone to develop impaired glucose tolerance, high fasting glucose levels, and ultimately T2D.
3.4 Liver Control of Xenobiotic and IntermediaryMetabolism
The liver is the largest and most metabolically complex organ in the human body. Hepatocytes make up over 80% of total liver mass and play a critical role in intermediary energy (lipid, carbohydrate, amino acid) and xenobiotic metabolism (Phase I-III
metabolizing enzymes). Other liver-specific cell types include Kupffer cells, biliary epithelial cells, sinusoidal endothelial cells, and stellate cells. These cells have specialized
A
uthor Man
uscr
ipt
A
uthor Man
uscr
ipt
A
uthor Man
uscr
ipt
A
uthor Man
uscr
functions ranging from protection against infection, bile duct flow, endocytosis and fibrosis. The liver arises from the hepatic diverticulum of the foregut during the fourth week of gestation. Hepatoblasts are bipotential progenitor cells arising from foregut endodermal cells that differentiate into hepatocytes and cholangiocytes.
The liver is the principal organ for xenobiotic detoxification. Ligand-activated xenobiotic receptors induce foreign compound metabolism by cytochrome P450s. For example, the aryl hydrocarbon receptor (AhR) induces expression of CYP1A1, the constitutive androstane receptor (CAR) induces CYP2B10, and the pregnane X receptor (PXR) induces CYP3A4. In general, chemical ligands are metabolized by the P450s that they induce. In addition to foreign compound metabolism, xenobiotic receptors play an important role in the control of hepatic lipid and carbohydrate metabolism. It was recently proposed that activation and cross-talk of xenobiotic receptors by foreign compounds is a molecular initiating event in hepatic steatosis [159]. Likewise, interactions between environmental compounds and xenobiotic receptors regulate, in part, hepatic carbohydrate metabolism including
gluconeogenesis and insulin resistance [160, 161]. These mechanisms appear to account for the wasting syndrome associated with some dioxin-like chemicals that activate the AhR [161].
Owing to its critical role in xenobiotic and intermediary metabolism, the liver is a principle target organ for chemicals resulting in the development of steatosis. Steatosis may progress to steatohepatitis (steatosis with superimposed hepatic inflammation), cirrhosis and hepatocellular carcinoma, and ultimately liver-related death if liver transplantation does not occur. In the clinic, steatohepatitis is named according to its etiology: alcohol (alcoholic steatohepatitis, ASH), cancer medications (chemotherapy associated steatohepatitis, CASH), excess dietary lipids or carbohydrates (NASH), and industrial chemicals (toxicant associated steatohepatitis, TASH) [162, 163]. While disease mechanisms vary by etiology [164], steatosis is invariable associated with an imbalance of hepatocyte lipid synthesis, oxidation, uptake, and efflux via VLDL [159].
3.5. Thyroid Control of Metabolism
The thyroid gland, located in the neck, is one of the largest endocrine glands in the body. It plays a crucial role in normal growth and development, energy homeostasis and regulation of adult metabolism. The main hormones secreted by the gland are Thyroxine (T4), which has limited biological activity and triiodothyronine (T3) which is more potent but with a shorter half-life. T4 is converted to T3 by the enzyme thyroxine 5'-deiodinase [165]. Thyroid hormones are regulated by thyroid stimulating hormone (TSH) secreted by the anterior pituitary gland, which in turn is regulated by TRH produced by the hypothalamus [166, 167].
Tight interaction exists between thyroid function, weight control, and obesity [168]. Mild differences in thyroid function can be associated with changes in body weight and fat mass [168, 169]. Even small variations in serum TSH, within the reference range of the assay, were associated with differences in body mass; higher levels of TSH were associated with increased BMI [170-172]. There is an inverse correlation between free thyroxine (fT4)
A
uthor Man
uscr
ipt
A
uthor Man
uscr
ipt
A
uthor Man
uscr
ipt
A
uthor Man
uscr
values and body mass index (BMI), even when fT4 values remain in the normal range [173, 174] .
3.6. Sexual Dimorphism and Metabolism
In humans, there are important sex differences in the incidence and health consequences of obesity; men and women differ in the patterns of fat deposition, fat mobilization, utilization of fat, and the consequences of both excess and insufficient fat stores. Gonadal hormones appear to play a crucial role in shaping such differences. Women suffer fewer obesity-related disorders than men do. In fact women are resistant to free fatty acid-induced insulin release and are therefore less prone to T2D before manopause but the prevalence of these disorders increases dramatically after menopause[175]. The prevalence of T2D is higher in men before puberty compared to reproductive age females. It is noteworthy that T1D has a male
predominance as well[176]. Androgens, adiposity and disease are clearly interrelated in humans.
These asymmetries in energy balance traits probably reflect evolved adaptive differences due to differential investment and costs of reproduction in male and female mammals and are mainly shaped by gonadal hormones either during development (organizational effects) or at adulthood (activational effects) (for reviews see [177-179]). Development and maturation of brain circuits involved in the regulation of food intake and metabolism occur during the perinatal period. The current literature argues that there are multiple critical periods in which hormones organize energy balancing traits; besides the fetal and neonatal stage, the
peripubertal period is also a time window when sexually dimorphic eating behaviors are established [180]. Sex differences in body fat composition and distribution, energy expenditure, orosensory physiology, taste and smell preference, food intake, binge eating, susceptibility to diet induced obesity, responses to leptin-, ghrelin,- or insulin-induced hyperphagia, POMC gene expression in the ARC nucleus, and many other traits are well documented (reviewed in: [181-183]).
The POMC, melanocortin system, is sexually dimorphic [184]. In adults, females have increased responsiveness to leptin and decreased responsiveness to insulin in comparison to males. These differences are estrogen dependent [185], and they are perinatally organized by testosterone [186]. The NPY/AgRP circuit is also sexually dimorphic. In particular, in situ hybridization studies demonstrated sex differences in the distribution of NPY mRNA-containing cells in the rat ARC, and its modulation by testosterone in males [187]. Also, NPY immunoreactivity is sexually dimorphic in the ARC, the dorsomedial hypothalamus, and the PVN [188]; NPY-Y1 receptor expression is higher in females compared to males [189].
Male mice have higher levels of daily food intake, post-fast hyperphagia and leptin-induced hypophagia compared to female mice, and these behavioral differences are related to sexual dimorphisms in the ARC as far as the number of ARC cells containing NPY, AgRP, and POMC. Females perinatally treated with testosterone or DHT show male-like levels of food intake, post-fast hyperphagia and POMC gene expression and projection [186].
A
uthor Man
uscr
ipt
A
uthor Man
uscr
ipt
A
uthor Man
uscr
ipt
A
uthor Man
uscr
Estrogens play a pivotal role in regulating energy homeostasis, especially in female mammals, either by acting directly on the brain or through activation of estrogen receptors (ER) on adipocytes. Estrogens protect against increased adiposity/obesity through their effects of suppressing appetite and increasing energy expenditure; estradiol suppresses feeding by enhancing the potency of other anorectic signals (leptin, apolipoprotein, BDNF, cholecystokinin) and by decreasing the potency of orexigenic signals such as ghrelin and melanin concentrating hormone [87, 185, 190, 191]. The liver is a major target for estrogen action in female mammals and the activity of the liver ERα is strictly associated with ovarian activity [192]. In the liver, ERα regulates fertility in response to protein
consumption and controls lipid and cholesterol synthesis in relation to the reproductive cycle [193] . Since the liver is the major organ for the control of energy homeostasis, the activity of hepatic ERα also influences the synthesis and secretion of the signaling molecules necessary for coordinated responses among liver, fat, muscles and brain [192].
In mammals, including humans, the liver is a sexually dimorphic organ and exhibits major differences in the profile of steroid, lipid, foreign compound metabolism [194], and gene expression. These differentially expressed genes regulate a wide range of biological processes; accordingly, many enzymes, such as steroid hydroxylases belonging to the cytochrome P450 (CYP) superfamily, are expressed in the liver in unique, sexually biased patterns [195]. Such differences have implications for sex-related steroid metabolism, xenobiotic metabolism and pharmacokinetics, and differential susceptibility to some liver diseases [23, 196]. The sexual dimorphism of liver gene expression is established and maintained, in part, by the temporal pattern of pituitary GH secretion, which is sex specific in many species (episodic in males and more stable in females) [197]. GH secretion is affected by brain and lactotrope dopamine 2 receptors (D2Rs) [198]. A link exists between obesity, growth, and dopaminergic systems located within the central nervous system and in other tissues [199-201].
4. Environmental Contributions to Obesity, T2D, and Dyslipidemia
The global pandemic of obesity, T2D and MetS is often causally linked to marked changes in diet and lifestyle, namely increases in dietary intake of high energy diets and concomitant reduction in physical activity levels [202]. However, it is clear that the susceptibility to these diseases is not that simple. Indeed there have been multiple environmental factors that have been linked to the increase in these metabolic diseases including stress, lack of sleep, adenoviruses, childhood antibiotics [202-205] and exposure to environmental chemicals [206] . While all of these environmental stressors likely play some role in the epidemic of metabolic diseases, we focus here on exposure to environmental chemicals, especially EDCs and the role they might play in disease etiology. Indeed the current rise in metabolic diseases correlates with substantial increases in environmental chemical production and exposures over the past four decades [207-209].
4.1 Overview of Endocrine Disrupting Chemicals
In 2012, the Endocrine Society defined EDCs as “an exogenous chemical, or mixture of chemicals, that can interfere with any aspect of hormone action” [210]. This definition is a
A
uthor Man
uscr
ipt
A
uthor Man
uscr
ipt
A
uthor Man
uscr
ipt
A
uthor Man
uscr
more simplified version of the one originally proposed by the US EPA, that EDCs are “an exogenous agent that interferes with the production, release, transport, metabolism, binding, action, or elimination of natural hormones in the body responsible for the maintenance of homeostasis and the regulation of developmental processes” [211]. At the global level, the WHO/UNEP definition of EDCs is “an exogenous substance or mixture that alters the function(s) of the endocrine system and consequently causes adverse effects in intact organism, or its progeny or (sub) population [212]. Although EDCs were first identified as agonists or antagonists of estrogen, androgen and thyroid hormone receptors [213], EDCs disrupt hormonal signaling systems by interfering with a variety of hormones through numerous mechanisms. EDCs can disrupt normal hormone levels by inhibiting or
stimulating the production and metabolism of hormones, or changing the way hormones are transported to target tissues.
The effects of EDCs, like those of hormones, can occur at very low levels [214-217]. Other principles of hormone action are similarly expected for EDCs including their ability to induce tissue- and time-dependent effects and strong evidence that responses to EDCs can be non-monotonic (often referred to as biphasic or U-shaped responses) [5, 210, 215, 218, 219]. Some EDCs are persistent and can bioaccumulate in tissues [220, 221]. With more than 85,000 registered chemicals in commerce, most of which are poorly studied; current estimates have identified approximately 1000 chemicals that meet the criteria of an EDC [213, 222].
Decades of work from both basic and clinical endocrinology have revealed that the disruption of hormones can have detrimental effects on a variety of diseases [223] [223-225]. A number of recent “state of science” reviews of the EDC literature, as well as large reviews of hundreds or thousands of EDC studies, draw strong conclusions about the association between EDC exposures and diseases [210, 215, 218, 223, 226-229]. These conclusions are drawn from observational human epidemiology studies and controlled laboratory animal studies, as well as additional support from wildlife studies, in vitro mechanistic studies, and in silico studies. In 2015, a review of the EDC literature by scientists in the Endocrine Society found that there was strong evidence for a role of EDCs in the etiology of metabolic diseases, although these diseases were generally examined individually [230]. Some of these conclusions were challenged, with groups contesting the strength of evidence linking EDC exposures to endocrine-related diseases [231-236]. However, whereas some useful criticisms were put forward, these challenges typically resulted from a lack of understanding of the endocrine system, as well as of endocrine disruption as an effect on a complex regulatory network of the organism [219, 237-242]. On the contrary, the need to fully appreciate the impact of EDCs is apparent considering the health care costs associated with inaction [9, 229].
A number of relevant factors can influence whether significant effects are observed in experimental studies of EDCs and these factors can affect the strength of the evidence for an effect. First, measurement of body weight alone is now recognized to be an inadequate measure in experimental rodent studies to assess the effects of chemical exposure on adipocyte endpoints [243]. Second, the endocrine milieu of males and females is different, and thus it should be expected that sex-specific effects are often observed because of EDC
A
uthor Man
uscr
ipt
A
uthor Man
uscr
ipt
A
uthor Man
uscr
ipt
A
uthor Man
uscr
exposure, particularly for compounds that interfere with sex hormones. Third, the specific type of feed used in animal experiments can affect sex hormone levels in pregnant females and fetuses, and consequently result in significant differences in phenotype, including the potential to modify effects of chemical exposures [244, 245]. Indeed, natural diet components and EDCs may interact in several ways [246] .
One relevant challenge concerns the publication of apparently “conflicting” results on EDCs. Independent replication of results is the accepted standard for assessing validity of findings in research, thus the issue of non-replication of findings in some EDC studies must take into account the issues described above (sensitivity of endpoint, sex-specific effects, influence of animal feed), as well as the appropriate use of positive controls [247-249], [249, 250], and /or negative control groups [251, 252], and the range of dose levels used [219, 253]. There also appears to be a relationship between the source of funding and the
likelihood of identifying effects of EDCs [238, 249, 254]. Thus, rather than labelling results as “conflicting” the factors involved in the apparent failure to replicate certain findings should be assessed [247, 255].
4.2 EDC Exposures: Sources & Routes
As noted above, approximately 1000 chemicals have been identified that meet the criteria of an EDC [213, 222]. These compounds are used in a wide range of consumer products including food packaging, building materials, pesticides, clothing and upholstery, personal care products, detergents and other cleaning agents, thermal paper, plastics and medical equipment [210, 215, 227, 228, 256, 257]. Some chemicals used in industrial processes lead to unintended contamination of food, water and air. Thus, routes of exposure can include oral, dermal, and inhalation, as well as subcutaneous and intravenous (via medical equipment).
The US CDC’s National Health and Nutrition Examination Survey (NHANES) is a nationally representative biomonitoring program which assesses, among other things, exposures to environmental chemicals in the general population [258].The CDC has documented widespread exposures to a number of EDCs (e.g. [259-264]). Importantly, a large number of chemicals are not examined, and thus the number of exposed individuals, as well as the typical levels of exposure, remains unknown. Although the sampling of infants and young children is limited in the context of NHANES [265], other studies have revealed the presence of environmental chemicals in placenta, amniotic fluid and umbilical cord blood, documenting exposure throughout the most critical stages of development as well as across the lifespan (e.g. [266-272]).
4.3 Vulnerable Windows of Exposure and Metabolic Disorders
4.3.1 Gestation and neonatal development—The concept that adult diseases could have a fetal basis was highlighted by the work of David Barker who proposed a hypothesis, which was expanded to the Fetal Basis of Adult Disease and has now been restated as the Developmental Origins of Health and Disease (DOHaD) hypothesis [273] [274] [275]. The core DOHaD hypothesis is that there are critical windows during development, and environmental disruptions during these life stages can lead to subtle changes in gene
A
uthor Man
uscr
ipt
A
uthor Man
uscr
ipt
A
uthor Man
uscr
ipt
A
uthor Man
uscr
expression, tissue organization, or other levels of biological organization that lead to permanent dysfunction leading to increased susceptibility to disease. Unlike birth defects and neonatal diseases, these dysfunctions manifest later in life mostly as increased vulnerability to common diseases including obesity [276-278]. Barker and others showed that low birth weight (LBW) babies resulting from maternal malnutrition developed increased susceptibility to diseases in adult life including coronary heart disease, obesity, stroke, T2D, osteoporosis, increased blood pressure, dyslipidemia, impaired glucose metabolism and metabolic dysfunction (reviewed in [274, 279].
Barker’s focus on nutrition was preceded by the iatrogenic event involving the prescription of diethylstilbestrol (DES) to millions of women from the 1940s through the early 1970s to prevent miscarriage. Not only was DES shown to be ineffective, it increased the incidence of a rare cervical cancer. Animal studies confirmed it is a transplacental carcinogen and the effects, including other deformities of the reproductive tract and increased incidence of mammary cancer, shown to result from developmental exposure in animal models, have now been confirmed in human studies. The DES tragedy remains one of the best examples of the long-latency adverse health outcomes associated with fetal endocrine disruption and was a clear example of DOHaD, with adverse health outcomes associated with the alteration of normal endocrine function during development [280, 281].
The observation that alternations in human development affects the risk of
non-communicable diseases later in life is confirmed by epidemiology studies focusing on both nutrition and environmental chemical exposures [277, 282-284]. Developing organisms are extremely sensitive to perturbation by chemicals including EDCs because hormones and growth factors control development. Alterations of their levels during development by EDCs leads to tissues with abnormal gene expression, numbers of cells, location of cells,
imbalance between cell types, as well as altered organ structure and hormonal signaling that lead to increased susceptibility to disease/dysfunctions across the life course [282, 285]. Adverse effects may be most pronounced in the developing organism and occur at
concentrations of the chemical that are far below levels that would be considered harmful in the adult [286, 287]. Some of the reasons for this increased sensitivity include the fact that the protective mechanisms that are available to the adult, such as DNA repair mechanisms, a competent immune system, detoxifying enzymes, liver metabolism, and the blood/brain barrier are not fully functional in the fetus or newborn. In addition, the developing organism has an increased metabolic rate as compared to an adult, which, in some cases, may result in increased toxicity [287].
Another critically important reason for the increased sensitivity of the developmental period to EDCs (as well as nutritional deficits) is that epigenetic signaling regulates gene
expression which controls development. Epigenetic changes provide biochemical evidence of the deleterious effects of adverse conditions during development and subsequent disease including metabolic diseases [288]. Some aspects of epigenetic signaling (e.g.DNA
methylation, histone marks, chromatin remodeling and noncoding RNAs) are likely involved in the mechanisms responsible for altered programming of tissue development by EDCs that lead to obesity [289-291]. Since hormones and growth factors control development,
signaling errors caused by hormones expressed at the wrong time or concentration can cause
A
uthor Man
uscr
ipt
A
uthor Man
uscr
ipt
A
uthor Man
uscr
ipt
A
uthor Man
uscr
alterations in gene expression in tissues, and these abnormal expression patterns become permanent due to epigenetic signaling [291-293].
There are now credible data that supporting the claim that many chronic diseases including obesity, T2D and MetS can be linked to epigenetic changes in cells and tissues during development that manifest in altered tissue development as a result of early environmental factors ( stress, drugs, nutrition, environmental chemicals) [294-296]. Extensive data from animal and human studies show that developmentally induced disease outcomes often are not immediately apparent but manifest later in life [278, 297, 298].
There are now data that show that environmental factors can account for disruption of individual or multiple systems involved in metabolism depending on the timing of exposure. For example, exposure to a chemical during the fetal or perinatal period can permanently alter the functioning of mesenchymal stem cells and lead to disruption of adipocyte function [299]. Altered adipocyte function is likely to affect other organs/tissues due to hormonal and paracrine action. This brief chemical exposure might also impact differentiation of the pancreas, heart, brain, liver or any other component of the complex regulatory system impacting the various components of metabolic disease [276].
4.4 Obesogen Hypothesis Overview (historical)
In 2002, Baille-Hamilton wrote the first article relating environmental chemicals to obesity. Her article, “Chemical toxins: a hypothesis to explain the global obesity epidemic”,
suggested that the current obesity epidemic was associated with the increase in production of environmental chemicals [300]. She reviewed published studies showing associations between exposure to a variety of environmental chemicals, including some pesticides, solvents, plastics, flame retardants and heavy metals, and increased weight gain; because these studies originally focused on weight loss and toxicity, their effects on weight gain had gone unnoticed. In 2006, Grun and Blumberg, published their now classic paper, in which they coined the term “obesogen” followed by a 2009 review “Endocrine disruptors as obesogens” [301]. They noted the existence of chemicals that alter regulation of energy balance to favor weight gain and obesity and proposed that obesogens derail the homeostatic and reward mechanisms important for weight control, such that exposed individuals have increased susceptibility to weight gain despite normal diet and exercise.
The obesogen hypothesis makes two important points. First, susceptibility to obesity starts during development (in utero and the first few years of life). Second, susceptibility to obesity is due in part to the influence of a specific subclass of EDCs that alter developmental programming, and thus disrupt the set point for weight gain later in life.
"Obesogens" are defined functionally as chemicals that promote obesity by increasing the number of fat cells and/or the storage of fat in existing adipocytes. Obesogens can also act indirectly to promote obesity by shifting energy balance to favor calorie storage, by altering basal metabolic rate, by altering gut microbiota to promote food storage [302], and by altering hormonal control of appetite and satiety [303-307]. New obesogenic chemicals are being identified at an increasing rate. The obesogen field has recently expanded to include
A
uthor Man
uscr
ipt
A
uthor Man
uscr
ipt
A
uthor Man
uscr
ipt
A
uthor Man
uscr
chemicals that cause or lead to diabetes [308] as well as altered lipid metabolism and fatty liver [309].
4.5 The Metabolism Disrupting Chemical (MDC) Hypothesis
In 2015 the Parma Consensus Statement proposed that the Obesogen hypothesis should be expanded, considering newer evidence of chemicals that increased susceptibility to T2D, liver lipid abnormalities and MetS [310]. The Parma Statement proposed a name change to ‘metabolic disruptor hypothesis’, which we further propose should be termed ‘metabolism disrupting chemical (MDC) hypothesis’ to distinguish the role of chemicals from other metabolic disruptors such as nutrition and stress. The MDC hypothesis postulates that environmental chemicals have the ability to promote metabolic changes that can result in obesity, T2D or fatty liver in animals including humans; these metabolic alterations may play an important role in the global epidemics of obesity, T2D and MetS. In the study of liver disease etiology, the MDC hypothesis provides, for the first time, a framework for the integration of different etiology of steatohepatitis (ASH, CASH, NASH, and TASH). Alcohol, chemotherapeutic medications, fructose, dietary fatty acids, and industrial chemicals are all MDCs; while they disrupt hepatic metabolism differently the pathologic end result is the same [162, 163].
For the remainder of this manuscript we will focus on MDCs as chemicals that can alter any aspect of metabolism and describe the current state of the science.
5. MDCs and Metabolism-Relevant Diseases
5.1 Adipogenesis, Subsequent Weight Gain and Obesity
A number of MDCs have been shown to significantly alter the function (gene expression, hormone secretion) of white adipose tissue, adipose tissue mass (adipocyte number and/or volume), or body weight in animal models after developmental exposures (Figure 2). Epidemiological studies also support the identification of obesogenic MDCs [311, 312] and these studies focus mainly on weight gain and (body mass index) BMI as endpoints. This is typical for a new field, where the focus is on descriptive studies that show that a chemical can have an effect on an endpoint or disease of interest (e.g. weight gain). In many cases, effects of MDCs on adult adiposity and/or body weight are reported to be significant for only one sex, consistent with the sexually dimorphic responses that are a common feature of EDCs and thus MDCs [227].
Nicotine is an MDC where there are compelling data for its obesogenic properties from both animals and human studies [7, 313, 314]. Maternal smoking in pregnancy is a risk factor for subsequent obesity in offspring [315] even when exposure is limited only to early pregnancy [316, 317]. Although multiple mechanisms have been proposed, associations may be partly attributable to impaired fetal growth, which as Barker and colleagues noted is a risk factor for subsequent rapid growth and long-term obesity [318].
Developmental exposure in mice to DES [319] has also been shown to increase weight gain which is specific to females and does not appear until puberty [320]. In another study, prenatal exposure to DES resulted in an increase in number of adipocytes in the gonadal fat