SHOULD YOU SHOULD OTHERS: SUSTAINABLE MARKETING’S IMPACT ON BRAND PERCEPTION AND GREEN SPORTSWEAR CONSUMPTION.
Christopher Dean Karras
An honors thesis submitted to the faculty of the Kenan-Flagler Business School at the University of North Carolina at Chapel Hill.
Chapel Hill 2020
ABSTRACT Christopher Dean Karras
Should you should others: Sustainable marketing’s impact on brand perception and green sportswear consumption.
(Under the direction of Dr. Katrijn Gielens)
ACKNOWLEDGMENTS
This thesis provided an unparalleled learning experience and opportunity to explore my passion for sustainability in sportswear. My research would not have been possible without input, encouragement, guidance, and assistance from the following individuals.
Dr. Katrijn Gielens – Thank you for your guidance and willingness to serve as my research advisor. Your expertise and support made this project possible. I could not have asked for a better research mentor.
Dr. Kristopher Keller – Thank you for serving as a reader on this project. Your
assistance and advice related to both methodology and paper construction enhanced this project greatly.
Mr. Jeffrey Mittelstadt – Thank you for serving as a reader on this project. Your early input regarding stimulus advertisement creation shaped my approach. Your expertise and knowledge of the sustainability space added great value.
Dr. Patricia Harms – Thank you for your steadfast commitment to undergraduate business research at Kenan-Flagler Business School. Your support, advice, and guidance throughout the entire research process kept me marching forward. You not only served as a research expert, but an incredible open ear and shoulder to lean on when circumstances were difficult.
Dr. Kim Allen – Thank you for your unfailing support and guidance across all aspects of this research from start to finish. Your research mod helped me develop the seed for what is now this thesis. Thank you for always encouraging me to achieve at the highest level. Lingmei Howell & Phil Hardy -- Thank you for providing me with a phenomenal support structure throughout this research. Your encouragement kept me striving forward. The high standards displayed by you both motivated me to produce at my highest
potential.
Kenan Institute for Private Enterprise, Kenan Scholars Program, Karen
McFarland, & Mark Sillman – Thank you for graciously providing the funding for this research. The investment you collectively made provided me with the capability to produce valuable research results.
Fellow Kenan Scholars – Thank you for contributing to an environment defined by high-achievement, persistence, and hard work. I am inspired by the work we have jointly achieved this year.
Dr. Daniel Ringel – Thank you for your input and recommendations throughout my research process. I appreciate the interest you displayed regarding my research and your commitment to helping students succeed.
Dr. Breagin Riley – Thank you for your contribution to my methodology, particularly data analysis. Your input inspired several of the relationships investigated in this research.
Mom, Dad, Eleni, Sabrina, & Tony – Thank you for your constant encouragement over the past year. Thank you for reminding me that you believe in me and what I am doing. I could not have completed this project without you all.
TABLE OF CONTENTS
ABSTRACT...ii
ACKNOWLEDGMENTS...iii
LIST OF TABLES...viii
LIST OF FIGURES...ix
1. INTRODUCTION...1
Sportswear Overview...3
Industry Overview...4
Sustainable Sportswear...5
Personal Research Motivation...8
Thesis Roadmap...9
2. LITERATURE REVIEW...10
Sustainable Marketing: Consumer...12
Sustainable Marketing: Product...16
Sustainable Marketing: Brand...19
Sustainable Marketing: Messaging...21
Sustainable Marketing: Price...23
Conclusion...24 3. METHODOLOGY...26 Methodology Inspiration...26 Research Methodology...27 Operationalization...27 Independent Variables...28 Dependent Variables...29 Instrument Development...31
Stimulus Ad Development...33
IRB Approval...37
Distribution Strategy...37
Funding...38
Quality Assessment and Statistical Tools...38
Quality Assurance & Sample Composition...39
Statistical Evaluation Tools...42
Conclusion...45
4. RESULTS...46
Research Hypotheses...46
Factor Analysis...48
Test of Reliability...50
Univariate Analysis of Variance (ANOVA)...51
ANOVA Summary...62
Multivariate Analysis of Variance (MANOVA)...62
Conclusion...66
5. DISCUSSION...68
Significant Finding 1: Product Quality BY Claim...68
Significant Finding 2: Product Quality BY Stimulus Advertisement...69
Significant Finding 3: Perceived Price BY Brand...71
Significant Finding 4: Perceived Price BY Stimulus Advertisement...72
Significant Finding 5: Willingness to Recommend BY Claim...74
Significant Finding 6: MANOVA results...75
Nonsignificant Findings...75
Suggestions for Marketers...77
Limitations of Research...78
Suggestions for Future Research...79
Summary & Conclusion...81
APPENDIX D...86
APPENDIX E.1...93
APPENDIX E.2...95
APPENDIX E.3...97
APPENDIX E.4...99
APPENDIX F.1...101
APPENDIX F.2...102
APPENDIX F.3...102
APPENDIX G...103
APPENDIX H...104
APPENDIX I.1...105
APPENDIX I.2...106
APPENDIX I.3...107
APPENDIX I.4...108
APPENDIX I.5...109
APPENDIX I.6...110
APPENDIX J.1...112
APPENDIX J.2...113
LIST OF TABLES
Table 1. Combination of independent variables explored in this research, including the 12 stimulus ad types created through sum of brand and claim...28
Table 2. Six dependent variables applied to this research and inspirations for each...30
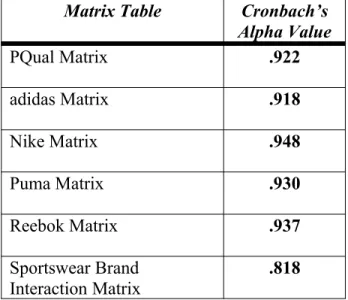
Table 3. Cronbach’s alpha calculation for each matrix table in survey instrument...51
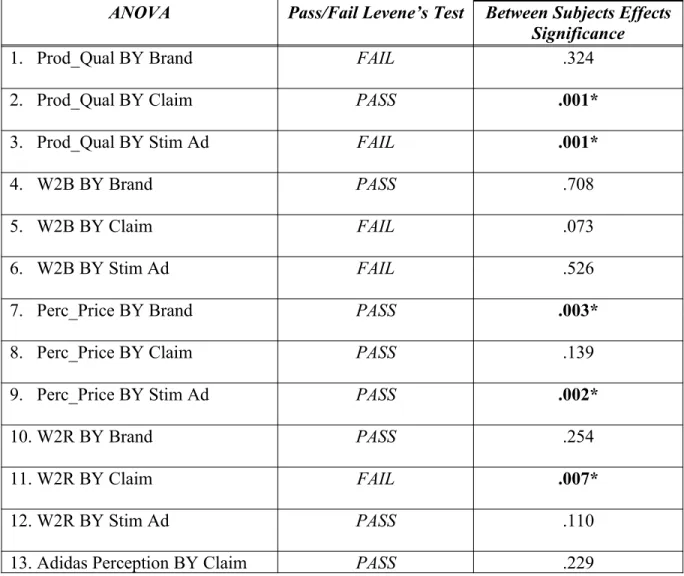
Table 4. Complete summary of ANOVA analyses with Levene's Test outcome and
significance values... 53
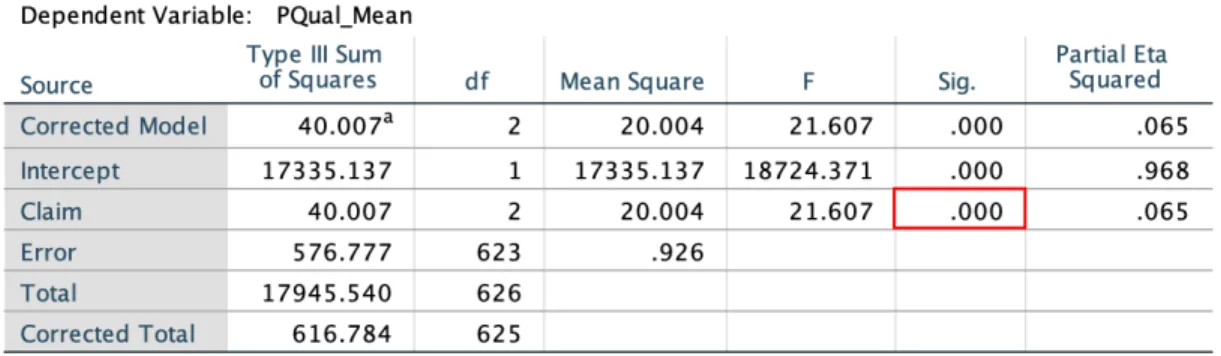
Table 5. Significant result of between-subjects effect test for PQual BY Claim...54
Table 6. Results of Tukey post hoc test displaying significant relationships for PQual BY Claim... 55
Table 7. Significant result of Welch’s Test for PQual BY Stimulus ad...55
Table 8. Significant result of between-subjects effect test for Perceived Price BY Brand...57
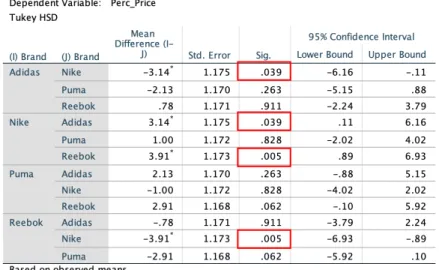
Table 9. Results of Tukey post hoc displaying significant relationships for Perceived Price BY Brand... 58
Table 10. Significant result of between-subjects effect test for Perceived Price BY Stimulus ad... 59
Table 11. Significant result of Welch’s test for W2R BY Claim...60
Table 12. Results of Tukey post hoc displaying significant relationships for W2R BY Claim ... 60
Table 13. Summary of significant findings from univariate analysis of variance, including respective significance levels... 62
Table 14. Significant Pillai’s Trace values of MANOVA (W2B, W2R, PQual, Perc_Price, Brand Perception BY Brand & Claim) between brand and claim on linear combination of five dependent variables... 63
Table 15. Results of between-subjects effects test displaying three statistically significant relationships... 64
Table 16. Significant Pillai’s Trace value for MANOVA (W2B, W2R, PQual, Perc_Price, Brand Perception BY Stimulus ad) between stimulus ad and linear combination of five dependent variables... 65
LIST OF FIGURES
Figure 1. Stern et al.’s model utilized by Kilbourne and Beckmann to suggest future sustainable marketing research. (Kilbourne & Beckmann, 1998; Stern, Dietz, & Guagnano, 1995)... 12
Figure 2. Example of self-beneficial and ethical stimulus ads utilized in Peloza et al.’s (2013) study... 15
Figure 3. Graph displaying the decrease in green preference as green premium increases across five industries (Miremadi, Musso, Weihe, 2012)...24
Figure 4. Adidas X Parley Ultraboost advertisements utilizing sustainable (left) and
utilitarian (right) claims... 27
Figure 5. Example of adidas Sustainable Assertive stimulus advertisement displayed to survey respondents... 34
Figure 6. Demographic quotas applied by Qualtrics to survey distribution and collection...38
Figure 7. Mean plot illustrating the difference in perceptions of product quality across claim type groups (dotted lines represent statistically significant relationships)...69
Figure 8. Mean plot displaying differences in perceived product quality across stimulus ad groups... 71
Figure 9. Mean plot showing differences in perception of Price across brand type groups (dotted lines represent statistically significant relationships)...72
Figure 10. Mean plot illustrating differences in perceived price across stimulus ad type groups... 73
1. INTRODUCTION
The concept of a “green revolution” has inarguably entered into the social consciousness. Much conversation often rotates around an unfavorable perspective on human behavior’s impact on the world. In 1962, Rachel Carson’s publication of The Silent Spring channeled a criticism of careless insecticide use to broadly challenge human interaction with environmental resources. Her work ultimately sparked a concern that led to the birth of the Environmental Protection Agency, creating a structure for deeper evaluation into what responsible interaction with natural resources may look like (Stoll, 2012).
study present valuable marketing insights that possess the capability to support both profit and sustainability driven initiatives in sportswear.
Since Rachel Carson’s critique, modern consumption practices have continued to expand at an astounding pace. Research into resource depletion substantiates the
troublesome claim that present resources fail to support consumption growth (Csikszentmihalyi, 2000). The often-reiterated example that mankind would need approximately four Earths to support a world population with western consumption behavior reveals a stark incongruency between collective behavior and resource reality (McDonald, 2015).
A multitude of factors have contributed to the current state, but marketing’s participation in promoting a “consumption mindset” should not go understated. (White, Habib, & Hardisty, 2019). In 2008, The American Marketing Association (AMA) revised the definition of marketing to include a focus on holistic value creation.1 Prior to this revision, marketing involved a set of practices solely focused on delivering simultaneous customer, organizational, and shareholder value (Gundlach & Wilkie, 2009).
The AMA’s recognition of marketing’s social impact both marks an ideological pivot point and a concession of a historically inadequate approach. Traditional marketing theory rewards consumption driven production and the cyclical desire to feed growing consumer demand. Companies and marketers have relied on a variety of faulty 1Current AMA definition of marketing: “Marketing is the activity, set of institutions, and processes for creating,
assumptions for years including endless resources, unlimited consumption, and infinite waste capacity (Kotler, 2011, p. 132). As principles of the “green revolution” have woven themselves into the social fabric, consumers have begun to incorporate new dimensions into their buying behavior, including increased standards for environmental and social responsibility (Gershoff & Frels, 2015). In a survey distributed by Boston Consulting Group, nearly a third of respondents claimed they had stopped purchasing certain brands based on concerns related to sustainability issues (Lehmann, Boger, Krueger, Schneider, Carrière-Pradal, & Schou, 2019). As a response, marketers have begun to adapt practices around the new assumptions of finite resources, limited waste capacity, and the inequality between quality of life and perpetual consumption (Kotler, 2011).
A cursory review of the market will reveal an increasing number of firms introducing sustainable or environmentally friendly products to their mix (Haws, Winterich, & Naylor, 2013). For example, Unilever’s Dove brand recently transitioned their product line to 100% recycled plastic bottles.2 This move followed the
of sustainable products will prove not only to generate positive environmental impact but also drive profits and improve brand attitude (Olsen et al., 2014).
Sportswear Overview
This thesis specifically narrows the scope of study to green product introduction within the sportswear industry. To give context for this particular selection, the following section provides a brief overview of the industry, prominent examples of sustainable sportswear, and the personal impetus for this research.
Industry Overview
global industry for sports and athleticwear constitutes a nearly $100 billion market growing at a predicted compounded annual growth rate of 3.4% (Reuters, 2019).
The largest competitors in the sportswear industry possess a disproportionate amount of market share, but new entrants provide parity to the giant-driven marketplace. As of 2018, Nike possesses around 18% of the United States sportswear industry,
followed by adidas and Under Armour with 6% and 4% respectively (CNBC, 2019). Among a survey of nearly 10,000 American teenagers, 23% listed Nike as their top clothing brand, while a similar survey revealed 27% of American adults preferred Nike against other sportswear competitors (Jaffray, 2019 & Statista, 2019).
Relevant competition to Nike includes Lululemon, Sketchers, Puma, Reebok, and a variety of other midsized competitors attempting to carve out a unique space. Newer entrants, such as Allbirds and NOBULL have experienced success through differentiated and specialized product lines supported by expert branding. Globally, the demand for sportswear resides heavily in the United States. 33% of the market for sportswear resides in America, but Asia represents the market with the most rapid growth in demand. Presently, China and Japan collectively own 17% of global market share (Kering, 2019). Sportswear’s growing demand and global significance position the industry as a unique area for marketing study.
Sustainable Sportswear
broad and rapidly growing fashion industry. In 2019, Boston Consulting Group, Global Fashion Agenda, and the Sustainable Apparel Coalition collaborated to create a report titled “Pulse of the Fashion Industry” which provides a clear look into the industry’s sustainability problems. The report assigns a “Pulse Score”, which represents the
industry’s environmental and social performance3. As of 2019, the industry’s score ranks 42 of a possible 100 points, representing a four-point increase since 2018. Unfortunately, this meager growth rate fails to keep pace with the rapidly expanding fashion industry experiencing annual growth rates nearing 5% (Lehmann et al., 2019). The Pulse Report summates the potential consequences of the industry’s inadequate growth in the
following way:
Without growth in environmental and social practices through scaling up existing sustainable practices, adopting more efficient business models and implementing transformative changes, the gap between the growth of the industry and the Pulse Score will widen further. This could have a dire effect on the long-term environmental, social and financial prosperity of the industry and planet (Lehmann et al., 2019, p. 2).
This excerpt clearly communicates the needed urgency for increased sustainable practices in the fashion and sportswear industry.
Annual sustainability reports provide an even more nuanced perspective into how sportswear firms approach the specific sustainability concerns of the industry. For
outlines their successes in minimizing waste creation, water and energy usage, carbon emissions, and chemical utilization (Nike, 2019). The company frames these
achievements and goals in a product-centric fashion. Sustainable material innovation combined with green product introduction serve as key strategies for sustainability growth across firms in the sportswear industry. The following three timely examples represent sustainable sportswear in the marketplace.
Adidas x Parley Collaboration: Threat into Thread
In 2015, adidas partnered with non-profit Parley for the Oceans to help turn “threat into thread (Adidas, 2019).” Initially announced as part of adidas’s Futurecraft series, the company utilizes ocean plastic waste from around the world intercepted by Parley to manufacture a unique form of polyester yarn. A multitude of products created from Parley Ocean Plastic have been launched, most successful of these the adidas Ultra Boost. According to adidas, the company placed a goal of producing 11 million pairs of footwear with the advanced material in 2019, representing an annual increase of 6 million units. The partnership has prevented an estimated 2,810 tons of plastic waste from entering the ocean in five years (Morgan, 2019).
upcycled into a new pair. With the Loop’s tentative 2021 release, adidas takes yet another radical step in shaping “the future of the planet” through sportswear.
Nike Space Hippie: These Sneakers are Trash
There is no resupply mission to Earth. This is the tagline for Nike’s new Space Hippie line, which illustrates the company’s commitment to waste reduction and circular product lifecycles. Recognizing the degradation of Earth’s resources, Nike has chosen to launch a unique line of sustainable footwear in 2020 made primarily from recycled manufacturing waste. The line takes inspiration from life on Mars, where “materials are scarce and there is no resupply mission (Nike, 2020).” According to Nike Chief Design Officer, John Hoke, the Space Hippie Line “attacks the villain of trash” and has altered the way Nike looks at product creation, materials, and aesthetic (Jones, 2020). The line marks a strong stance from Nike on the creation of a circular economy and the
importance of sustainable sportswear.
The Reebok Forever Floatride GROW: Plant-based Performance
What if instead of recycling we reimagined? In Fall 2020, Reebok will launch the first fully plant-based performance running shoe, the Forever Floatride GROW. This unique piece of footwear utilizes a eucalyptus based upper, algae sockliner, natural rubber outsole, and castor bean midsole. The product represents Reebok’s belief that the brand has a responsibility to drive positive impact on the planet (Buco, 2019).
“Our consumers have told us they want more sustainable products, and the running community has been the most vocal and passionate on this issue. We want to help runners perform at their best, while also feeling good about the products they wear (Buco, 2019).”
Reebok’s investment beyond material recycling displays a genuine commitment to sustainable product leadership and exemplifies the burgeoning market for sustainable sportswear.
Personal Research Motivation
I am a socially and environmentally conscious consumer hopelessly in love with the sportswear industry but constantly convicted by the part sportswear plays in
exhausting Earth’s resources. Maybe this combination of diverging characteristics is what piqued my interest in 2015 when I first saw a prototype for the adidas x Parley Ultra Boost.
Throughout the last five years, I have tracked the growth of sustainable
sportswear both in supply and demand. As displayed above, the sportswear industry has reached a critical mass in size and growth. The environmental impact of the industry arrived at a material point long ago, and firms must act radically to combat negative impacts on our Earth. Thankfully, now more than ever, sportswear firms across industry have begun to communicate their commitment to sustainability through green product introduction.
practices of sustainable marketing. This shift in marketing mindset mirrors a larger migration from Marketing 2.0 to Marketing 3.0 principles. Strategies that only incorporate emotional and functional criteria no longer meet the needs of many consumers adding a third variable to buying decisions, sustainability (Kotler, 2011). Thesis Roadmap
Resource depletion reflects a much broader issue imbedded in a broadly shared consumption mindset. Traditional marketing has, at the least, played a complicit role in developing and spreading this mentality. With changing tides, consumers are beginning to alter their consumption practices. In order to stay afloat, marketers must proactively evolve with consumers. The rapid introduction of sustainable sportswear represents a primary strategy of evolution within the sportswear market, an industry which has
historically struggled with sustainability. Shockingly, no body of literature summates best practices for introducing and messaging these new product types.
This thesis provides a first look at the impact of different messaging for sustainable sportswear on consumers’ perception of product and brand. The following discussion provides a summary of current sustainable marketing literature published in leading academic journals of marketing followed by a detailed description of this research’s use of an experimental survey methodology. This thesis concludes by
2. LITERATURE REVIEW
A robust and broad conversation around sustainable marketing has developed in marketing literature over the past two decades. Sustainable marketing interacts with concepts developed in social marketing theory, the “theory and practice of marketing an idea, cause, or behavior (Kotler, 2011).” For the purposes this research, sustainable marketing is defined as the marketing of sustainable products, practices, behaviors, or values by an organization. The following section discusses and compares prominent sustainable marketing literature published in the leading academic marketing journals. The analysis of this literature is divided among five dimensions of sustainable marketing: consumer, product, brand, messaging, and price.
Sustainable Marketing History
A contextual historic understanding of sustainable marketing literature is valuable prior to evaluating current research. The following section provides a brief description of sustainable marketing’s past.
Beckmann’s review, although dated, remains pertinent in evaluating the history and current state of sustainable marketing research.
The early stream of sustainable marketing literature involved an attempt to understand and segment the “green” consumer. Research included demographic dissection of the green consumer base and several attempts to understand how
consumers’ levels of environmental awareness impacted behavior. Overall, the results of these various studies proved generally inconclusive and often contradictory. Throughout the 1980’s and early 90’s, research continued to focus on the individual consumer, but researchers began to include specified elements of consumer motivation in their studies. 1995 marked a pivot point for green marketing research with the publication of multiple studies that elevated beyond a simple focus on consumer segmentation. These studies questioned the impact of belief and value systems and evaluated the effect of institutional aspects (Kilbourne & Beckmann, 1998). Kilbourne and Beckmann categorize the
majority of research prior to 1998 as limited by a managerial focus and overly fixated on developing an understanding for the green market segment.
Figure 1. Stern et al.’s model utilized by Kilbourne and Beckmann to suggest future sustainable marketing research. (Kilbourne & Beckmann, 1998; Stern, Dietz, & Guagnano, 1995)
Ecological Paradigm in social-psychological context. The framework outlines the
division between micro and macro topics of environmental research. Most, if not all, of
sustainable marketing research prior to 1998 falls
into the micro topics of behavior and behavioral
intentions.
Following Kilbourne and Beckmann’s critique, a more complex conversation surrounding sustainable marketing principles has developed in the academic literature. Whether this conversation has fully adopted an interdisciplinary approach addressing macromarketing concepts remains to be seen. The following analysis of sustainable marketing literature picks up where Kilbourne and Beckmann left off and discusses the topics of consumer, product, brand, messaging, and price.
Differences between consumers act as a common thread underpinning sustainable marketing research. Early sustainable marketing literature focused almost solely on better understanding the characteristics of the so called “green consumer” (Kilbourne &
Beckmann, 1998). With the explosion of green products observed today, a cursory understanding of general consumer characteristics does not empower marketers with sufficiently valuable decision-making information (Peloza, White, & Shang, 2013) (Olsen et al., 2014). Instead, a deeper understanding of the mechanisms driving consumer behavior is vital. The following section evaluates modern approaches to understanding the consumer psychology of green consumption including: green consumption values, the intention-behavior gap, concepts of willful ignorance, and the green price premium.
In 1976, George Brooker published The Self Actualizing Socially Conscious Consumer. His research represented an early attempt at evaluating the psychology of
green consumption. Brooker suggested that levels of sustainable consumption directly correlated with a consumer’s status on Maslow’s hierarchy of needs (Brooker, 1976), specifically progress in the process of self-actualization. According to Brooker’s research, consumers presenting higher levels of self-actualization more readily adopt “ecology-related” products. This consumer preference reflects an individual with fewer psychological needs that can more easily sacrifice for the greater good (Brooker, 1976).
Intriguingly, most research does not suggest the psychological components of the green consumer. Researchers Haws, Winterich, and Naylor help supplement the understanding of sustainable consumers through their six-item measure, the GREEN scale.5
The GREEN scale includes constructs such as personal concern for environmental damage, degree to which purchasing decisions add to environmental strain, and
willingness to endure inconvenience for environmental benefit (Haws, Winterich, & Naylor, 2013). On average, “GREENER” consumers displayed an increased affinity for environmentally friendly products (EFP). Interestingly, the increase occurred as a result of positive evaluations for the non-environmental aspects of EFPs. Haws et al. also discovered that consumers with high GREEN scores typically practiced frugality over personal resources such as financial assets. The holistic approach to conservation reflects a broader potential belief system for GREEN consumers (Haws et al., 2013). In total, the GREEN scale provides insight into some foundational principles of sustainable
consumption.
Although theoretical research exposes common traits held by green consumers, in the marketplace an incongruency between intention and behavior often stunts sustainable consumption for even the greenest consumers. This disconnect is commonly referred to as the intention-behavior, or attitude-behavior, gap. Consumers often intend to act upon pro-environmental beliefs but ultimately fail to do so when faced with consumption decisions (White et al., 2019). Even consumers that outwardly report positive attitudes
towards sustainable behavior often fail to behave in congruence with their beliefs. The intention-behavior gap addresses a broader observation of incongruency outside of sustainability, but the concept proves particularly effective in describing behavior
observed in sustainable resource consumption (Fennis, Adriaanse, Stroebe, & Pol, 2011). Activating the self-accountability of consumers is one potential strategy in
overcoming the intention-behavior gap for sustainable consumption. Reflected by the overuse of assertive claims (Kronrod et al., 2012), marketers frequently struggle to generate buy-in for ethical products in the correct way. Research conducted by Peloza, White, and Shang suggests that creating a situation that cues consumers to the
inconsistencies between their intention and behavior increases preference for sustainable products. Consumers possess an innate desire to live up to internal standards, such as environmental conservation, but often fail to bridge the gap.
Interestingly, when Peloza et al. combined ethical appeals with “guilt-arousing messaging” consumers reacted negatively. Research discussing consumers’ desire to retain a feeling of power and control may suggest why explicit guilt appeals fail (Kronrod et al., 2012).
The willfully ignorant memory effect provides another potential explanation for the common discrepancy between intention and behavior. Research displays a common unintentional misrepresentation of consumers’ ethical purchasing decisions (Reczek, Irwin, Zane, & Ehrich, 2018). Consumers display a tendency to misremember previous unethical purchases and over remember the positive attributes of ethical purchases leading to an inflated sense of ethical consumption. Reczek et al. conclude that consumers may feel a right to consume unethically in the present because of their exaggerated past ethical consumption. As a result, consumers facing negative ethical
product information may forget or misremember the information when determining product preference.
Consumers that succumb to the willfully ignorant memory effect also tend to judge more ethical consumers (Zane, Irwin, & Reczek, 2015). Zane et al. propose that the social comparison between willfully ignorant and ethical consumers promotes an inherent threat to self-concept. In response to this threat, willfully ignorant consumers tend to negatively judge their ethical peers. The concept of willful ignorance provides potential psychological insight into mechanisms behind the intention-behavior gap and contributes to the conversation of complex interaction between consumers.
Sustainable Marketing: Product
The following section first evaluates product type as an important variable in sustainable marketing success and then proceeds to mention potential consumer perception impacts of green product component centrality.
and yogurt. In one-to-one comparison, vice-related GNPIs benefit brand attitude at a greater rate than virtue-related GNPIs (Olsen, Slotegraaf, & Chandukala, 2014).
These findings supplement research indicating product type as a significant variable in consumer’s response to organic claims (Van Doorn & Verhoef, 2011). Olsen et al.’s research suggests that product line extension through GNPIs may be a particularly valuable strategy for “vice-related” brands. These findings do not however suggest the exclusive use of GNPIs among only “vice-related” brands, but instead denote a difference between groups regarding the goal of specifically driving brand attitude.
Similar to the differentiation between virtue and vice, research investigating product attribute strength promotes a potential difference between “strength” and “gentleness-related” product attributes (Luchs, Naylor, Irwin, & Raghunathan, 2010). While attribute strength refers to the perception of a product constructed in its
presentation, the concept is often inherently tied to product category or type. As an example, motor oil would most likely fall into a “strength-related” product attribute grouping due to perceptions and expectations tied to product type.
Luchs et al.’s research establishes the general tendency of consumers to associate higher product ethicality with “gentleness-related” attributes. As a result, the impact of sustainability, an example of product ethicality, on consumer product preference
preference increases when consumers value “gentleness-related” attributes. Luchs et al. refer to this phenomenon as the “sustainability liability” and found that intentional strength cues mitigate the negative impacts of sustainability focus (Luchs et al., 2010). Luchs et al.’s findings provide nuance to Olsen et al.’s discussion of virtue versus vice related GNPIs and suggest the complexity of product type as a pivotal variable in green product introduction.
While product type may impact consumer perception for green products, the concept of green component centrality possesses the capability to alter consumer perception of product “greenness” altogether. The principle of component centrality refers to the perceived importance a particular component plays in overall product operation. For example, a vehicle’s steering wheel would possess high component centrality. Research by Gershoff and Frels explains that centrality plays a significant role in the perceived greenness of a product (Gershoff & Frels, 2015). Their research utilizes a computer’s CPU motherboard and sound card to test perceptions of product greenness. Consumers perceived the computer as greener when the CPU motherboard, a component possessing high product centrality, was advertised as being made from recycled
Gershoff and Frels’s findings, when combined with Luchs et al. and Olsen et al.’s research, paint an interesting picture on the impact of product type and product
composition on green product success. Clearly, not all green products behave the same, and certain products may be better candidates for sustainable qualities than others. Within multi-component products, the selected green component could substantially impact perceptions of overall greenness. The majority of current research investigating the impact of product type utilizes consumer good products, specifically food and drink, as the basis for study (Newman, Gorlin, & Dhar, 2014; Olsen et al., 2014). This research expands the conversation of product type impact by specifically focusing on sportswear, an important product type interacting within the broader fashion industry.
Sustainable Marketing: Brand
Understanding the product-side complexities of green product introduction, what incentives potentially motivate brands to bring sustainable products to market? The following section describes GNPI’s overarching positive effect on brand, contextualized by the potentially volatile impact of genuiness and intentionality perceptions.
Olsen et al. in their article Green Claims and Message Frames reveal the power of GNPIs for shaping desired brand outcomes. Based on a macro-analysis of nearly 3,000 green product introductions, their research concludes that GNPIs create a positive impact on brand attitude. Interestingly, the process of communicating GNPIs to consumers can lessen or strengthen the change on brand. A rising number of green claims associated with a GNPI negatively impacts the change. The researchers provide the assumption that consumers may become skeptical or overwhelmed by excessive green claims. These findings support green product introduction as a useful strategy in not only driving revenue but influencing brand perception in the mind of the consumer. In addition, these findings suggest particularly relevant insights for sportswear brands, an industry driven by two companies ranking in the top 100 for global brand value (BrandZ Report, 2020).
In theory, all companies possess the capability to benefit from GNPI, but in reality, consumers often question company motive. Company intention for green product introduction provides further complexity to consumer preference. According to Newman, Gorlin, and Dhar, consumer willingness to purchase decreases when a company
Newman et al.’s research interacts with and supports a broader body of literature discussing corporate social responsibility’s (CSR) and perceived intention. At a
foundational level, GNPI represents an extension of CSR activity through a company’s product line. Research substantiates CSR’s sweeping positive potential including generating, favorable stakeholder attitudes, positive brand image, and strengthened stakeholder relationships (Du, Bhattacharya, & Sen, 2010). Interestingly, similar to Newman et al.’s research, consumer perception of company intentionality impacts acceptance for CSR related efforts. Consumers tend to attribute two types of motives to CSR: “self-interested” and “altruistic” (Steenkamp, 2017, p. 226). Consumers perceive “self-interested” CSR to include actions solely taken for performance related purposes. On the other hand, “altruistic” CSR efforts grow from a genuine desire to behave in a fashion that benefits society. Not surprisingly, CSR perceived as genuinely altruistic tends to accomplish positive brand and relational benefits, while CSR viewed as strictly “self-interested” fails to capture these same advantages (Steenkamp, 2017) (Du et al., 2010). Corporate social responsibility, including GNPI, possesses the ability to add tremendous brand value, but a company’s approach to CSR must be strategically crafted to bolster positive associations among consumers.
immense complexity related to sustainable product introduction. This thesis helps to address the complexity by specifically focusing study on sustainable sportswear introduction, a topic with valuable implications yet to be researched.
Sustainable Marketing: Messaging
When introducing a green product to consumers, what messaging strategies prove most and least effective in generating consumer buy-in? The following section focuses on the influence of assertive versus gentle phrasing and joint appeal application on
optimized sustainable product messaging.
“It is your responsibility to help save the environment!” While potentially an extreme example, marketers employ similar assertive green claims frequently. On average, marketers utilize assertive strategies for green claims over 50% of the time, while general consumer good products adopt gentle phrasing in nearly 80% of all claims (Kronrod, Grinstein, & Wathieu, 2012). Research conducted by Kronrod, Grinstein, and Wathieu suggests that assertive claims may convince consumers under a specific set of circumstances, despite prevailing research that assertive green claims deter consumers by invading concepts of freedom and power.
Consumer response to assertive claims depends on perceived importance of a topic or issue. Kronrod et al.’s research investigated topics such as ocean related
this thesis’s methodology. The general perceived importance of ocean related issues among respondents produced greater acceptance for assertive green claims. Respondents were more willing to accept an assertive claim when they personally perceived the topic as serious. Important to note, consumers ranking higher in overall environmental concern typically present higher levels of perceived importance. Assertive claims produce a negative average effect on consumers with lower perceived importance, therefore, marketers should utilize broad assertive claims cautiously (Kronrod et al., 2012).
Sustainable messaging stretches beyond assertive and gentle phrasing and interacts with conversation surrounding the cost benefit analysis of green consumption. Much research subscribes to an economic model in which green products must provide equal functional value to traditional products (Meyer, 2001). On the contrary, some position consumption as a battle between the “want” and “should” selves or idealistic and pragmatic self, where consumer’s sustainability beliefs play a key role in purchasing decision (Martenson, 2018). Research examines strategies to effectively message green products through intrinsic, extrinsic, and joint appeals.
product. Consumers may interpret the joint appeal as an expression of the company’s divided environmental concern. Attributing joint appeal failure to company intention mirrors Newman et al., Du et. al. and Steenkamp’s discussion of company motive.
Interestingly, joint appeals do not always fail. Consumers with lower levels of sustainable consumption tend to react positively to joint appeals. Combined intrinsic and extrinsic claims heighten green product preference for these consumers (Endinger-Schons et al., 2018). Similar to Kronrod et al.’s findings, traditional green consumers and non-green consumers require unique messaging approaches.
Messaging strategy plays a major role in consumer acceptance of sustainable products. In general, consumers typically accept assertive claims for topics of high perceived importance. A relationship exists between consumer’s self-perceived level of environmental or social concern and openness to assertive green claims. Assertive claims must be strategically and carefully utilized because of their ability to negatively impact consumer preference. The struggle between intrinsic and extrinsic motivation for green products also interacts with concepts of self-perceived concern. Ultimately, the
application of assertive versus gentle claims and joint versus individual appeals relies on an intimate understanding of consumer beliefs and behavior. This thesis broadens the discussion surrounding green product messaging by investigating different approaches for the sportswear context.
One final concept that interacts with sustainable consumption is a negative response to increasing green price premiums. Referencing the economic model of sustainable consumption, price plays a crucial role in determining purchasing decisions (Meyer, 2001). Interestingly, market research reveals an increasing willingness to pay for sustainable offerings up to a point (White et al., 2019).
Figure 2. Graph displaying the decrease in green preference as green premium increases across five industries (Miremadi, Musso, Weihe, 2012)
Conclusion
Sustainable marketing literature has substantially grown and evolved since Kilbourne and Beckmann’s critique in 1998. The locus of study has migrated from defining the green consumer to determining best methods of encouraging sustainable consumption. This review of literature outlined the complexities of sustainable marketing from five angles: consumer, product, brand, messaging, and price. In summary, both product type and composition impact perceptions of greenness and consumer preference. Green new product introductions possess the capability to drive positive brand growth, but concepts tied to intentionality and genuiness complicate both CSR efforts and sustainable marketing. The way in which marketers express sustainable claims must be strategically selected based on an intimate understanding of consumer behavior and preference. Lastly, green consumption clashes with hurdles like the intention-behavior gap, but creative and informed marketers can capitalize on a growing group of consumers willing to pay increased prices for sustainable products by applying strategies for
This thesis addresses a gap in sustainable marketing literature for research into the marketing of sustainable sportswear. As evidenced in this thesis’s introduction,
3. METHODOLOGY
The following section outlines the methodology implemented in this study, including a discussion of the method’s inspiration, operationalization, instrument development, distribution strategies, and statistical evaluation techniques.
Methodology Inspiration
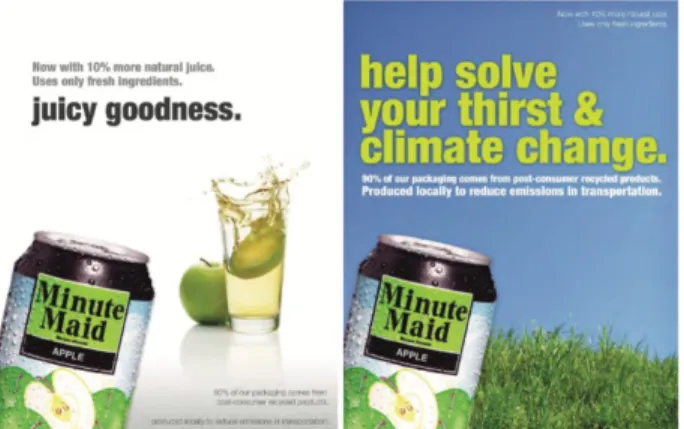
In 2017, adidas began a strong media push for their fresh collaboration with Parley for the Oceans. Adidas invested substantial resources in digital advertisements for the adidas Parley Ultra Boost. Surprisingly, many of these advertisements failed to mention the sustainable components of the product. In some cases, adidas even produced two nearly identical advertisements, one mentioning sustainable product qualities while the other solely utilitarian dimensions (Figure 4). Moreover, minimal sustainable messaging was provided on the product and packaging. In theory, a not-so-involved consumer could have very easily purchased this product without knowing of its sustainable qualities.
At the time, this strategy was confusing and felt counterintuitive. Why would a company invest resources in building a differentiated product and then undersell the key point of differentiation? Why is adidas not doubling down on the greenness of their new
Figure 3. Adidas X Parley Ultraboost advertisements utilizing sustainable (left) and utilitarian (right) claims R esearch Methodology
To address the research question in this context, this thesis utilizes an
experimental consumer perception survey including twelve uniquely crafted stimulus advertisements which vary across brand and claim. This approach was inspired by work published in the Journal of Business Research titled, “Factors affecting sportswear buying behavior: A comparative analysis of luxury sportswear.” Within this work, researchers utilized an experimental survey to study the impact of luxury co-branding on consumers’ sportswear purchasing behavior (Lim, Kim, & Cheong, 2016). The primary experimental aspect of their research involved exposing respondents to a series of stimulus advertisements which varied across brand
Operationalization
One of the most vital steps following the selection of experimental survey
methodology was operationalization. This process involved selecting the variables which comprise the differences across experimental groups and determining the desired
dependent, and took inspiration from sustainable marketing literature. The following discussion describes the process and reasoning behind variable selection.
Independent Variables
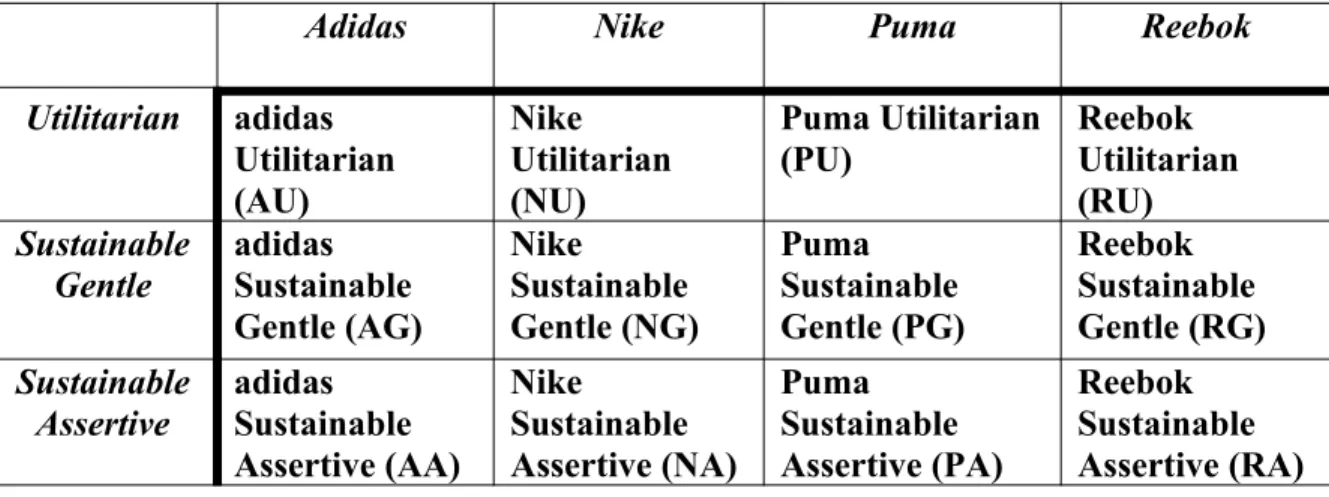
For the purposes of this research, each of the twelve stimulus advertisements included represent separate independent variables. Table 1 displays the matrix of independent variables utilized. As displayed, each of the twelve internal combinations equal the sum of a brand and claim.
Table 1. Combination of independent variables explored in this research, including the 12 stimulus ad types created through sum of brand and claim
Adidas Nike Puma Reebok
Utilitarian adidas Utilitarian (AU) Nike Utilitarian (NU) Puma Utilitarian (PU) Reebok Utilitarian (RU) Sustainable Gentle adidas Sustainable Gentle (AG) Nike Sustainable Gentle (NG) Puma Sustainable Gentle (PG) Reebok Sustainable Gentle (RG) Sustainable Assertive adidas Sustainable Assertive (AA) Nike Sustainable Assertive (NA) Puma Sustainable Assertive (PA) Reebok Sustainable Assertive (RA)
estimated brand value of $36,800 M while Reebok rounds out the top ten with a value of $800 M (Forbes, 2019). The characteristics of these brands both provided a reasonable basis to assume generalizable brand familiarity while representing different sized players in the market. In addition to scale and familiarity, each of these four brands actively pursue sustainable sportswear introduction as represented in the examples provided earlier. The combination of these qualities helped to construct a realistic experimental setting representing middle to upper-market players most likely recognized by members of the general consumer base.
Similarly, the varying claim types took inspiration from marketing literature. As mentioned above, adidas’s use of both utilitarian and sustainable product claims served as the initial catalyst for this research. In constructing the dimensions of claim, this broad differentiation addressed an initial curiosity as to what approach proves most effective. In other words, should brands focus on the sustainable or functional aspects of a sportswear product? Additionally, the comparison of utilitarian to sustainable claims interacts with
Dependent Variables
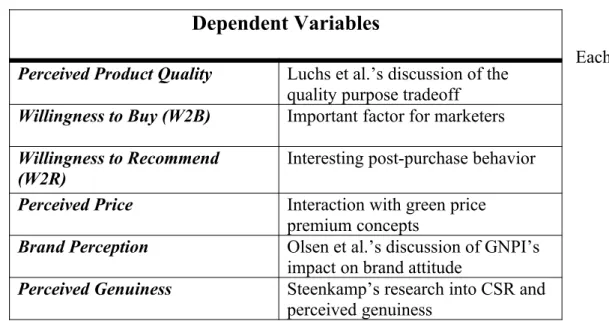
The strategy for dependent variable selection relied heavily on interests developed during academic literature evaluation. Each variable ultimately represents an important factor for marketers, as facilitating applicable best practices is a primary goal of this research. The following table summarizes the dependent variables selected and the respective inspiration for each choice.
Table 2. Six dependent variables applied to this research and inspirations for each
Each
dependent variable represents a specific product or brand-centric concept of importance. Perceived product quality, W2B, W2R and perceived price attempt to capture a specific independent variable’s impact on the perception of a product. From pre-purchase
perception —product quality and price— to purchase intention —W2B— and ultimately
Dependent Variables
Perceived Product Quality Luchs et al.’s discussion of the quality purpose tradeoff Willingness to Buy (W2B) Important factor for marketers Willingness to Recommend
(W2R) Interesting post-purchase behavior
Perceived Price Interaction with green price premium concepts
Brand Perception Olsen et al.’s discussion of GNPI’s impact on brand attitude
interaction with a product. Additionally, the variables interact with concepts discussed extensively in literature, such as the “green price premium” and the quality to purpose tradeoff often observed in CSR related efforts (White et al., 2019; Newman et al., 2014).
The variables brand perception and perceived genuiness attempt to address a sustainable product’s ability, or lack thereof, to impact perceptions of brand. Brand perception was derived from Olsen et al.’s findings related to green new product introductions’ (GNPI’s) ability to positively affect brand attitude. Lastly, the variable perceived genuiness takes inspiration from Steenkamp’s research regrading CSR efforts and consumer perception of genuiness. In total, these variables attempt to address the question, “does the marketing approach to sustainable sportswear introduction potentially alter a consumer’s perception of brand?”
Each variable involved in this study was selected for a specific purpose, and most choices reflect an interest developed in sustainable marketing literature. Variable creation proved an important first step in solidifying the concepts which ultimately build the experimental aspect of this study. A multitude of different variables could have been added to this evaluation, but resource constraints prevented expansion.
Instrument Development
Survey Structure & Development
The survey instrument created for this study consists of three distinct sections: pre-ad screening, random advertisement introduction, and post-ad perceptions. All questions included in the instrument utilize force response validation to avoid missing data. Please see Appendix D for a full-length copy of the survey instrument created and distributed to respondents.
The pre-ad section begins the survey and includes a confirmation of informed consent followed by seven general screening questions and four sportswear purchase history questions. The screening questions help to identify respondents that fit Qualtrics’s quotas for population representation in addition to filtering out unqualified respondents. Sportswear purchase history questions provide insight into each respondent’s purchasing history, frequency of interaction, and reason for purchase.
Following the pre-ad section, respondents interact with a prompt instructing them to “read and inspect” the following advertisement. Qualtrics’s randomizer tool then displays one of twelve uniquely crafted stimulus advertisements. These stimulus ads represent the twelve independent variables shown in Table 1. This point in the survey marks the beginning of the experimental component. Each stimulus ad includes a timing element that requires respondents to view the ad for a minimum of ten seconds and a maximum of thirty seconds.
dependent variables displayed in Table 2. First, respondents receive a series of questions formatted in a matrix table estimating perceived product quality. All matrix tables throughout the survey use a seven-point Likert scale ranging from very strongly disagree to very strongly agree. The elements of this matrix table were selected based on four measures of quality: performance, value, aesthetic, and production.
Next, respondents express purchase intention (W2B), perceived price, and
willingness to recommend (W2R). Then, based on the brand assigned through the random stimulus ad received, respondents encounter a matching brand matrix including: a brand familiarity question, a brand perception table, and a perceived genuiness table. As an example, if a respondent randomly received the Puma Sustainable Gentle ad, Qualtrics’s display logic tool would then present a Puma familiarity question, brand perception table, and perceived genuiness table. Lastly, respondents receive a final matrix table,
sportswear brand interaction, which attempts to better understand brand’s impact on their typical purchasing behavior followed by questions asking respondents to self-rate their level of environmental and social concern.
Brand Strategy provided the framework for the perceived genuiness tables. In addition to
utilizing these pre-tested scales, the instrument received feedback from a variety of sources. Dr. Katrijn Gielens and Dr. Jan-Benedict Steenkamp provided feedback on the specific items from a methods standpoint, while Teresa Edwards of The Odum Institute provided consultation on survey design and respondent friendliness.
Stimulus Ad Development
Similar to the construction of the survey instrument, the design of each stimulus advertisement required a specific process including multiple iterations supported by anecdotal and academic research. Stimulus ad development included three separate components, overall design, claim verbiage, and brand placement. The ultimate goal for each stimulus ad was to maximize the probability of a respondent reading the respective claim and observing the presented brand. These two goals play a crucial role in the experimental aspect of the survey. If a respondent failed to read the claim or observe the brand, the true impact on each dependent variable would be questionable. The following steps represent efforts taken to maximize the utility of each stimulus ad.
The overall design of each stimulus ad was optimized through comparison to real market examples and exposure to informal focus groups. Each stimulus ad was
Figure 4. Example of adidas Sustainable Assertive stimulus advertisement displayed to survey respondents
a design standpoint, each of the 12 stimulus ads appeared identical with only brand and claim changing.
were included in the advertisement to minimize the impact of design preference across respondents. The name of the product, The Perfect Shirt®, helped to add further validity to the realism for each advertisement, as most brands will provide a novel name for new products. Lastly, the dark color underneath the white claim text was inspired by design research on contrast and readability. Researchers Arthur and Passini published a widely utilized method for calculating contrast difference in their 1992 book Wayfinding: People, Signs, and Architecture. Within their model, white text on a black background
ranks as the highest possible contrast score (Arthur & Passini, 1992). Each advertisement leverages this design concept to increase probability of claim observation.
In order to validate the realism of each ad, an informal digital focus group of thirty individuals was enlisted for feedback. The same advertisement was sent to all participants with the open-ended prompt “what do you think of this advertisement?” The focus group expressed near universal approval for the realism of the advertisement.
Each of the three claims utilized across advertisements went through a similar iterative process based on anecdotal and academic research. Ultimately, the following three claims were selected:
Utilitarian – “Made with innovative moisture-wicking material to keep you dry and comfortable”
Sustainable Assertive – “You should make an environmental difference. Made with 100% recycled plastic”
The Utilitarian claim’s composition was derived from market research. Each brand’s comparable athletic shirt was located on their respective websites. Commonly recycled phrases and words used to describe the product were noted and included. Interestingly, every brand mentioned a “moisture-wicking material” in some fashion and the product’s ability to provide dryness and comfort6. These frequently used product descriptors were combined to form the Utilitarian claim. Leveraging genuine market product claims helped to once again support ad realism.
The two sustainable claims leverage ideas gleaned from market and academic research. The common claim referencing the product’s 100% recycled plastic
composition was created to mimic the primary sustainable product claim currently made in the market. While expressed differently, Nike, Adidas, and Puma all sell sustainable sportswear made from recycled plastic waste. More interestingly, the demarcation
between gentle and assertive occurs on the basis of “can” and “should.” This “can should differentiation” was influenced by Kronrod et al.’s methodology. In order to support the perceived difference in assertiveness, thirty individuals were presented with both the Sustainable Gentle and Sustainable Assertive claim and asked to rate which claim they perceived as more “in your face.” In unanimous fashion, the Sustainable Assertive claim
was perceived as more “in your face,” supporting the difference in perceived assertiveness driven by the “can should differentiation.”
In order to promote increased readability and standardization of each claim, the text is left aligned and split into three lines of ascending length across all three claims. Additionally, the word “you,” common to all three claims, is universally italicized to draw attention to the text. The addition of italicization came as a result of suggestions made by multiple members of the informal focus group.
Lastly, specific efforts were included during stimulus ad creation to promote brand observation and standardization. Across all twelve ads, the four brand logos appear in three locations, in the upper right corner and left chest of each product. Each logo includes brand name to reinforce brand observation and support recall, and the location and size of each brand were approximately standardized to prevent a confounding variable related to differences7.
The instruments implemented in this research evolved and benefitted from both professional and informal critique. Every stage of development included attempts to phase out potentially confounding variables that would skew experimental results. The survey leveraged pre-tested scales and extensive evaluation from current researchers to maximize usefulness. Each element of the stimulus advertisements was carefully crafted and tested with representative respondents. Throughout the process of instrument
IRB Approval
This thesis represents human subjects research and therefore required clearance from the University of North Carolina at Chapel Hill’s Institutional Review Board (IRB) prior to distribution. Ultimately, this project was awarded exempt status from UNC’s IRB prior to survey launch and assigned an IRB number of 20-0228. Exempt status reflects the project’s “minimal risk” to participants’ physical, psychological, social, and economic well-being. Appendix H contains the IRB’s letter of approval for this study. Distribution Strategy
Following survey instrument finalization, Qualtrics’s online panel service was selected as the distribution strategy for this research. I partnered with Qualtrics for three primary reasons. First, Qualtrics’s respondent pool is widely recognized among
Figure 5. Demographic quotas applied by Qualtrics to survey distribution and collection
Funding
This distribution strategy would not have been feasible without gracious funding from the Kenan Scholars Program and Kenan Institute for Private Enterprise. I secured a research grant totaling $2,000 which purchased 600 respondents. With the help of the survey’s randomizer tool, the 600 respondents were evenly and randomly distributed into the twelve stimulus advertisements reflected in Table 1. The resulting twelve groups of 50 randomly selected respondents provided significant sample sizes and power for statistical evaluation.
Quality Assessment and Statistical Tools
After successfully securing funding, a pre-test of the survey instrument was completed in the form of a soft launch to 50 respondents. This pre-test confirmed proper functioning of all survey components and provided an initial view into survey results. The following section describes the procedures implemented to ensure standard quality control and introduces the tools used for statistical evaluation of results.
Quality Assurance & Sample Composition
quality control measures implemented fall into three categories: nonsensical responses, zero variance responses, and zero familiarity responses. The list below outlines the qualifications for a quality response. For reference, when a response failed one of the following tests and was “filed for recollection or discarded” the entire response was removed from the data, not simply the failing question.
Each response was first evaluated in terms of the duration spent completing the survey. Interquartile range was utilized to achieve an initial understanding of data spread. I then proceeded to set reasonable upper and lower bounds on duration. In order to set a responsible lower bound, I personally took the survey as fast as possible while providing reasoned answer choices. I completed the instrument in two minutes and seventeen seconds, representing a duration of 137 seconds. As the creator of the instrument, it is reasonable to assume that a duration score of 137 seconds approximately represents the fastest possible quality response and therefore the minimum acceptable response score. In addition to my evaluation, Qualtrics pre-screened and removed responses they designated as “speeders.” On the other end, I set a maximum cutoff score of 30 minutes or 1800 seconds. While not perfect, this cutoff sets a reasonable standard. Any respondent spending >1800 seconds in the instrument most likely had difficulty comprehending questions or left the survey idle.
age bracket combined with the employment status of “retired,” the response was filed for recollection or discarded. This combination of answers reflected potential carelessness or random answer selection.
Next, responses were evaluated for a nonsensical relationship within the sportswear purchase history block between the history and frequency questions. A response that claimed to have purchased sportswear in the past 12 months but then proceeded to select zero for number of sportswear items purchased in that reference period, a “Y-0 error,” was discarded or filed for recollection. Similarly, answers claiming to not have purchased sportswear combined with a non-zero frequency value, a “N->0 error,” were deemed invalid. In order to prevent these errors, I added skip logic to this series of question which removed respondents that made a “Y-0 error” and skipped irrelevant questions for respondents that answered negatively to the history question.
In order to provide more context, I compared the selections made within the product quality matrix to the subsequent selection for willingness to buy. Respondents with a negative zero-variance response that claimed an affirmative purchase intention were discarded or filed for recollection. This combination falls into the nonsensical grouping of responses, as it is illogical for a rational
consumer that negatively rates all aspects of product quality to then purchase a product. Positive zero-variance responses with an affirmative purchase intention were not discarded, since this combination could represent a rational consumer. Analyzing each brand matrix, I calculated the same variance and
frequency values for every observation. Any zero-variance responses within a brand matrix were discarded or filed for recollection. In addition, any response that claimed zero familiarity with a brand was deemed invalid. For example, if a respondent selected “not at all familiar” to the question “How familiar are you with Nike?” the response was discarded. Zero-familiarity responses, while not nonsensical, inherently bounded a respondent’s ability to provide quality brand related data.
Lastly, all zero-variance responses within the final matrix table, sportswear brand interaction, were discarded or filed for recollection.
inspection and were discarded and filed for recollection. Finally, of the 34 recollected responses four were discarded totaling a final value of 626 quality responses as judged by the quality inspections listed above.
Statistical Evaluation Tools
Following the finalization of the dataset, the 626 observations were transformed from an Excel document to a SPSS Statistics document. The final SPSS dataset contained 626 rows and 101 variable columns. SPSS was selected as the statistical evaluation tool for this research because of its relative ease of use and ability to complete analysis of variance. Four primary statistical methods were utilized to explore the dataset. The following section provides a brief description of principal component analysis,
Cronbach’s alpha, univariate analysis of variance (ANOVA), and multivariate analysis of variance (MANOVA). This description should provide a baseline understanding of each method’s purpose, ultimately facilitating a richer interpretation of the study’s results.
questions, or variables, that all arguably attempt to estimate perception of product quality. If these ten variables truly do represent one particular factor, be it product quality, then a principal component analysis should discover only one component with an Eigen value exceeding one. For the purposes of this research, principal component analysis proved important in evaluating each of the matrix tables included in the instrument.
Cronbach’s alpha is a widely utilized measure of internal scale consistency and reliability. Internal reliability describes how well a specific set of variables tests what they are designed to test. It is typically applied to multi-question surveys utilizing Likert scales, similar to the questions included in this research. The generally accepted
minimum value of Cronbach’s alpha equals α ≥0.7. Using the same product quality matrix example, a Cronbach’s alpha value exceeding 0.7 would reflect the scales success in measuring product quality.
ANOVA and MANOVA served as this study’s two primary statistical tools for capturing the impact of different independent variables on dependent variables. Plainly, an ANOVA, or analysis of variance, captures differences between group means. It does so by outputting an F statistic that can be compared to a critical F value, FCRIT, for statistical significance. Since ANOVA analyses are rooted in a specific null and
alternative hypothesis, a statistically significant result allows for the rejection of the null hypothesis, meaning that a statistically significant difference exists between group means.
independent variable—on perceived product quality—the dependent variable—I could utilize an ANOVA analysis to evaluate the differences in mean perceived quality across the three claim type groups. The null and alternative hypothesis would be:
H0=μUtilitarian=μSust . Assertive=μSust. Gentle
HA=μUtilitarian≠ μSust. Assertive≠ μSust . Gentle
An ANOVA analysis would then output an F statistic based on a ratio of within-groups estimate of variance, MSW, to between-groups estimate of variance,MSB.
F Statistic=MSB MSW
The F statistic would then be compared to FCRIT, which is based on number of groups and
size of group. If the F statistic exceeds FCRIT then H0 can be confidently rejected, and the analysis concludes a statistically significant difference in the perceived quality means across the three claim types. This difference would suggest that claim type possesses an impact on perceived quality.
F Statistic>FCRIT
While an ANOVA provides insight into the equality or inequality of means, it fails to specifically identify where particular differences lie. In order to uncover this information, various post hoc tests are utilized. I further discuss the post hoc tests implemented for this study in the results chapter.