Advance Access publication July 15, 2016
Published by Oxford University Press on behalf of the Maryland Psychiatric Research Center 2016.
Modality-Dependent Impact of Hallucinations on Low-Frequency Fluctuations in
Schizophrenia
Stephanie M. Hare*,1, Judith M. Ford2, Aral Ahmadi3, Eswar Damaraju4, Aysenil Belger5,6, Juan Bustillo7,
Hyo Jong Lee8, Daniel H. Mathalon2, Bryon A. Mueller9, Adrian Preda10, Theo G. M. van Erp10, Steven G. Potkin10, Vince D. Calhoun4,11, Jessica A. Turner1,3,4; and Functional Imaging Biomedical Informatics Research Network10 1Neuroscience Institute, Georgia State University, Atlanta, GA; 2Department of Psychiatry, San Francisco VA Medical Center, University
of California, San Francisco, San Francisco, CA; 3Department of Psychology, Georgia State University, Atlanta, GA; 4Mind Research
Network, Albuquerque, NM; 5Department of Psychiatry, University of North Carolina,Chapel Hill, NC; 6Department of Psychology,
University of North Carolina, Chapel Hill, NC; 7Department of Psychiatry, University of New Mexico, Albuquerque, NM; 8Department
of Computer Science and Engineering, Chonbuk National University, Jeonju, South Korea; 9Department of Psychiatry, University
of Minnesota, Minneapolis, MN; 10Department of Psychiatry and Human Behavior, University of California, Irvine, Irvine, CA; 11Department of Electrical and Computer Engineering, University of New Mexico, Albuquerque, NM
*To whom correspondence should be addressed; Neuroscience Institute, Georgia State University, PO Box 5030, Atlanta, GA 30302-5030, US; tel: 262-364-7427, fax: 404-413-5446, e-mail: [email protected]
Prior resting-state functional magnetic resonance imag-ing (fMRI) analyses have identified patterns of functional connectivity associated with hallucinations in schizophre-nia (Sz). In this study, we performed an analysis of the mean amplitude of low-frequency fluctuations (ALFF) to compare resting state spontaneous low-frequency fluctua-tions in patients with Sz who report experiencing hallucina-tions impacting different sensory modalities. By exploring dynamics across 2 low-frequency passbands (slow-4 and slow-5), we assessed the impact of hallucination modality and frequency range on spatial ALFF variation. Drawing from a sample of Sz and healthy controls studied as part of the Functional Imaging Biomedical Informatics Research Network (FBIRN), we replicated prior findings showing that patients with Sz have decreased ALFF in the posterior brain in comparison to controls. Remarkably, we found that patients that endorsed visual hallucinations did not show this pattern of reduced ALFF in the back of the brain. These patients also had elevated ALFF in the left hippo-campus in comparison to patients that endorsed auditory (but not visual) hallucinations. Moreover, left hippocampal ALFF across all the cases was related to reported halluci-nation severity in both the auditory and visual domains, and not overall positive symptoms. This supports the hypoth-esis that dynamic changes in the ALFF in the hippocam-pus underlie severity of hallucinations that impact different sensory modalities.
Key words: hallucinations/hippocampus/ALFF/rest ing-state/fMRI
Introduction
Schizophrenia (Sz) is a psychiatric disorder associated with heterogeneous symptoms that impact cognitive, affective, perceptual and motor function. While approxi-mately 59% of Sz patients report experiencing auditory hallucinations (AH), nearly half of those report visual hallucinations (VH).1 Despite the prevalence of these
symptoms, the underlying mechanisms remain elusive. Resting-state functional magnetic resonance imaging (rs-fMRI) analyses can probe the relation between differ-ent aspects of the blood-oxygen-level-dependdiffer-ent (BOLD) signal and behavioral traits. Seed-based functional connec-tivity (FC) analyses perform voxel-by-voxel comparisons within seed regions and rest on the assumption that voxels with similar temporal profiles (eg, time series) are func-tionally connected. While FC analyses assess associations between BOLD time series of voxels in different regions, analyses of the amplitude of low-frequency fluctuations (ALFF)2 measure voxelwise fluctuations in the amplitude
of BOLD signal in the very low frequencies (typically 0.01–0.08 Hz). ALFF is correlated with baseline cerebral blood flow3 and is thought to reflect spontaneous, intrinsic
neuronal activity.2–4 It remains unclear how ALFF relates
to FC. Di et al5 found that regional ALFF correlated with
Prior studies have investigated rs-FC in Sz patients with hallucinations, yet no studies have investigated the rela-tion between ALFF and hallucinarela-tions in Sz. Aberrant patterns of rs-FC with superior temporal gyrus (STG),6–10
putamen8 and hippocampus9,10 are associated with AH
in Sz. Resting-state FC differences have also been iden-tified in Sz patients that endorse different types of hal-lucinations. Due to AH prevalence in Sz, these studies are designed to assess FC differences across patient groups that endorse both VH and AH vs patients that endorse only AH. Relative to patients that endorsed only AH, patients that endorse VH and AH show functional hyperconnectivity with subcortical structures including caudate,11 putamen,12 amygdala,13 nucleus accumbens,12
parahippocampus,12 and hippocampus.11,13
We posit that Sz patients that endorse AH will have distinct, dynamic patterns of rs-activity in comparison to patients that endorse both VH and AH. To test this hypothesis, we examined the relation between resting-state ALFF and modality-dependent hallucinations in a large, multi-site dataset of Sz cases and controls studied as part of the Functional Imaging Biomedical Informatics Research Network (FBIRN). Specifically, we analyzed mean ALFF (eg, the calculated power of a voxel within the very low frequencies, normalized by the subject’s mean within-brain ALFF). By performing voxel-by-voxel (vox-elwise) comparisons across the brain, this analysis can potentially provide insight into the link between novel sites of regional variation in patterns of dynamic activity of the BOLD signal within the very low frequencies and the experience of particular symptoms such as VH and AH. Studying hallucinations using ALFF is crucial to contex-tualize previous findings and to probe the relation between ALFF fluctuations and differences in FC.
Although no previous studies examine the relationship between hallucination modality and ALFF in Sz, a recent study reported that Parkinson’s disease (PD) patients with VH showed elevated ALFF in the hippocampus, para-hippocampus, inferior parietal lobe, and cerebellum, but decreased ALFF in the occipital lobe, when compared to a non-hallucinating PD patient control group.14 Relative
to controls, Sz patients show elevated ALFF in frontal brain regions and decreased ALFF in posterior (parietal and occipital) regions.4,15–18 Sz patients also show elevated
ALFF in parahippocampal cortex,15,18 hippocampus,4,15,16
amygdala,16 insula,16 and medial temporal regions17
rela-tive to controls. McHugo et al4 found that patients had
increased hippocampal ALFF relative to controls, but normal hippocampal FC to hubs of the default mode network. One study17 reported a significant interaction
between frequency band (slow-5 vs slow-4) and group (Sz vs controls) in the precuneus, inferior occipital gyrus, and thalamus suggesting that observed dynamic changes in low-frequency fluctuations are likely frequency-depen-dent. Taking this into account, we examined ALFF across the slow-5 (0.01–0.027 Hz) and slow-4 (0.027–0.08 Hz)
frequency ranges. Drawing from the FBIRN study,13,16 we
aimed to replicate previous findings using this dataset16 and
to determine whether there are frequency-dependent differ-ences in ALFF across 3 hallucination subgroups with Sz: patients that endorse AH, patients that endorse VH, and patients that do not endorse either type of hallucination.
Methods
Subjects
Data was collected from 143 patients with Sz and 155 healthy control (HC) subjects matched for age, sex, and handedness (table 1); this is the same resting-state dataset as used in Ford et al13 and largely overlapping with Turner
et al16 and Damaraju et al.19 Raw imaging data was
col-lected from 6 sites and written, informed consent was obtained from participants at all sites, including permis-sion to share de-identified data across the centers (con-sent process was approved by University of California Irvine, University of California San Francisco, Duke University/ University of North Carolina, University of New Mexico, University of Iowa, and University of Minnesota Institutional Review Boards).
The set of diagnostic criteria for inclusion was based on the Structured Clinical Interview for DSM-IV-TR Axis I Disorders (SCID-I/P). To be eligible for partici-pation, Sz must have also been stable on anti-psychotic medication for at least 2 months and were excluded if they showed significant extrapyramidal symptoms. In addition, HCs were excluded if they had a current or past history of major psychiatric illness or had a first-degree relative with an Axis-I disorder.
Additional exclusion criteria for all participants included: history of major medical illness, contraindi-cations for MRI, insufficient eyesight to see with nor-mal acuity with MRI compatible corrective lenses, drug dependence in the last 5 years or a current substance abuse disorder, intelligence quotient < 75 as measured by the North American Adult Reading Test (NAART), and those who moved more than 4 mm during scanning.
Grouping of Participants
Sorting of the 143 Sz into clinical subgroups was achieved by evaluating responses to the Scale for the Assessment of Positive Symptoms (SAPS)20 Item #1 and SAPS Item #6
(table 1). Item #1 asks if the participant “reports voices,
to prevalence of the symptom of AH in Sz, participants in this subgroup generally reported AH (SAPS Item #1 > 1) in addition to VH (38/40 participants); we refer to this group as the VH+AH subgroup since 95% of those in this group experienced both VH and AH.
Imaging
Data were acquired using five 3T Siemens TIM Trio scan-ners and one 3T GE MR750 scanner. We used an AC-PC aligned echo-planar imaging (EPI) pulse sequence (rep-etition time/echo time [TR/TE] 2 s/30 ms, flip angle 77°, 32 slices collected sequentially from superior to inferior, 3.4 × 3.4 × 4 mm with 1 mm gap, 162 frames, 5:38 min:s) to obtain T2*-weighted images. Subjects were instructed to lie in the scanner with eyes closed; this scan followed an object working memory task with emotional distractors.
Data Processing
Pre-processing. Traditional pre-processing steps were performed using the Data Processing Assistant for Resting-State fMRI (DPARSF) toolbox that runs off the REST software platform (http://resting-fmri.sourceforge.net).21
The first 2 time frames were removed for all participants to allow for signal stabilization. The data underwent (1) motion correction to first image, (2) slice-timing correc-tion to the middle slice, and (3) normalizacorrec-tion to standard Montreal Neurological Institute (MNI) space using an EPI
template. These normalized images were the input to our ALFF analyses. Framewise displacement (FD) was calcu-lated for each image; FD differentiates head realignment parameters across frames and generates a 6-dimensional times series that represents instantaneous head motion.22
We performed a 1-way ANOVA on mean FD values for each subject and found significant differences across groups (table 1). To correct for effects of this confounding factor, we included mean FD as a covariate in our analyses.
ALFF Calculation and Smoothing. ALFF images
were computed using REST software.21 Following
lin-ear detrending of the time series, the power spectra were extracted using a Fast Fourier Transform. The ALFF mea-sure at each voxel is the averaged square root of the power across a low-frequency range, normalized by the mean within-brain ALFF value for that subject. In this study, we analyzed ALFF across the slow-5 (0.01–0.027 Hz) and slow-4 (0.027–0.08 Hz) frequency ranges as in Yu et al.17
Images were subsequently smoothed with an 8-mm full-width-half-maximum (FWHM) Gaussian kernel.
Statistical Analyses
We analyzed the smoothed ALFF images using a General Linear Model (GLM) with a group factor of 4 levels (AH, VH+AH, NH, and HC). We included site as a dummy variable and age, gender, and mean FD as covariates.22 Table 1. Participant Demographic and Clinical Information
AH (n = 42) VH+AH (n = 40) NH (n = 61) HC (n = 155)
Demographic info
Age 37.8 (11.9) 37.2 (11.3) 40.2 (11.8) 37.8 (11.3) Gender 32 (m), 10 (f) 30 (m), 10 (f) 44 (m), 17 (f) 110 (m), 45 (f) Handedness (r/l/a) 36 (r), 5 (l), 1 (a) 33 (r), 5 (l), 2 (a) 61 (r), 0 (l), 0 (a) 146 (r), 7 (l), 2 (a) Smoking status 19 (s), 23 (n) 20 (s), 20 (n) 24 (s), 37 (n) 14 (s), 141 (n) Socioeconomic status subject*a 50.8 (13.1) 50.7 (13.7) 50.2 (12.7) 33.5 (12.8)
Socioeconomic status caregiver*b 33.8 (14.8) 35.0 (14.2) 37.8 (14.5) 30.51 (14.7)
Subject motion
Mean framewise displacementc 0.44 (0.3) 0.42 (0.3) 0.35 (0.2) 0.30 (0.2)
Patient population
Duration of Illness 18.0 (11.0) 17.0 (12.4) 17.3 (11.5) n/a Chlorpromazine equiv. (CPZ Woods)d 401.1 (443.1) 335.4 (294.6) 367.9 (356.2) n/a
Total PANSS*e 57.7 (12.6) 63.3 (13.4) 54.0 (13.1) n/a
PANSS-positive*e 16.6 (4.5) 17.6 (4.1) 12.9 (4.1) n/a
PANSS-negative 13.7 (5.3) 15.2 (6.1) 13.9 (4.7) n/a Total SAPS*f 25.1 (13.3) 40.0 (17.4) 12.1 (12.3) n/a
Total SAPS adjusted for 2 hallucination items*g 21.8 (12.8) 33.9 (16.5) 12.1 (12.3) n/a
Note: HC, healthy control; AH, auditory hallucinations; NH, non-hallucinator; VH, visual hallucinations; PANSS, Positive and Negative Syndrome Scale; SAPS, Scale for the Assessment of Positive Symptoms.
aAH, VH+AH, and NH groups all significantly different than HC (Bonferroni post hoc, P < .01). bNH vs HC significantly different (Bonferroni post hoc, P < .01).
cAH vs HC significantly different (Bonferroni post hoc, P < .01); VH vs HC significantly different (Bonferroni post hoc, P = .018). dWe only had this information for a subset of patients; percent reporting = 80.4%.
eVH+AH vs NH significantly different (Bonferroni post hoc, P < .01).
fAH vs NH and VH+AH vs NH both significantly different (Bonferroni post hoc, P < .01). gAll post hoc comparisons are significantly different (Bonferroni post hoc, P < .01).
To ensure that these results were not driven by spuri-ous motion and physiological artifacts, we performed an additional analysis using images that underwent standard pre-processing described above followed by regression of 6-motion parameters and mean physiological (white mat-ter and cerebrospinal fluid) signals. Then the ALFF images were calculated followed by smoothing (8 FWHM). We analyzed these smoothed images using an identical GLM to that described above. Thus, in this second analysis, we modeled the impact of motion artifacts on the BOLD signal prior to performing group-level analysis in which mean FD was modeled as a nuisance regressor.
Post hoc t test contrasts were performed to explore the effect of group on frequency-specific alterations in ALFF. Confidence was a priori specified at P < .05, family-wise-error (FWE) corrected, for all comparisons with HC. All
t-contrasts were masked with the main effect of group (P = .001, uncorrected).
For the clinical subgroup comparisons (AH vs AH+VH vs NH), we also set our confidence at P < .05, but corrected for multiple (voxel-by-voxel) comparisons by performing a simulation using AFNI 3dClustSim (http://afni.nimh.
nih.gov/pub/dist/doc/program_help/3dClustSim.html).
This program allows the user to obtain a minimum cluster size threshold for a given alpha significance level. We opted to use this approach for correcting for multiple compari-sons (vs FWE-correction) due to the reduced statistical power associated with these clinical subgroup comparisons. All reported cluster-wise-corrected results are masked with the main-effect of group (P = .001, uncorrected).
To assess the relation between modality-specific hallu-cination severity and ALFF, we extracted the eigenvalues
for each subject from clusters that were significantly dif-ferent across the clinical subgroups with hallucinations (AH vs VH+AH). We performed a multi-level linear regression to assess the respective impact of nuisance covariates (eg, age, gender, scanning site) (Level 1), posi-tive symptom severity adjusted for the 2 hallucination (auditory and visual) items (Level 2), VH severity (Level 3), and AH severity (Level 4) on ALFF.
Results
In this study, we were interested in exploring the effect of hallucination modality on ALFF. The results of our 1-way ANCOVA (4-group-levels) revealed a main effect of group (supplementary figure 1). First, we summa-rize the significant results obtained when we compared the pooled Sz group to the HC group. Next, we explore regional ALFF differences between each of the halluci-nation subgroups and HC to assess if these differences were similar to those found in the HC vs pooled Sz group comparisons. Finally, we report significant differ-ences in regional ALFF variation across hallucination subgroups.
Patients With Sz vs HCs
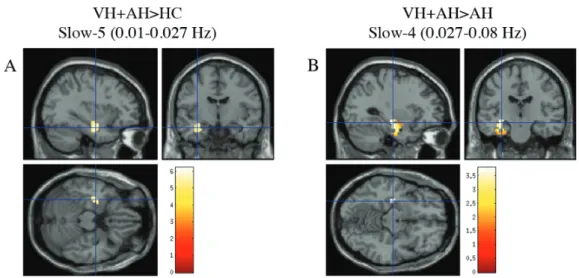
Relative to controls, Sz had decreased ALFF in the lin-gual region, cuneus (BA 17, 18, 19), and right thala-mus (figure 1A), but elevated ALFF in bilateral inferior frontal gyri (IFG) (BA 45, 47) (figure 2A). Specifically across the slow-5 band, patients showed elevated ALFF in the left hippocampus. Full results are summarized in supplementary table 1.
Hallucination Modality Subgroups vs HCs
Decreased ALFF in Hallucination-Modality Subgroups vs HC. Similar to the pooled Sz group, both AH and NH groups had decreased ALFF across posterior regions of the brain such as the cuneus and lingual regions (BA 17, 18, 19) relative to HC (figures 1B and 1C). The decreased ALFF in the AH group was only seen in the slow-4 passband. These striking differences in anterior-posterior spatial variation of ALFF were not seen in the VH+AH group; VH+AH only showed decreased ALFF in 2 very small clusters in the occipital lobe when compared to HC. Full results are summarized in supplementary tables 2A, 3, and 4A.
Increased ALFF in Hallucination-Modality Subgroups
vs HC. Across the slow-4 passband, the AH group
showed significantly elevated ALFF in the right IFG
(BA 45, 47) and a small cluster in the inferior temporal lobe in comparison to HC (figure 2B). VH+AH predominately showed increases in ALFF in Brodmann Area 20 including the left hippocampus and left inferior temporal region in comparison to HC (figure 3A). The NH group showed no significant increases in ALFF relative to HC. Full results are provided in supplementary tables 2B and 4B.
Comparisons Between Hallucination Modality Subgroups
NH vs Hallucination-Modality Subgroups (AH and
VH+AH). Neither VH+AH nor AH groups showed
any significant regional ALFF differences across either frequency range, relative to NH.
VH+AH Group vs AH Group. The VH+AH group had
significantly elevated ALFF in the left hippocampus
Fig. 2. The pooled Sz group and patients in the AH group both have increased ALFF in the right inferior frontal gyrus. (A) t-contrast (Sz>HC) and (B) t-contrast (AH>HC). All contrasts are thresholded at P < .05, FWE-corrected, masked with the main effect of group (P = .001 uncorrected) with an extent threshold of k = 10 voxels. HC, healthy control; Sz, schizophrenia; AH, auditory hallucinations; FWE, family-wise-error.
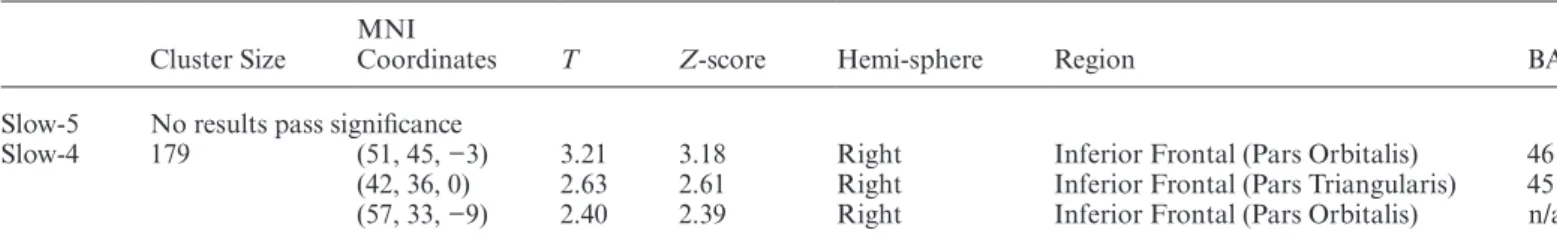
and left inferior temporal lobe (table 2, figure 3B) relative to AH across both low-frequency passbands. Across slow-4, VH+AH had decreased ALFF in the right inferior frontal gyrus (BA 45, 46) relative to AH
(table 3).
Relation to Symptoms
To examine the relationship between left hippocampal ALFF and symptom severity, we extracted ALFF beta-values for each subject within the left hippocampus clus-ter shown in figure 3B (cluster-wise corrected results at
P = .05 uncorrected, minimum cluster size = 147 voxels, k
=10 voxels) and performed a multi-level linear regression. Reported VH severity (Block 3) and AH severity (Block 4) significantly predicted variability in subject-specific estimates of left hippocampal ALFF, accounting for 7.9% and 5.5% of the observed change in variance respectively (P = .001, Block 3; P = .005, Block 4). Nuisance covariates (age, gender, scanning site; Block 1) and positive symptom severity (adjusted for the 2 hallucination items) (Block 2) did not significantly predict left hippocampal ALFF.
Discussion
In this first investigation of resting state ALFF and hallu-cinations in Sz, we identified spatial variations of ALFF in 2 hallucination-modality subgroups with Sz. Patients in the VH+AH group showed left hippocampal eleva-tions in ALFF when compared to HC and AH groups. Reduced ALFF in the posterior brain relative to HC is strongest in the NH and AH groups, while this reduction is very weak in the VH+AH group.
Yu et al17 reported a significant interaction between
frequency band (slow-5 vs slow-4) and group (Sz vs HC), suggesting that observed changes in the ALFF are
frequency-dependent. For this reason, we analyzed group differences in ALFF across the slow-5 (0.01–0.027 Hz) and slow-4 (0.027–0.08 Hz) ranges. Consistent with pre-vious findings, Sz had increased ALFF in frontal regions (primarily inferior frontal), but decreased ALFF in pos-terior regions (precuneus, cuneus, lingual, and other occipital regions) relative to controls. These effects were seen across both slow-5 and slow-4 passbands, although the effect was more robust across slow-4 frequencies. Relative to controls, Sz had elevated ALFF in the left hip-pocampus; the VH+AH group showed the same pattern of increased hippocampal ALFF relative to controls and the AH group. For the case vs control comparisons, the observed effects in hippocampus were more robust across the lowest frequencies (ie, slow-5 passband).
The observed alterations in low-frequency BOLD signal dynamics in the VH+AH group were linked to the general (non-modality-specific) tendency to hallucinate, rather than overall positive symptoms, or VH in particular. The results of a multi-level linear regression showed that reported hal-lucination severity in both the auditory and visual domains explained a significant amount of the variance, while nui-sance regressors (age, gender, and scanning site) and posi-tive symptoms adjusted for these 2 hallucination items did not significantly account for the observed variability.
Hippocampal/parahippocampal dysfunction has con-sistently been shown to be associated with the experience of hallucinations. Yao et al14 previously reported that PD
patients with a history of VH had significantly increased ALFF in the right hippocampus and parahippocampus. Ford et al13 reported that Sz patients with VH and AH had
hippocampal-occipital hyperconnectivity in comparison to HC and AH groups. Relative to controls, Sz patients with AH show patterns of left STG-left hippocampus hypo-connectivity at rest.9 A second line of evidence
implicat-ing hippocampal/parahippocampal hypofunction in the
Table 2. Visual+Auditory Hallucination Patient Group Increased Relative to Auditory Hallucination Patient Group (VH+AH>AH)
Cluster Size MNI Coordinates T Z-score Hemi-sphere Region BA
Slow-5 174 (−33, −12, −21) 3.99 3.93 Left Hippocampus 20 (−42, −30, −27) 2.54 2.52 Left Inferior Temporal 20 Slow-4 196 (−30, −18, −12) 3.84 3.79 Left Hippocampus 20 (−42, −27, −24) 1.98 1.97 Left Inferior Temporal 20
Note: MNI, Montreal Neurological Institute.
Table 3. Auditory Hallucination Patient Group Increased Relative to Visual+Auditory Hallucination Patient Group (AH>VH+AH)
Cluster Size MNI Coordinates T Z-score Hemi-sphere Region BA
Slow-5 No results pass significance
experience of AH comes from symptom-capture studies, which ask the subject to report when he/she is actively experiencing a hallucination during an fMRI scan. Sz patients showed left parahippocampal deactivation directly prior to their reported experience of AH.23 Yet,
after performing a coordinate-based meta-analysis of 10 AH-symptom-capture studies, Jardri et al24 found that the
hippocampus showed an elevated likelihood of increased activation during the experience of AH.
The oscillation dynamics of the hippocampus and its crucial role in generating theta rhythm underlie its unique ability to coordinate and synchronize activity generated by different neuronal ensembles across the brain.25 Findings
from our study suggest that aberrant hippocampal low frequency fluctuations are linked to hallucinations in Sz. If our findings are generalizable to a broader population, then this might explain why rs-FC studies find evidence favoring both hippocampal hypoconnectivity and hyper-connectivity hypotheses of AVH in Sz. Altered amplitudes of hippocampal low-frequency fluctuations may beget dysregulated patterns of FC (eg, observed patterns of hyperconnectivity observed in some instances and patterns of hypoconnectivity observed in others).
In Sz patients, altered amplitudes of low-frequency fluc-tuations in the hippocampus may be related to the escalat-ing sensory complexity of the hallucinations (eg, how many sensory modalities are involved).12 Rolland et al12 found
that mesolimbic connectivity patterns changed with esca-lating sensory complexity of the experiences (eg, 0, 1, or 2 modalities). Relative to patients that did not endorse hal-lucinations in any sensory domain and those that endorsed hallucinations solely in the auditory domain, Sz patients that endorsed both VH and AH had significantly elevated parahippocampal, insular and striatal connectivity with the nucleus accumbens, while significant differences in hip-pocampal connectivity were not found between the pure AH group and NH. The authors took these results to sug-gest that aberrant hippocampal FC may be related to VH in particular. The results of our regression analyses suggest that observed changes in hippocampal low-frequency fluc-tuations relate to both VH and AH.
The chosen design features of the present analysis pre-clude us from directly testing this “escalating complexity” hypothesis; we are unable to assign subjects to “escalat-ing sensory complexity subgroups” with the same rigor as Rolland et al. Notably, the subjects in the Rolland et al study were more clinically severe than those in the present study (eg, the researchers required a minimum reported hal-lucination severity of “marked” or “severe”), and many of the subjects in our study have complex hallucination pro-files that preclude us from assigning them to an “escalating complexity” hallucination subgroup (eg, scoring “question-able” on tactile/olfactory hallucination SAPS items, etc.). Future analyses should gear their experimental design to directly test this novel “escalating sensory complexity” hypothesis. Our current analysis and these proposed future
analyses would be in line with proposed initiatives of the 2015 International Consortium on Hallucination Research, which called for progression in research beyond the audi-tory modality and to analyze hallucinations impacting vari-ous different sensory modalities.26
To ensure that spurious motion and physiological arti-facts did not drive these observed effects, we performed an additional analysis using an identical GLM and data that underwent regression of 6-motion parameters and physiological (white matter and cerebrospinal fluid) signals prior to the ALFF calculation and smoothing. Regressing out these signals prior to group-level analy-sis (while retaining subject-specific mean FD as a covari-ate in the GLM) had no significant impact on the major results of this study (supplementary figure 2).
There are several limitations of this study. The first relates to potential confounding effects of divergent anti-psychotic treatment trajectories. Duration of illness and the derived standardized chlorpromazine equivalents were variable across Sz patients in this study. To control for these confounding factors, we ensured that hallucina-tion subgroups did not differ significantly with respect to these 2 factors (table 1). We were also unable to study a clinical group that endorsed exclusively VH. We adopted a research design that made comparisons between a patient group that endorsed AH but not VH and a group that endorsed VH. Due to the prevalence of AH as a symptom of Sz, 95% (38/40) of the patients in the VH group also reported experiencing AH. Notably, the term “VH+AH” is purely reflective of a naming strategy and should not be taken to suggest that we find linear (addi-tive) effects with respect to VH.
A final limitation is the paucity of phenomenological information regarding hallucinatory symptoms; we were only able to work with 2 questions from a single scale (SAPS). There is heterogeneity associated with phenom-enology of the hallucinations, leading some researchers to suggest that there should be subtypes of AH such as hyper-vigilance-AH.27,28 To date, only 2 studies with large sample
sizes (n ≥ 100) investigating this phenomenological hetero-geneity have been published.29,30 This limitation highlights
the importance of developing and utilizing more in-depth, nuanced assessments that capture phenomenological diver-sity associated with the experience of hallucinations.
In conclusion, we identified unique spatial patterns of ALFF in 2 hallucination-modality subgroups with Sz. Our results suggest that altered dynamics in 2 low-fre-quency ranges in the left hippocampus may play a crucial role in the development and sustained propensity to hal-lucinate. To build upon these current findings and more fully elucidate the link between functional dysregulation in regions like the left hippocampus and the experience of hallucinations, future analyses should test novel hypothe-ses such as the escalating sensory complexity hypothesis12
Supplementary Material
Supplementary material is available at http://schizophre-niabulletin.oxfordjournals.org.
Funding
This work was supported by awards from National Institutes of Health, U24 RR021992 to the Functional Imaging Biomedical Informatics Research Network (FBIRN, http://www.birncommunity.org), and an inter-nal 2CI Fellowship from Georgia State University to S.M.H.
Acknowledgments
The authors have declared that there are no conflicts of interest in relation to the subject of this study.
References
1. Waters F, Collerton D, ffytche DH, et al. Visual hallucina-tions in the psychosis spectrum and comparative information from neurodegenerative disorders and eye disease. Schizophr Bull. 2014;40(suppl 4):S233–S245.
2. Zang Y-F, He Y, Zhu C-Z, et al. Altered baseline brain activ-ity in children with ADHD revealed by resting-state func-tional MRI. Brain Dev. 2007;29:83–91.
3. Li Z, Zhu Y, Childress AR, Detre JA, Wang Z. Relations between BOLD fMRI-Derived Resting Brain Activity and Cerebral Blood Flow. PLoS One. 2012;7:e44556.
4. McHugo M, Rogers BP, Talati P, Woodward ND, Heckers S. Increased amplitude of low frequency fluctuations but normal hippocampal-default mode network connectivity in schizophrenia. Front Psychiatry. 2015;6:92.
5. Di X, Kim EH, Huang C-C, Tsai S-J, Lin C-P, Biswal BB. The influence of the amplitude of low-frequency fluctuations on resting-state functional connectivity. Front Hum Neurosci. 2013;7:118. doi:10.3389/fnhum.2013.00118.
6. Gavrilescu M, Rossell S, Stuart GW, et al. Reduced connec-tivity of the auditory cortex in patients with auditory hal-lucinations: a resting state functional magnetic resonance imaging study. Psychol Med. 2010;40:1149–1158.
7. Shinn AK, Baker JT, Cohen BM, Öngür D. Functional connectivity of left Heschl’s gyrus in vulnerability to audi-tory hallucinations in schizophrenia. Schizophr Res. 2013;143:260–268.
8. Hoffman R, Fernandez T, Pittman B, Hampson M. Elevated functional connectivity along the corticostriatal loop and the mechanism of auditory/verbal hallucinations in patients with schizophrenia. Biol Psychiatry. 2011;69:407–414.
9. Sommer IE, Clos M, Meijering AL, Diederen KMJ, Eickhoff SB. Resting state functional connectivity in patients with chronic hallucinations. PLoS One. 2012;7:e43516.
10. Clos M, Diederen KMJ, Meijering AL, Sommer IE, Eickhoff SB. Aberrant connectivity of areas for decoding degraded speech in patients with auditory verbal hallucinations. Brain Struct Funct. 2014;219:581–594.
11. Amad A, Cachia A, Gorwood P, et al. The multimodal con-nectivity of the hippocampal complex in auditory and visual hallucinations. Mol Psychiatry. 2014;19:184–191.
12. Rolland B, Amad A, Poulet E, et al. Resting-state func-tional connectivity of the nucleus accumbens in auditory and visual hallucinations in schizophrenia. Schizophr Bull. 2015;41:291–299.
13. Ford JM, Palzes VA, Roach BJ, et al. Visual hallucinations are associated with hyperconnectivity between the amygdala and visual cortex in people with a diagnosis of schizophrenia.
Schizophr Bull. 2015;41:223–232.
14. Yao N, Pang S, Cheung C, et al. Resting activity in visual and corticostriatal pathways in Parkinson’s disease with halluci-nations. Parkinsonism Relat Disord. 2015;21:131–137. 15. Hoptman MJ, Zuo XN, Butler PD, et al. Amplitude of
low-frequency oscillations in schizophrenia: a resting state fMRI study. Schizophr Res. 2010;117:13–20.
16. Turner JA, Damaraju E, Van Erp TGM, et al. A multi-site resting state fMRI study on the amplitude of low frequency fluctuations in schizophrenia. Front Neurosci. 2013;7:137. 17. Yu R, Chien YL, Wang HLS, et al. Frequency-specific
alter-nations in the amplitude of low-frequency fluctuations in schizophrenia. Hum Brain Mapp. 2014;35:627–637.
18. Lui S, Yao L, Xiao Y, et al. Resting-state brain function in schizophrenia and psychotic bipolar probands and their first-degree relatives. Psychol Med. 2015;45:97–108.
19. Damaraju E, Allen EA, Belger A, et al. Dynamic functional connectivity analysis reveals transient states of dysconnectiv-ity in schizophrenia. Neuroimage Clin. 2014;5:298–308. 20. Andreasen NC. Scale for the Assessment of Positive
Symptoms. Iowa City, IA: University of Iowa; 1984.
21. Song XW, Dong ZY, Long XY, et al. REST: a toolkit for resting-state functional magnetic resonance imaging data processing. PLoS One. 2011;6:e25031.
22. Power JD, Barnes KA, Snyder AZ, Schlaggar BL, Petersen SE. Spurious but systematic correlations in functional connec-tivity MRI networks arise from subject motion. Neuroimage. 2012;59:2142–2154.
23. Diederen KMJ, Neggers SFW, Daalman K, et al. Deactivation of the parahippocampal gyrus preceding auditory hallucinations in schizophrenia. Am J Psychiatry. 2010;167:427–435.
24. Jardri R, Pouchet A, Pins D, Thomas P. Cortical activa-tions during auditory verbal hallucinaactiva-tions in schizophre-nia: a coordinate-based meta-analysis. Am J Psychiatry. 2011;168:73–81.
25. Buzsaki G. Theta oscillations in the hippocampus. Neuron. 2002;33:325–340.
26. Thomas N, Rossell SL, Waters F. The changing face of hallucination research: the International Consortium on Hallucination Research (ICHR) 2015 Meeting Report: Table 1. Schizophr Bull. 2016;42:891–895.
27. Dodgson G, Gordon S. Avoiding false negatives: are some auditory hallucinations an evolved design flaw? Behav Cogn Psychother. 2009;37:325–334.
28. Mccarthy-Jones S, Thomas N, Strauss C, et al. Better than mermaids and stray dogs? Subtyping auditory verbal hal-lucinations and its implications for research and practice.
Schizophr Bull. 2014;40(suppl 4):275–284.
29. Nayani TH, David AS. The auditory hallucination: a phe-nomenological survey. Psychol Med. 1996;26:177–189. 30. McCarthy-Jones S, Trauer T, MacKinnon A, Sims E,