ASSESSING SUSTAINED AND DIFFERENTIAL IMPACTS OF NORTH CAROLINA’S MEDICAID “LOCK-IN” PROGRAM
Rebecca Boyd Naumann
A dissertation submitted to the faculty at the University of North Carolina at Chapel Hill in partial fulfillment of the requirements for the degree of Doctor of Philosophy in the Department
of Epidemiology in the Gillings School of Global Public Health.
Chapel Hill 2017
Approved by: Stephen Marshall Nisha Gottfredson Jennifer Lund
ii © 2017
iii ABSTRACT
Rebecca Boyd Naumann: Assessing Sustained and Differential Impacts of North Carolina’s Medicaid “Lock-In” Program
(Under the direction of Stephen Marshall)
Between 2000 and 2015, half a million people died from a drug overdose in the U.S., and most of these deaths involved an opioid. Medicaid beneficiaries are a particularly high-risk population. One strategy that nearly all states use to address potential misuse of prescription opioids, and other controlled substances (CS), are Medicaid “lock-in” programs (MLIPs). MLIPs identify beneficiaries demonstrating potential overutilization of CS and control their access. In North Carolina (NC), beneficiaries enrolled in the MLIP are required to use a single prescriber and pharmacy to obtain specific CS for a 12-month period. There has been little research examining the impact of MLIPs.
In this dissertation, we 1) examined the sustained impact of the NC MLIP on dispensed CS and dosages of opioids dispensed (in terms of morphine milligram equivalents (MMEs)) and 2) examined whether trajectories of MMEs differed across time prior to, during, and following release from the MLIP for different strata of the population. Data included NC Medicaid claims linked to records from NC’s Prescription Drug Monitoring Program from October 2009 through June 2013.
iv
release. However, the program was also associated with increased acquisition of dispensed CS using non-Medicaid payment (e.g., out-of-pocket) both during lock-in and following release. Moreover, beneficiaries acquired greater MMEs of dispensed opioids from both Medicaid and non-Medicaid payment sources during lock-in and following release.
v
To my husband, Tom, for his unwavering support, endless optimism, and fantastic sense of humor. I could not have done this without you.
vi
ACKNOWLEDGEMENTS
This dissertation would not have been possible without the support of several individuals. Thank you to my advisor throughout these last four years, Steve Marshall, for your mentorship, support, and encouragement. I am so grateful for the energy and time you spent creating
opportunities for me to grow as a scientist. I owe a huge thank you to my other dissertation committee members—Nisha Gottfredson, Jenny Lund, Chris Ringwalt, and Asheley Skinner. Your wisdom, guidance, and reassurance helped shape not only the work on this dissertation but also me as researcher. Thank you to Krista Kness, at the NC Division of Medical Assistance, and Drew Roberts for their willingness to answer my many questions about the Medicaid “lock-in” program and NC Medicaid claims data.
There are several other people who helped create an encouraging, supportive, and fun environment throughout my time as a UNC PhD student. A big thank you to my colleagues at the UNC Injury Prevention Research Center—especially Meghan Shanahan, Maryalice Nocera, Tonya Watkins, and Paula Gildner—for their humor and continuous support. To current and previous injury epidemiology PhD students—Karen Roos, Jared Parrish, Apostolos
vii
thank you to my friends in the PhD epidemiology program. I couldn’t have asked for a better cohort to learn from and with.
Lastly and most importantly, I would not have reached this point without my family. To my parents, thank you for your countless sacrifices, unconditional love, patience, and
viii
TABLE OF CONTENTS
LIST OF TABLES ... xi
LIST OF FIGURES ... xiii
LIST OF ABBREVIATIONS ... xiv
CHAPTER 1 – INTRODUCTION ...1
CHAPTER 2 – LITERATURE REVIEW ...8
2.1 Overview ... 8
2.2 Evaluations of MLIPs: State-based (other than NC) Results ... 9
2.3 Evaluations of MLIPs: Managed Care Organization (MCO) Results ... 16
2.4 Evaluations of MLIPs: North Carolina Results ... 21
2.5 Key findings from Studies Examining CS Use Classes and Trajectories ... 26
2.6 Summary ... 28
CHAPTER 3 – SPECIFIC AIMS ...29
CHAPTER 4 – METHODS ...35
4.1 Overview ... 35
4.2 Data Sources ... 36
4.2.1 Controlled Substances Reporting System (CSRS) ... 36
4.2.2 Medicaid Claims ... 37
4.2.3 Linkage and Final Database ... 38
ix
4.4 Study Population ... 41
4.5 Exposure Assessment ... 42
4.6 Outcome Assessment ... 43
4.7 Covariate Assessment ... 47
4.8 Statistical Analysis ... 53
CHAPTER 5 – CHARACTERISTICS OF NORTH CAROLINA MEDICAID BENEFICIARIES ELIGIBLE, ENROLLED, AND RETAINED IN A “LOCK-IN” PROGRAM (MANUSCRIPT 1) ...56
5.1 Overview ... 56
5.2 Introduction ... 57
5.3 Methods ... 58
5.4 Results ... 64
5.5 Discussion ... 67
CHAPTER 6 – EVALUATING SHORT- AND LONG-TERM IMPACTS OF A MEDICAID “LOCK-IN” PROGRAM ON CONTROLLED SUBSTANCES DISPENSED TO BENEFICIARIES (MANUSCRIPT 2) ...83
6.1 Overview ... 83
6.2 Introduction ... 84
6.3 Methods ... 85
6.4 Results ... 92
6.5 Discussion ... 95
CHAPTER 7 – TRAJECTORIES OF DISPENSED PRESCRIPTION OPIOIDS AMONG BENEFICIARIES ENROLLED IN A MEDICAID CONTROLLED SUBSTANCE “LOCK-IN” PROGRAM (MANUSCRIPT 3) ...105
7.1 Overview ... 105
7.2 Introduction ... 106
x
7.4 Results ... 113
7.5 Discussion ... 115
CHAPTER 8—DISCUSSION ...127
8.1 Overall Findings ... 127
8.2 Limitations ... 129
8.3 Strengths ... 131
8.4 Policy Implications ... 132
8.5 Public Health Impact ... 133
8.6 Future Research Directions ... 134
8.7 Summary ... 137
APPENDIX A—AVERAGE DAILY MORPHINE MILIGRAM EQUIVALENTS (MMEs) AMONG BENEFICIARIES ENROLLED IN THE NORTH CAROLINA MEDICAID “LOCK-IN” PROGRAM (MLIP), BY SOURCE OF PAYMENT, AND AMONG ELIGIBLE BUT NEVER MLIP-ENROLLED BENEFICIARIES BY TIME UNTIL/FROM FIRST MEETING MLIP-ELIGIBILITY CRITERIA ...139
APPENDIX B—DETAILS ON COVARIATE CATEGORIES AND CLAIMS-RELATED CODES USED TO DEFINE BENEFICIARY CHARACTERISTICS ...140
APPENDIX C—TEMPORAL TREND MEASURE CONSTRUCTION FOR AIM 1 ANALYSES ...146
APPENDIX D—CRITERIA USED TO DETERMINE NUMBER OF MEANINGFUL TRAJECTORY CLASSES IN LATENT CLASS GROWTH ANALYSES AND MODEL SELECTION PROCESS ...148
APPENDIX E—CALCULATION OF STANDARDIZED DIFFERENCES ...150
APPENDIX F—SENSITIVITY ANALYSES OF TRAJECTORIES OF OPIOID DOSAGES (MEASURED IN MORPHINE MILIGRAM EQUIVALENTS (MMEs)) DISPENSED TO BENEFICIARIES ELIGIBLE FOR THE NORTH CAROLINA MEDICAID “LOCK-IN” PROGRAM (MLIP) BUT NEVER ENROLLED ...151
xi
LIST OF TABLES
Table 1.1 Common policies/strategies used to address prescription drug misuse,
abuse, diversion, and overdose ... 4 Table 1.2 Criteria for potential inclusion in the NC Medicaid “Lock-In” Program ... 7 Table 2.1 Brief state-based MLIP evaluation findings ... 14 Table 2.2 Association for Community Affiliated Plan’s pilot projects involving
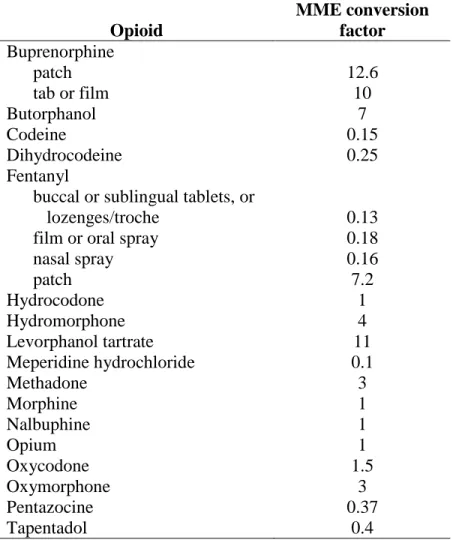
implementation of MLIPs in MCOs ... 18 Table 3. Overview of Dissertation Aims ... 32 Table 4. Opioid MME conversion factors ... 46 Table 5.1 Demographic characteristics of adults <65 years with Medicaid coverage
overall and who met Medicaid Lock-in Program (MLIP) eligibility criteria from June 2010 through December 2012, stratified by enrollment in the MLIP and
time spent in the MLIP (among those enrolled) ... 73 Table 5.2 Controlled substance-related characteristics of adults <65 years who met
Medicaid Lock-in Program (MLIP) eligibility criteria from June 2010 through December 2012, stratified by enrollment in the MLIP and time spent in the
MLIP (among those enrolled) ... 76 Table 5.3 Overall health care utilization and comorbid conditions of adults <65 years
who met Medicaid Lock-in Program (MLIP) eligibility criteria from June 2010 through December 2012, stratified by enrollment in the MLIP and time spent in
the MLIP (among those enrolled) ... 78 Table 6.1 Means of average daily morphine milligram equivalents (MMEs) per
dispensed opioid prescription per person among North Carolina Medicaid “lock-in” program (LIP) enrollees (n=2,702) by LIP-related time period and payer
source, October 2009-June 2013 ... 102 Table 6.2 Means, count differences, and count ratios of monthly numbers of
controlled substance prescriptions dispensed to North Carolina Medicaid “lock-in” program (LIP) enrollees (n=2,702) by payer source and LIP-related time
period, October 2009-June 2013 ... 103 Table 6.3 Means and changes in average daily morphine milligram equivalents
(MME) of opioid prescriptions dispensed to North Carolina Medicaid “lock-in” program (LIP) enrollees (n=2,702) by payer source and LIP-related time period,
xii
Table 7.1 Weighted counts, percentages, and means for characteristics of each of the five latent classes representing different trajectories in the log of average daily morphine milligram equivalents (MME) of opioids dispensed to beneficiaries enrolled in the North Carolina Medicaid “lock-in” program per month, October
2009-June 2013 ... 121 Table 7.2 Key characteristics of beneficiaries enrolled in the North Carolina Medicaid
xiii
LIST OF FIGURES
Figure 1.1 Age-adjusted prescription drug overdose death rates per 100,000
population per year, United States, 2000-2015 ... 1 Figure 1.2 Drug overdose death rates per 100,000 population per year, North
Carolina, 2000-2015 ... 2 Figure 4. Conceptual model of general relationships between exposure, outcomes,
and covariates ... 48 Figure 5.1 Classification of persons who qualified for the North Carolina Medicaid
Lock-in Program (MLIP) from June 2010 through December 2012, stratified by
enrollment in the MLIP and time spent in the MLIP (among those enrolled) ... 72 Figure 6. Average number of dispensed controlled substance (CS) prescriptions per
person per month (Panel A) and average daily morphine milligram equivalents (MMEs) of dispensed opioid prescriptions (Panel B) per person across pre-spike,
spike, lock-in, and post-release periods among North Carolina Medicaid ... 101 Figure 7.1 Trajectories of log of average daily morphine milligram equivalents
(MME) of opioids dispensed to beneficiaries enrolled in the North Carolina
Medicaid “lock-in” program per month, October 2009-June 2013 (n=2,701) ... 120 Figure 7.2 Standardized differences in North Carolina Medicaid “lock-in”
program-enrolled beneficiary characteristics by latent class, using class 5 (i.e., “low MME
xiv
LIST OF ABBREVIATIONS
AHRQ Agency for Healthcare Research and Quality AIC Akaike’s Information Criterion
BCN Blue Care Network
BIC Bayesian Information Criterion CCS Clinical Classification Software CCW Chronic Conditions Data Warehouse
CD Count Difference
CDC Centers for Disease Control and Prevention CMS Centers for Medicare and Medicaid Services CPT Current Procedural Terminology
CS Controlled Substances
CSRS Controlled Substances Reporting System DHHS Department of Health and Human Services DMA Division of Medical Assistance
DPH Division of Public Health
DRIVE Data Retrieval Information and Validation Engine
ED Emergency Department
GEE Generalized Estimating Equations
ICD-9-CM International Classification of Diseases, Ninth Revision, Clinical Modification LCGA Latent Class Growth Analysis
xv LRT Likelihood Ratio Test
MAT Medication-assisted Treatment MCO Managed Care Organization
MD Mean Difference
MLIP Medicaid “Lock-In” Program MME Morphine Milligram Equivalents
MMIS Medicaid Management Information System
NC North Carolina
NDC National Drug Code
NY New York
PDMP Prescription Drug Monitoring Program REMS Risk Evaluation and Mitigation Strategy
1
CHAPTER 1 – INTRODUCTION
Prescription drug overdoses have become a public health epidemic with enormous health, social, and economic impacts. Prescription drug overdose deaths have rapidly escalated over the past several years (Figure 1.1).1 Between 2000 and 2015, the annual U.S. prescription drug overdose death rate tripled from 2.8 to 9.2 deaths per 100,000 population. Of the 29,728 lives lost to prescription drug overdoses in 2015, three out of four (76%) deaths involved an opioid analgesic (i.e., painkiller) and nearly one-third involved a benzodiazepine, a prescription drug often used in the treatment of anxiety.1 (Note: some overdoses involve more than one type of drug).
Figure 1.1 Age-adjusted prescription drug overdose death rates per 100,000 population per year, United States, 2000-2015
0
1 2 3 4 5 6 7 8 9 10
2000 2002 2004 2006 2008 2010 2012 2014
D
eat
h
rat
e
per
100,000
pop
. per
year
Year
2
While prescription drugs, including opioids and benzodiazepines, play a legitimate and important role in pain management, particularly for palliative care, endemic misuse and abuse of these drugs has become a major public health problem, and arguably the defining public health crisis of the early 21st century. In 2011, approximately 1.4 million emergency department (ED) visits in the U.S. were related to the nonmedical use of prescriptions,2 and in the year 2013 alone, prescription opioid overdose, abuse, and dependence cost the U.S. more than $78 billion in terms of health care costs, productivity losses, and criminal justice fees.3
The drug overdose epidemic in North Carolina (NC) has followed national trends, with NC also experiencing a substantial increase in fatal overdoses over the last several years (Figure 1.2).4
Figure 1.2 Drug overdose death rates per 100,000 population per year, North Carolina, 2000-2015
0 2 4 6 8 10 12 14 16
2000 2002 2004 2006 2008 2010 2012 2014
De
ath rat
e
p
er
100,000 p
op
.
p
er
ye
ar
Year
3
NC now loses nearly 1,500 people each year to drug overdose, the majority of which are related to prescription opioids (n= 854 for the year 2015). Moreover, for each person lost to an overdose in NC, there are an additional nine hospitalizations and 17 ED visits related to drug overdose.5,6
Medicaid beneficiaries are a particularly high-risk population for prescription drug misuse, abuse, and overdose. Adults who qualify for Medicaid are generally those with low incomes who have dependents, a disability, or some other specific health care need (e.g., pregnancy).7 Prescriptions for controlled substances (CS) (i.e., drugs, such as opioids, whose manufacture, possession, or use is regulated by the government because of their potential for abuse), and specifically for opioids, have increased rapidly over the past several years in the Medicaid population. Between 1996 and 2002, opioid dispensing to Medicaid fee-for-service enrollees increased approximately threefold.8 Additionally, Medicaid beneficiaries are prescribed opioids at roughly twice the rate of non-Medicaid populations, likely due to several factors, including higher rates of disability and chronic disease.9,10 It also has been suggested that
Medicaid beneficiaries may have less access to non-opioid therapies, such as physical therapy, to treat pain-related conditions.10,11
A large proportion of the opioids prescribed to Medicaid beneficiaries are linked to potentially inappropriate prescribing.9 Approximately 40% of Medicaid beneficiaries prescribed opioids in 2010 had at least one indicator of potentially inappropriate use or prescribing, defined as having temporally overlapping opioid and benzodiazepine prescriptions, high daily doses (i.e., prescribed daily dose of ≥ 100 morphine milligram equivalents (MMEs)), or long acting/
4
both higher opioid-related poisoning hospitalization rates and drug poisoning ED visit rates.13,14 Analyses from New York, Washington, and Montana indicated that Medicaid beneficiaries have opioid-related death rates three to eight times as high as non-Medicaid beneficiaries.15-17 In North Carolina specifically, an analyses of 2007 data revealed that Medicaid beneficiaries experienced a third of the unintentional overdose deaths in the state, while representing approximately 20% of the state population.18
Several policy interventions have been implemented in an attempt to reduce the negative impacts associated with prescription drug misuse and abuse.19 Table 1.1 highlights some of the most frequently used strategies with a brief explanation of each strategy’s purpose. While some of these strategies are supported by a small evidence base of evaluation-related research, most are lacking empirical support. This type of research is necessary to determine how best to design and apply these strategies in order to optimize public health impact.19,20
Table 1.1 Common policies/strategies used to address prescription drug misuse, abuse, diversion, and overdose
Policy/strategy Purpose
Prescription drug monitoring programs (PDMPs)
State-run electronic databases used to track the prescribing and dispensing of CS. Provides prescribers and pharmacists with important information about patients’ CS dispensing history.21,22
“Good Samaritan” legislation Encourages emergency treatment of those experiencing an opioid overdose by providing immunity for low level criminal offenses when a person who is experiencing an overdose or who is present at an overdose calls 911 for assistance or seeks medical attention for themselves or another person.23
Naloxone access legislation and naloxone distribution programs
5
Table 1.1 Common policies/strategies used to address prescription drug misuse, abuse, diversion, and overdose
Policy/strategy Purpose
Safe disposal/drug “take back” events
Provides a safe, convenient, and responsible means of disposing of prescription drugs.25
“Pill mill” legislation Legislation that often restricts in-office dispensing of CS and/or mandates registration or licensure of pain
management clinics, among other requirements.26 Provider training and
education, including Risk Evaluation and Mitigation Strategy (REMS) materials and prescriber guidelines
The FDA’s REMS program requires risk mitigation plans to ensure that benefits of certain prescription drugs outweigh their risks. These can include many different components but often include development of a one-page Medication Guide that is given to a patient when they obtain their opioid prescription at the pharmacy.27 Prescriber guidelines have been made available at the state level, and the Centers for Disease Control and Prevention (CDC) recently released guidelines at the national level.28,29
Improved access to substance abuse treatment, including medication-assisted treatment (MAT)
MAT includes taking a medication (e.g., buprenorphine, methadone) usually once per day to relieve opioid cravings and withdrawal symptoms.30,31 Many treatment programs also involve a counseling component.
Abuse-deterrent opioid formulations
Drugs designed to minimize the user’s ability to physically alter the drug to extract the active ingredient through methods like chewing, crushing, or mixing with a solvent (e.g., alcohol).32
Patient review and restriction programs (i.e., “Lock-in” programs)
Programs designed to identify beneficiaries demonstrating potential overutilization of prescription drugs and tightly regulate their access, generally through the requirement that beneficiaries use a single prescriber and/or pharmacy to obtain certain CS for a specified period of time.33,34
6
have operated some version of a “lock-in” program since the 1970s or early 1980s.35,36 However,
with the recent substantial increase in CS misuse, abuse, diversion, and overdose, MLIPs have received a renewed focus in the last several years.37
While MLIPs are operational in nearly every state,33,38 there is wide variation in program design, and limited research on the long-term impacts on beneficiaries. The diversity in MLIP design includes the criteria that trigger enrollment in a state’s MLIP, length of time beneficiaries
are enrolled in the program, and restrictions placed on beneficiaries while enrolled.33 While each state has different specific criteria, beneficiaries are generally flagged for enrollment due to filling a certain number of prescriptions and/or visiting a certain number of prescribers and/or pharmacies in a specified period of time (e.g., 30 or 60 days). Additionally, once locked-in, beneficiaries are generally constrained to obtaining CS prescriptions from one prescriber and/or one pharmacy for a 12- to 24-month period. However, as we discuss in detail in Chapter 2, few states have rigorously evaluated the impacts of their MLIPs.
NC’s MLIP was implemented in 2010 in response to a Government Accountability
Office audit identifying NC as a state with an unusually large number of claims for CS.39 The MLIP is administered by NC’s Division of Medical Assistance (DMA), the division
administering Medicaid in NC. Similar to other states, NC’s MLIP primarily serves three
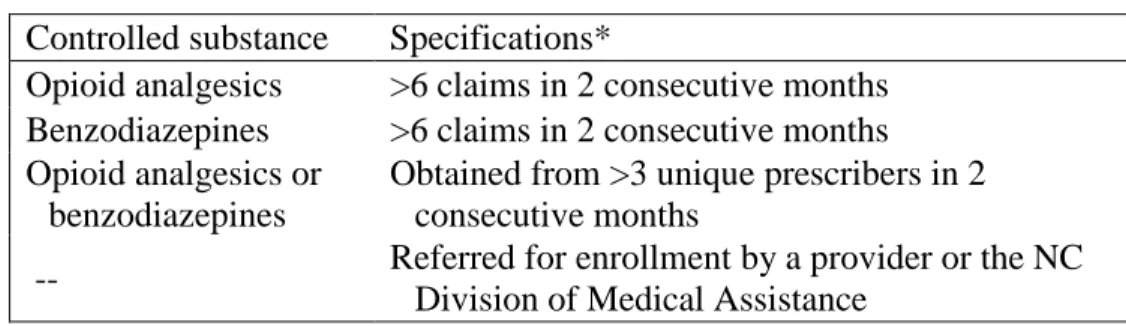
purposes: 1) to better coordinate care of selected beneficiaries; 2) to reduce diversion of CS; and 3) to reduce expenditures for medically unnecessary prescriptions and health care services needed to treat adverse outcomes from the nonmedical use of CS.33 NC Medicaid beneficiaries who meet the requirements outlined in Table 1.2 are flagged for potential enrollment in the state’s MLIP.40 If enrolled, beneficiaries are “locked-in” for a 12-month period and restricted to
7
or benzodiazepines, as well as certain anxiolytics (e.g., meprobamate). After 12 months in the program, beneficiaries are released from lock-in requirements, but can become eligible for re-enrollment if criteria for re-enrollment are again met. (Note: In January 2017, the “lock-in” period
in NC changed from a 12- to a 24-month period.41 This dissertation analyzed data prior to 2017.)
Table 1.2 Criteria for potential inclusion in the NC Medicaid “Lock-In” Program
Few high-quality studies have rigorously evaluated many of the strategies described in Table 1.1, including MLIPs.20 This dissertation fills important gaps in our understanding of the impacts of MLIPs, and specifically NC’s MLIP. Chapter 2 provides a detailed review of the
current literature surrounding MLIP impacts, and Chapter 3 outlines the specific aims of this dissertation and gaps in the literature that this dissertation fills.
Controlled substance Specifications*
Opioid analgesics >6 claims in 2 consecutive months Benzodiazepines >6 claims in 2 consecutive months Opioid analgesics or
benzodiazepines
Obtained from >3 unique prescribers in 2 consecutive months
-- Referred for enrollment by a provider or the NC Division of Medical Assistance
8
CHAPTER 2 – LITERATURE REVIEW
2.1 Overview
A review of the literature, searching PubMed, Google Scholar, and ProQuest’s
Dissertation and Theses databases, was conducted. Because much of the evaluation information on MLIPs is not contained in the peer reviewed literature, but rather involves internal state reports, we also used Google searches to search this “grey” literature. Literature searches included combinations of the following search terms: “Medicaid,” “lock in,” “opioid,” “drug utilization review,” “patient review and restriction,” “evaluation,” “controlled substances,” and
each of the state names. All searches were initially conducted in November 2015 and repeated in June 2017 to capture any new publications. The reference lists of identified articles were
reviewed for additional relevant articles and resources.
This critical review of the literature review is organized in three parts (Sections 2.2-2.4). The first part summarizes what is known about the impacts of MLIPs from various state-based studies, audits, and internal reports (Section 2.2). The second part synthesizes findings from evaluations of lock-in programs implemented by specific managed care organizations (MCOs) (Section 2.3). The third part focuses on initial evaluation results from studies examining impacts of NC’s MLIP (Section 2.4). At the end of each section, we provide a summary of the key
9
Finally, in Section 2.5, findings from a brief review of studies examining heterogeneity in trajectories and classes of CS use are provided. This review was conducted to inform hypotheses for the second aim of this dissertation.
2.2 Evaluations of MLIPs: State-based (other than NC) Results
This section synthesizes evaluation findings from MLIPs in states other than NC. While nearly every state has a MLIP in place, there is very little rigorous information available on the impacts of these programs. We identified MLIP evaluation results related to healthcare
utilization or cost savings from fifteen states; however, most evaluation reports and studies had poorly documented methods and provided a superficial look at program impacts. We first review evaluation results from six states with either peer-reviewed studies of the effects of their MLIPs or with state-based reports or presentations that provided reasonably well documented results. We specifically highlight the year(s) studied in each subheading below to call attention to the fact that results and lessons learned from some of the earlier studies may not be as applicable to the current prescription drug overdose epidemic, which began in the mid-1990s.42 Additional state-based findings, often from internal state-based reports or audits with very little detail, are briefly summarized in Table 2.1.
Missouri (1976)
The earliest known MLIP evaluation results come from Missouri.43 In 1977, Singleton published a description of how the state’s MLIP operated, as well as the estimated cost savings
10
shopping; excessive numbers of prescriptions within thirty, sixty, or ninety days; and the number of different drugs received vs. the number of physicians prescribing them. Beneficiaries flagged for potential misutilization were reviewed by a Medicaid physician and/or pharmacist to
determine if the beneficiary’s utilization could be justified based on their diagnoses and previous
medical history. If staff determined that the utilization was unjustifiable, a Medicaid caseworker contacted the beneficiary to discuss the MLIP and explain that they would be “locked-in” to
using one physician and pharmacy. Singleton estimated that the program saved the state between $1.8 million and $10.95 million in the year 1976 alone and that these savings reduced the state’s
Medicaid budget expenditures by at least 2%.34,43,44
Hawaii (1980-1983)
Hawaii’s MLIP was implemented in 1980 with the following criteria for program enrollment: (1) engaging in “doctor shopping,” defined as consulting multiple providers for the
same reason in a few days, consulting multiple providers specializing in the same area for the same or different reasons, or consulting providers located in geographically diverse areas for the same reason; (2) engaging in unnecessary visits for the same reason to the same provider; (3) using multiple pharmacies to obtain the same drug dispensed by either the same or different physicians; (4) obtaining excessive doses of CS or drugs with street value; or (5) using
11
However, if misuse appeared to persist, beneficiaries were “locked-in” to using only one primary
care provider, pharmacy, clinic, and/or hospital. An evaluation of the MLIP published in 1985 found that from program implementation through 1983, approximately 270 beneficiaries were counseled by caseworkers and 137 restrictive actions were taken. Of those who were counseled, warned, and asked to voluntarily comply, about 21% were no longer overutilizing services one year post-warning. Among those who were enrolled in the MLIP, the degree of abuse was reported to decrease on average while enrolled, and the state was estimated to save more than $900,000 from the program in one year alone.34,46
Louisiana (1994-1996)
Louisiana’s MLIP was established in the 1970s; however, it was not until the mid-1990s,
when Medicaid costs drastically increased, that the MLIP was utilized to a much greater extent with about 2,000 beneficiaries enrolled at any given time. While MLIP beneficiaries could be restricted to one primary care provider, one specialist, and/or one pharmacy, the majority of beneficiaries were only locked-in to one pharmacy. Blake’s (1997) dissertation research focused on examining the impact of Louisiana’s MLIP on economic and clinical outcomes.34,35,47 She
analyzed claims data for a two year period from mid-1994 to mid-1996 and used t-tests and segmented regression to examine differences in utilization and expenditures one year pre-lock-in vs. the year following lock-in.
12
and diagnostic tests. Approximately 65% of locked-in beneficiaries filled their prescriptions at a single pharmacy prior to lock-in, as compared to more than 90% during lock-in. Additionally, Blake documented reductions in polypharmacy, use of Schedule II CS, and pharmacy costs. Prior to lock-in, the number of unique prescriptions per recipient per month ranged from 8-10
compared to about 6 after enrollment. Moreover, per recipient adjusted monthly pharmacy expenditures ranged from $300-$400 prior to enrollment compared to $225-$250 after
enrollment for those with a physician and pharmacy restriction and about $300 after enrollment for those with only a pharmacy restriction.
Wisconsin (1997)
Potential candidates for Wisconsin’s MLIP were identified through both automated
surveillance methods and through referral by physicians, pharmacists, and other providers.48 Candidates with evidence of CS abuse and/or forgery of prescriptions were placed in the state’s MLIP and restricted to using a single provider and a single pharmacy for two years. Hladilek et al. (2004) reported that on average, about 130 candidates were reviewed each month, resulting in approximately nine MLIP enrollments per month. Moreover, a 1997 cost-benefit analysis of the program concluded that the MLIP saved $6.16 per dollar spent. This analysis also indicated that the MLIP resulted in a 24% decrease in drug expenditures, 21% decrease in hospitalizations, and a 26% decrease in ED visits.48
Washington (2004-2012)
13
Similar to other states, Medicaid beneficiaries are considered for MLIP enrollment as a result of either a referral from a health care provider or as a result of being flagged in a claims-based analysis that considers numbers of providers visited, prescriptions dispensed, and ED visits, among other factors. MLIP beneficiaries can be locked into using one primary care physician, one pharmacy, one opioid prescriber, one hospital for non-emergency services, or any
combination of these for a two-year period. A 2009 analysis revealed that, on average,
beneficiaries enrolled in the MLIP had a 37% decrease in physician visits, a 33% decrease in ED visits, and a 24% decrease in the number of prescriptions. Among 518 beneficiaries enrolled in the MLIP in 2006, the average number of opioid prescriptions per beneficiary per month decreased from 3.07 to 1.63, the average number of prescribers decreased from 4.8 to 2.8, and total MMEs decreased from 312 MME/day to 185 MME/day. Savings from the MLIP were estimated at more than $1.5 million per month, and the program was found to save
approximately $12 for every $1 invested.
While the state’s MLIP demonstrated many positive findings, additional analyses using
2004-2007 data highlighted the fact that MLIP enrollees remained a high-risk population, even after enrollment.17,45 These analyses indicated that while MLIP enrollees constituted 0.1% of the entire Medicaid population, they accounted for 4.5% of all prescription opioid-related deaths. The annual fatal overdose risk for individuals in the overall state Medicaid population was estimated to be 1 in 6,757, while the estimated risk was 1 in 172 for those enrolled in the MLIP.
Oklahoma (2006)
14
supply of narcotics, anxiolytics, antidepressants obtained; diagnoses of drug dependence; and number of hospital discharges, among other factors. While enrolled, beneficiaries were “locked-in” to using one pharmacy. A 2009 analysis of 52 MLIP beneficiaries enrolled from January
2006 through October 2006 found that when compared to the 12 months prior to enrollment, beneficiaries had less opioid prescription fills, were less likely to visit multiple pharmacies and physicians, and had fewer ED visits during MLIP enrollment.45,52 The average number of opioid prescription fills decreased from 2.16 per beneficiary per month to 1.32, all pharmacy claims decreased from 4.86 to 3.46, unique pharmacies visited decreased from 2.05 to 0.89, unique prescribers visited decreased from 2.48 to 1.63, and ED visits decreased from 1.26 to 0.81. In the first 12 months of MLIP enrollment, per member annual savings were estimated at just over $600.
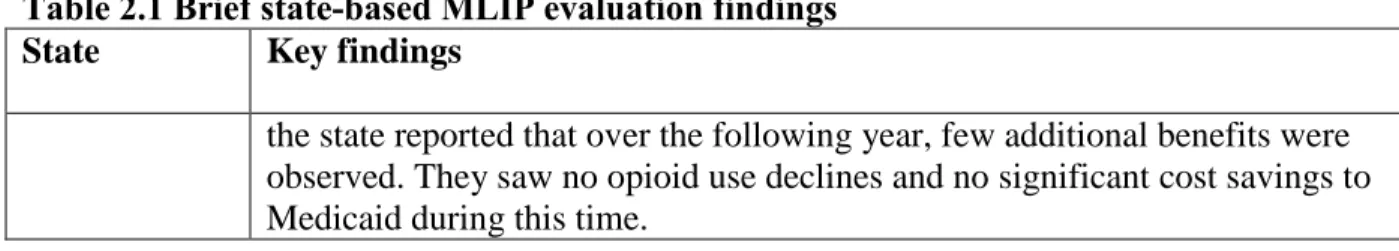
In addition to these state-based studies, several internal reports were identified that provided very brief information on estimates of state MLIP impacts, often in terms of Medicaid cost savings. These findings are summarized in Table 2.1.
Table 2.1 Brief state-based MLIP evaluation findings
State Key findings
Colorado53 A 2015 state audit report estimated that if Colorado’s MLIP, which was not functional at the time of the report, had enrolled just 200 beneficiaries prior to FY 2012, they would have seen a reduction in General Fund expenditures for prescription drugs of $633,725 for FYs 2012 and 2013.
Conneticut54,55 The state reported that their drug utilization review activities and MLIP had saved the state $2.4 million in fiscal year 2011 and more than $4 million in fiscal year 2012.
15
Table 2.1 Brief state-based MLIP evaluation findings
State Key findings
approximately $12.7 million. Several years later, the state’s Agency for Health Care Administration reported that due to restrictions set on CS and use of the state’s PDMP, which is available to both prescribers and pharmacists, the number of beneficiaries locked-in decreased over time and the number of beneficiaries requiring manual monitoring through the MLIP decreased. As of September 30, 2013, the state reported that there were no longer any beneficiaries in the MLIP.
Iowa58,59 Iowa MLIP beneficiaries are restricted to one physician, one pharmacy, and one hospital to obtain prescriptions for a 24-month period.In 2008, the state reported annual cost savings of approximately $2 million, which increased substantially in subsequent years. From July 2010 through September 2012, the state estimated that they had saved approximately $14.8 million in terms of prescription drug and medical care costs.
Kentucky60 In 1997, an internal performance audit was carried out on the state’s MLIP. Kentucky’s MLIP requires enrollees to be restricted to one physician and one pharmacy. The auditors analyzed 170 randomly selected MLIP beneficiaries enrolled between January 1994 and March 1997. They found that average annual claims in the 12 months pre-lock-in were nearly $15,000 and approximately $8,600 in the 12 months following lock-in, for an average estimated savings of $6,400 per beneficiary enrolled.
Louisiana61 MLIP beneficiaries in Louisiana are locked-in to using one pharmacy when enrolled. From September 2013 to July 2014, it was estimated that the MLIP saved more than $90,000, or about $15.65 per locked-in beneficiary per month. During this time, the number of beneficiaries locked-in increased from 184 to 884.
Missouri62 In Missouri, MLIP beneficiaries can be restricted to a physician, pharmacy, or both. As of October 2015, the state reported 1,485 active MLIP enrollees and a total cost savings, as a result of the MLIP, of more than $550,000 for the year.
South Carolina63
South Carolina MLIP beneficiaries are locked into using one pharmacy. At the time of a MLIP review in 2011, the program reported having 199
beneficiaries enrolled. Additionally, since the MLIP started in January 2009, it was estimated that service utilization by beneficiaries in the program decreased 29%. This decrease translated to a total savings of $1.1 million or about $5,581 per MLIP beneficiary.
West Virginia64
Beneficiaries enrolled in West Virginia’s MLIP are locked-in to one
pharmacy for a 12-month period. An analysis of 919 MLIP beneficiaries from September 2011 through June 2012 revealed that the amount paid for CS decreased $48.04 per member per month when comparing the six months pre-lock-in to the first six months during pre-lock-in, yielding an overall savings of more than $264,000 in Medicaid-related drug expenditures.
16
Table 2.1 Brief state-based MLIP evaluation findings
State Key findings
the state reported that over the following year, few additional benefits were observed. They saw no opioid use declines and no significant cost savings to Medicaid during this time.
Summary of Key Limitations
Three key methodologic limitations emerged from the review of evaluations from MLIPs in states other than NC. First, many of the studies reviewed identified cost savings associated with MLIPs. However, these savings may be questionable, since few of the studies used comparison populations of beneficiaries who were not included in MLIPs, and therefore fail to account for decreases that would have occurred even if the beneficiaries had not been enrolled in the MLIP. Second, most studies and reports examined administrative metrics, such as changes in Medicaid-reimbursed dispensed opioids as the endpoint of interest. None of the reviewed studies or reports examined changes in dispensed opioids from other sources of reimbursement, such as personal payment. Third, none of these studies or reports addressed key patient-orientated health endpoints, such as risk of overdose, use of MAT, or use of non-pharmacologic pain management therapies. These limitations leave major gaps in our scientific understanding of the effect of these programs.
2.3 Evaluations of MLIPs: Managed Care Organization (MCO) Results
17
through October 2002, he found that two-thirds of the MLIP beneficiaries were female and that beneficiaries had a mean age of 46 years (range 17-76 years). The MLIP resulted in a 17% reduction in the number of CS claims, a 9% reduction in the number of medical claims for office visits, and an 11% reduction in the number of medical claims for outpatient hospital visits. Additionally, Beaubien found that while the number of claims for inpatient hospital visits increased 14%, the number for ED visit claims remained approximately stable between pre-lock-in and durpre-lock-ing lock-pre-lock-in periods.
More recently, Dreyer et al. (2015) conducted an observational cohort study of 59 beneficiaries enrolled in Blue Care Network’s (BCN) MLIP from March 2008 through May 2013.67 BCN is a Medicaid MCO run by Blue Cross Blue Shield of Michigan. BCN beneficiaries were flagged for potential MLIP enrollment quarterly if they had filled more than nine CS
prescriptions from more than three prescribers within a three-month period. A committee
reviewed flagged beneficiaries, and if enrolled, the review committee contacted the beneficiary’s primary care provider to ask him or her to be the beneficiary's sole opioid prescriber. Upon physician agreement, beneficiaries were informed via letter that only CS prescriptions obtained from the one provider would be covered by BCN, and beneficiaries were locked-in to this provider for a 36-month period. Dreyer et al. found that over half (n=32 of 59) of enrolled beneficiaries left the MCO during the study period. In fact, 29% (n=17) of all MLIP-enrolled beneficiaries left within the first six months of enrollment. The attrition rates observed over this time were higher than in the general Medicaid population. The authors also measured changes in appropriate CS use (defined as steady use, decreasing or stopping use, or enrollment in
maintenance replacement therapy) and “unstable” use (defined as submitting claims for opioids
18
study time period. While the percentage of those with appropriate CS use increased, from 31% at six months to 78% at 36 months, and the percentage with “unstable” use decreased, from 37% at
six months to none at 36 months, the authors acknowledged that selection bias likely contributed to these results. The authors suggested that beneficiaries who were more likely to continue unstable or risky opioid use may have been the ones that were also more likely to terminate their BCN coverage in order to leave the MLIP.
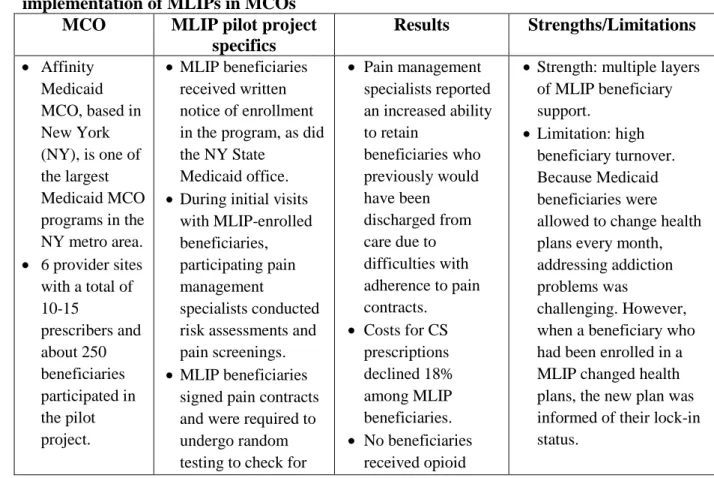
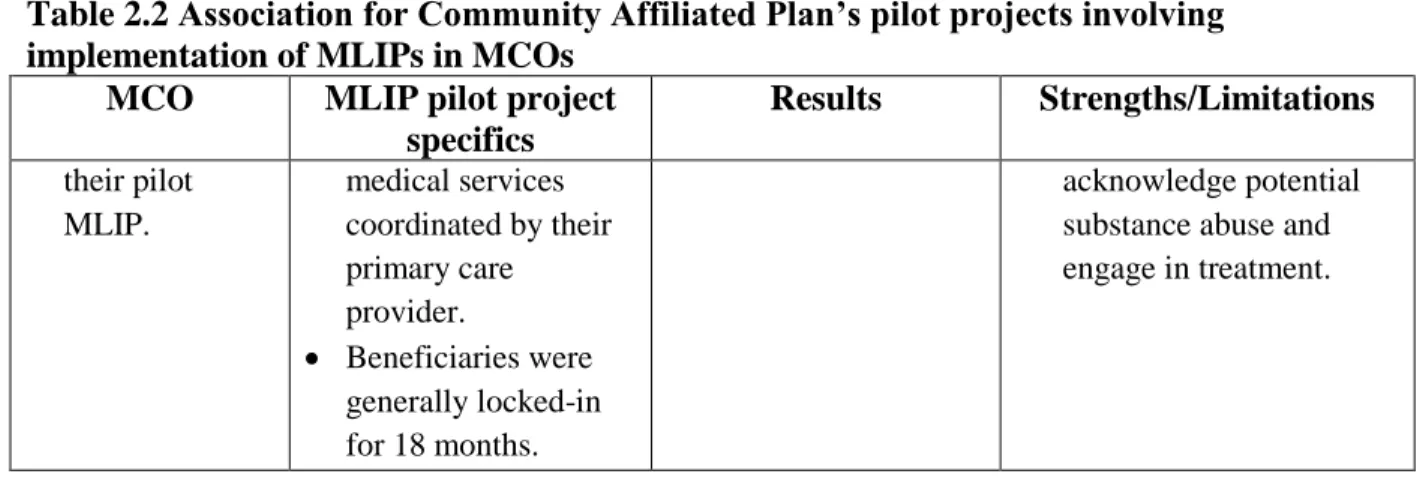
Most recently, in 2014, the Association for Community Affiliated Plans worked with several MCOs to implement pilot projects aimed at reducing prescription drug abuse in the Medicaid population.68 Four MCOs in California, New York, New Jersey, and Ohio chose to implement MLIPs. Table 2.2 provides key results from these four pilot projects.
Table 2.2 Association for Community Affiliated Plan’s pilot projects involving implementation of MLIPs in MCOs
MCO MLIP pilot project specifics
Results Strengths/Limitations
Affinity
Medicaid MCO, based in New York (NY), is one of the largest Medicaid MCO programs in the NY metro area.
6 provider sites
with a total of 10-15 prescribers and about 250 beneficiaries participated in the pilot project.
MLIP beneficiaries
received written notice of enrollment in the program, as did the NY State
Medicaid office.
During initial visits with MLIP-enrolled beneficiaries, participating pain management
specialists conducted risk assessments and pain screenings.
MLIP beneficiaries
signed pain contracts and were required to undergo random testing to check for
Pain management
specialists reported an increased ability to retain
beneficiaries who previously would have been discharged from care due to difficulties with adherence to pain contracts.
Costs for CS
prescriptions declined 18% among MLIP beneficiaries.
No beneficiaries
received opioid
Strength: multiple layers
of MLIP beneficiary support.
Limitation: high
beneficiary turnover. Because Medicaid beneficiaries were allowed to change health plans every month, addressing addiction problems was
19
Table 2.2 Association for Community Affiliated Plan’s pilot projects involving implementation of MLIPs in MCOs
MCO MLIP pilot project specifics
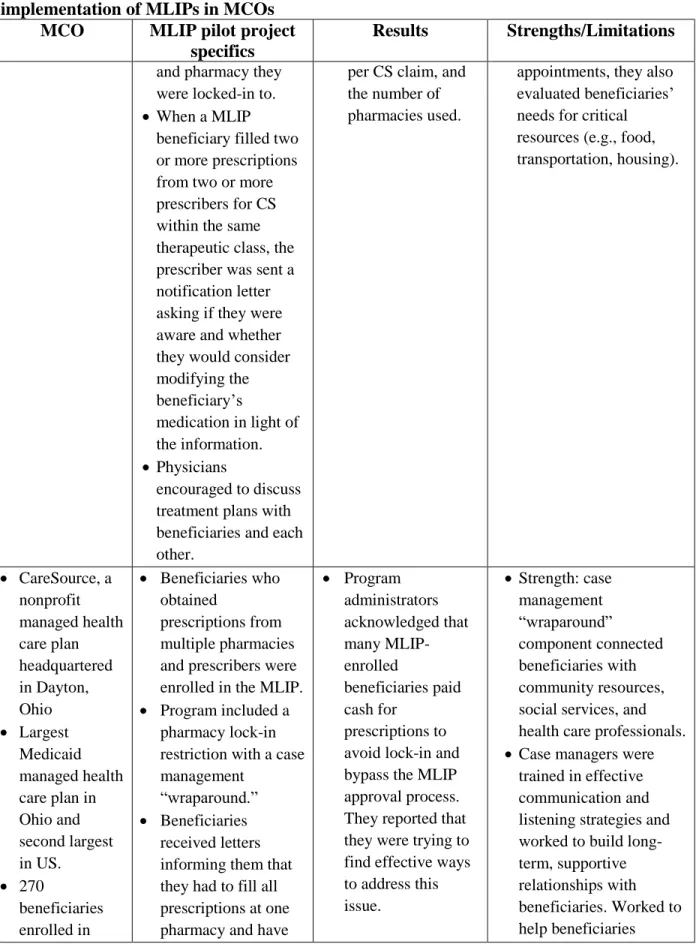
Results Strengths/Limitations use of drugs and
doses beyond those prescribed.
Beneficiaries were
required to remain under one designated prescriber’s care in order to obtain CS prescriptions. prescriptions in combination with buprenorphine or benzodiazepines (high-risk combinations).
Average morphine
equivalent dose declined 31 mg.
Limitation: lack of pain
medicine specialists in NY (pain medicine specialists administered this pilot project). Shortage could limit future program dissemination. CalOptima based in Orange County, California, operates a health care network called Monarch HealthCare, which piloted the MLIP
Pharmacy staff
identified
beneficiaries who exhibited drug-seeking behavior and referred them for enrollment.
Enrolled beneficiaries
were assigned to pain management
specialists and were required to sign pain management
contracts to indicate consent with the MLIP and commitment to comply with requirements.
Among 87 MLIP
beneficiaries, there was a 50%
reduction in the average number of opioid prescriptions obtained per beneficiary per month (from 3.6 to 1.8) and a 32% reduction in the average number of opioid prescriber groups visited per beneficiary (from 2.5 to 0.8).
Limitation: beneficiaries
who changed health care networks or who lost eligibility for Medicaid were disenrolled from the MLIP.
Horizon New
Jersey Health (backed by Horizon Blue Cross Blue Shield of NJ) enrolled 171 beneficiaries in their MLIP pilot by the end of 2014.
Pilot included support
services for beneficiaries, pharmacies, and prescribers.
Beneficiaries were
enrolled based on prescription histories. Notification letters were sent to enrolled members, their primary care provider,
Physicians
provided positive feedback about notification letters.
Preliminary
analyses on MLIP-enrolled
beneficiaries found reductions in the number of CS dispensed per member, spending
Strength: program
20
Table 2.2 Association for Community Affiliated Plan’s pilot projects involving implementation of MLIPs in MCOs
MCO MLIP pilot project specifics
Results Strengths/Limitations and pharmacy they
were locked-in to.
When a MLIP
beneficiary filled two or more prescriptions from two or more prescribers for CS within the same therapeutic class, the prescriber was sent a notification letter asking if they were aware and whether they would consider modifying the beneficiary’s
medication in light of the information.
Physicians
encouraged to discuss treatment plans with beneficiaries and each other.
per CS claim, and the number of pharmacies used.
appointments, they also evaluated beneficiaries’ needs for critical resources (e.g., food, transportation, housing).
CareSource, a
nonprofit managed health care plan headquartered in Dayton, Ohio Largest Medicaid managed health care plan in Ohio and second largest in US. 270 beneficiaries enrolled in
Beneficiaries who
obtained
prescriptions from multiple pharmacies and prescribers were enrolled in the MLIP.
Program included a
pharmacy lock-in restriction with a case management
“wraparound.”
Beneficiaries
received letters informing them that they had to fill all prescriptions at one pharmacy and have
Program administrators acknowledged that many MLIP-enrolled beneficiaries paid cash for prescriptions to avoid lock-in and bypass the MLIP approval process. They reported that they were trying to find effective ways to address this issue.
Strength: case
management “wraparound”
component connected beneficiaries with community resources, social services, and health care professionals.
Case managers were
21
Table 2.2 Association for Community Affiliated Plan’s pilot projects involving implementation of MLIPs in MCOs
MCO MLIP pilot project specifics
Results Strengths/Limitations their pilot
MLIP.
medical services coordinated by their primary care provider.
Beneficiaries were
generally locked-in for 18 months.
acknowledge potential substance abuse and engage in treatment.
Summary of Key Limitations
Similar to the studies reviewed in Section 2.2, key methodologic limitations included lack of comparison populations. As noted above, without such a group, differences due to MLIP enrollment and differences due to other causes (e.g., changing prescribing trends) could not be disentangled. Additionally, the evaluations reviewed in this section, again, failed to examine key patient-oriented health endpoints (e.g., use of MAT, overdose). Finally, while two evaluations considered beneficiary acquisition of CS using non-Medicaid payment sources (e.g., out-of-pocket payment),67,68 these evaluations were limited to either anecdotal reports or small samples with large losses to follow-up, preventing rigorous examination of this issue.
2.4 Evaluations of MLIPs: North Carolina Results
High CS utilization and associated negative consequences among NC Medicaid beneficiaries prompted the establishment of the NC MLIP. In fiscal year 2010 alone,
22
beneficiaries meeting criteria for MLIP enrollment due to potentially inappropriate or high-risk CS use, as determined by the state’s MLIP enrollment criteria (see Table 1.2). However, due to
resource constraints, only about 200 beneficiaries were enrolled each month.
In March 2011, around 950 of 3,000 eligible NC Medicaid beneficiaries were reported to be "locked-in."70 Early evaluation analyses indicated that the MLIP resulted in fewer prescription claims, as well as fewer visits to hospitals, clinics, physician offices and EDs. The reduction in resource utilization translated to a total cost savings of approximately $4,620 per locked-in beneficiary per year.70 In May 2012, the NC Department of Health and Human Services (DHHS) issued a press release on initial MLIP impacts.71 They found that nearly 2,500 beneficiaries had been enrolled in the program, and when prescription claims for the three months before MLIP enrollment were compared to claims for the three months after enrollment, they found that beneficiaries received 2.3 million fewer opioid pills, or approximately 1,000 fewer pills per beneficiary. Additionally, MLIP beneficiaries had fewer hospital, ED, and dental visits and underwent fewer radiology scans and lab tests after enrollment in the program. Lastly, the NC DHHS estimated that more than $5.2 million in medical and pharmacy claim costs were saved in the first year of MLIP operation alone.71
23
beneficiaries’ dispensed CS prescriptions.74 This database linked NC Medicaid Claims data from October 2008 through June 2013 to data from NC’s Controlled Substances Reporting System (CSRS) from October 2009 through June 2013 for beneficiaries enrolled in NC’s MLIP. 26,27 NC’s CSRS is a rich database that provides detailed information on each CS dispensed in the
state through the aggregation of patient, provider, prescription, and pharmacy data, regardless of source of payment.75
The primary aims of this project were focused on gaining a better understanding of how the NC MLIP operates through stakeholder (i.e., pharmacist) interviews and understanding changes in beneficiaries’ prescription dispensing behaviors while enrolled in the MLIP, as compared to periods prior to MLIP enrollment.74 Overall, findings from this project suggested that paying out-of-pocket for CS prescriptions, and not filing with Medicaid, was not a rare practice among MLIP beneficiaries and that integration of this information in MLIP evaluations had the potential to substantially affect our understanding of MLIP impacts.76-78 Below we summarize additional key findings from this project, as well as findings from a UNC dissertation recently completed by Andrew Roberts,79 who also made use of this unique database.
Using Medicaid claims only, Skinner et al. (2015) first set out to determine the effect of the NC MLIP on the number, characteristics, and cost of opioid prescriptions received by beneficiaries.76,80 Claims data from October 2008 through June 2013 were analyzed on
beneficiaries who were ever enrolled in the MLIP (n=6,148). Compared to pre-enrollment, they found that during MLIP enrollment, beneficiaries had fewer opioid prescriptions on average each month (1.6 vs. 0.8), visited fewer pharmacies to obtain opioid prescriptions per month (1.0 vs. 0.5), and had a reduced days’ supply of opioids per month (23.4 vs. 19.5). Additionally, using
24
controlling for race/ethnicity, sex, age, and living arrangement, they found that enrollment in the MLIP resulted in a lower odds of having any opioid prescription.
Building from these analyses, the study team then went on to examine how enrollment in the MLIP might affect circumvention of opioid prescriptions.77,81 Circumvention was defined as paying cash for one’s opioid prescriptions, instead of using the Medicaid payment system. To identify cases of circumvention, Skinner et al. looked for records of Medicaid beneficiaries’
dispensed prescriptions in the CSRS for which there was no corresponding Medicaid claim. They analyzed 4,352 people who were enrolled in the MLIP at some point during the first two years of the program (i.e., from October 2010 through September 2012). Using maximum likelihood mixed effects models with an autoregressive residual error structure and controlling for several demographic variables, they found that enrollment in the MLIP was associated with an increased odds of prescription circumvention. The odds of having a circumvented prescription per
beneficiary per month while enrolled in the MLIP was about 5 times the odds of having one prior to MLIP enrollment. Additionally, they found when compared to the pre-enrollment period, during enrollment in the MLIP, about 0.58 more prescriptions per beneficiary per month were circumvented, 23 additional pills per beneficiary per month were circumvented, and about 0.47 additional prescribers per beneficiary per month were used in obtaining circumvented
prescriptions.
Finally, to supplement findings from these quantitative analyses, qualitative data
25
and abuse in the state.82 Additionally, pharmacists identified several areas needing improvement with respect to MLIP operation, including improved communication by the DMA as to the MLIP’s purpose and specific operating procedures, as well as improved procedures to allow beneficiaries to see multiple prescribers in the same practice and multiple physicians to assist with complex health problems.
To extend the work of the original project, Roberts’ dissertation focused on exploring the characteristics of both beneficiaries who circumvented the MLIP, as well as characteristics of the prescriptions that were circumvented.78,79,83 Roberts constructed a cohort of beneficiaries
enrolled in the MLIP at some point between October 1, 2010 and March 31, 2012. To be
included in the cohort, beneficiaries were required to be continuously enrolled in Medicaid from October 1, 2009 through a minimum of six months after their entry into the MLIP. Using general estimating equations, he found that MLIP enrollment was associated with a four-fold increase in the rate of obtaining circumvented CS per beneficiary per month. Additionally, he found that having circumvented CS fills was more common among MLIP beneficiaries who were younger, who lived in areas with high supplies of dispensing pharmacies, who had an anxiety disorder diagnoses, and who had a high physical comorbidity burden, as measured by the Charlson co-morbidity score. Roberts also completed a prescription-level analysis to examine whether certain opioids were targeted more often for circumvention after enrollment in the MLIP. He found that “riskier” prescriptions (i.e., long-acting opioids, Schedule II opioids, and higher average daily
26
cost prohibitive to pay for out-of-pocket. He concluded that although MLIP enrollment caused beneficiaries to engage in circumvention more often, the risk profile of the specific drugs circumvented did not appear to increase.
Summary of Key Limitations
While initial research evaluating NC’s MLIP improved on key limitations from previous
evaluations (e.g., consideration of all CS prescriptions dispensed to beneficiaries, as opposed to just Medicaid-reimbursed CS prescriptions), gaps remain in our understanding of NC MLIP effects. Specifically, improvement in disentangling MLIP effects from secular trend effects is one potential area for methodologic advancement. Other developments could include
consideration of a larger range of patient-oriented health endpoints (e.g., use of MAT, overdose) and examination of effects over longer time periods (i.e., both immediate and sustained effects).
2.5 Key findings from Studies Examining CS Use Classes and Trajectories
Finally, to inform hypotheses for the second aim of this dissertation, this section provides a brief review of studies examining heterogeneity in trajectories and classes of CS use.
27
Research examining trajectories of benzodiazepine use among adolescents identified four distinct types of users: occasional, decelerating, accelerating, and chronic users.86 Factors
predicting the accelerating or chronic trajectories included having a history of psychosis or epilepsy, having benzodiazepine prescriptions provided by physicians from multiple specialties, and taking benzodiazepine medications with a long half-life. Additionally, research on
trajectories of drug use—including cocaine, opioid, and/or amphetamine use—identified non-user, early occasional users, persistent occasional users, and early frequent/later occasional user types.87 Several characteristics were predictive of continued drug use over time, including demographic characteristics (i.e., black men) and social characteristics (e.g., whether the family of origin was characterized by abuse/neglect and parental substance use).
28
Prescribed average daily doses of opioids were three times higher for those in the two latter groups and was strongly associated with class membership after adjusting for other variables.
2.6 Summary
Little information is available on MLIP impacts on beneficiaries’ healthcare utilization and health outcomes; studies have largely examined cost savings to Medicaid. While MLIPs appear to be a promising approach that may reduce prescription drug misuse, abuse, and
diversion, there is much we do not know about their impacts on beneficiaries enrolled.20 Studies have documented Medicaid-related cost reductions associated with MLIP implementation, as well as reductions in certain medical and pharmacy utilization measures. 35,43,46-52,54,55,57,59-67,69-73 However, these studies have lacked potentially critical information on all CS dispensed to MLIP beneficiaries by only examining CS prescriptions reimbursed by Medicaid. 35,43,46-52,54,55,57,59-67,69-73 Moreover, studies have failed to examine patient-orientated health endpoints, such as risk of
overdose or use of MAT.
The novel, linked NC Medicaid claims-CSRS database provided by the Skinner et al. grant (i.e., the parent study for this dissertation) is among the first of its kind and provides a more complete understanding of Medicaid beneficiaries’ dispensed CS prescriptions.74 While initial
29
CHAPTER 3 – SPECIFIC AIMS
In this dissertation, we examined the impact of the NC MLIP on numbers of dispensed CS prescriptions and the dosages of opioids dispensed following release from the MLIP, providing important information on the sustained impacts of the program. Understanding
whether beneficiaries’ CS prescription fills and opioid dosages decreased, increased, or returned
to similar levels following release from the MLIP, as compared to prior to MLIP enrollment, provides important information on larger program impacts. Moreover, comparing CS dispensing and opioid dosages following release from the MLIP to during MLIP-enrolled periods allowed us to examine the extent to which program impacts (i.e., overall reductions in dispensed CS prescriptions but increased out-of-pocket payments) were sustained or attenuated following release from the MLIP.
30
Aim 1: Assess the impact of exposure to the NC MLIP on numbers of dispensed CS prescriptions and the dosages of opioids dispensed in the year following release from the MLIP. Using generalized estimating equations (GEE) to account for within-individual correlation over time, we examined numbers of dispensed CS prescriptions and dosages of opioids dispensed in the 12-month period following release from the MLIP, compared to a pre-MLIP period. We also estimated measures of association comparing the during pre-MLIP enrollment period to a pre-MLIP period. While we expected that the MLIP had different impacts for
different types of beneficiaries across program periods (e.g., no change in CS use for some, decreased use for others), we hypothesized that we would observe the following average impacts described below.
Hypothesis 1a: On average, the number of CS prescriptions reimbursed by Medicaid and the dosage of opioids obtained from Medicaid-reimbursed prescriptions would be lower following release from the MLIP than prior to enrollment, but greater than during MLIP enrollment.
31
Aim 2: Examine heterogeneity in beneficiaries’ trajectories of dispensed opioid dosages across periods prior to, during, and following release from the MLIP. Using latent class growth analyses, we estimated average opioid dosage trajectories across MLIP-related periods in order to approximate the underlying distribution of trajectories across the MLIP-enrolled
beneficiary population. We quantified and described detected patterns of longitudinal change, as well as the attributes of beneficiaries that were best captured by different trajectories.
Hypothesis: At least three trajectories of dispensed opioid dosages would be identified: a
trajectory that quickly declined during MLIP enrollment and remained low and stable, even post-MLIP; a trajectory that remained at a high but steady level across program periods with little change at program enrollment or disenrollment; and a trajectory that declined during MLIP enrollment and increased post-MLIP, however not to the same level as pre-MLIP. These trajectories were hypothesized to differ according to the following covariates: age, comorbidity burden, and recent history of mental health disorders, pain conditions, and substance use
32 Table 3. Overview of Dissertation Aims
Objective Data Analysis Overview
Overall
To examine
sustained impacts of a MLIP and to gain a detailed
understanding of heterogeneity in dispensed opioid dosages across periods prior to, during, and following release from the MLIP.
Linked NC Medicaid claims-NC CSRS records (i.e., PDMP data) was used for the period of 10/1/2009 through 6/30/2013 (3.75 years of data).
Data included persons enrolled in the MLIP at some point between 10/1/2010 (when the program started) through 9/30/2012.
Observational prospective cohort study design used. See cohort definitions below.
Aim 1 (Chapter 6)
Assess the impact of exposure to the NC MLIP on numbers of dispensed CS prescriptions and the dosages of opioids dispensed in the year following release from the MLIP.
Exposure: 12 months in the MLIP
Outcomes: number of opioid and benzodiazepine prescriptions dispensed per person per month (total #, # reimbursed by Medicaid, # not reimbursed by Medicaid); average daily dosage of opioids dispensed per person (in terms of average daily morphine milligram equivalents (MMEs)) (overall amount, amount obtained from Medicaid-reimbursed prescriptions, amount obtained from
prescriptions not reimbursed by Medicaid)
Covariates: age, sex, race, urbanicity of the beneficiary’s county of residence, overdose death rate in the beneficiary’s county of residence, Medicaid aid category, Medicaid class code, history of alcohol or other substance use-related disorders, history of medication-assisted treatment for opioid addiction, history of an overdose event, number of unique pharmacies visited, number of emergency department visits, number of inpatient admissions, history of
Cohort: independent living adults (e.g., excluded those living in skilled nursing facilities) between the ages of 18 and 64 years who were enrolled in the NC MLIP between October 2010 and September 2012. Followed from the first day of receiving any CS prescription (for outcome of CS dispensed) or opioid prescription (for outcome of MMEs dispensed) on or after October 1, 2009, throughout their period of lock-in, and up to one year following program release or until June 30, 2013,
whichever came first. To avoid conflating program effects for those who remained continuously enrolled in the MLIP and those who exited the MLIP
prior to completion,analyses
were restricted to those who remained in the MLIP for a full 12 months or were administratively censored in June 2013, the last month for which we had data.
33
In Chapter 4, we provide an overview of the methods used to fulfill these aims.
Additional details about the methods, as well as results and discussion of results can be found in Chapters 5-7.
To construct an appropriate cohort for Aim 1 and Aim 2 analyses, we conducted a detailed analysis of those eligible for, enrolled in, and retained in the NC MLIP. Chapter 5 is the
specific pain-related diagnoses (e.g., arthritis, back, neck, headache/migraine,
fibromyalgia, sickle cell), history of specific mental health-related diagnoses (e.g., depression, anxiety, bipolar, schizophrenia), Charlson comorbidity index, and temporal trend measures.
release and during MLIP enrollment were compared to those in a pre-MLIP
enrollment period
GEE were used to provide estimates of measures of association (e.g., count differences, count ratios).
Aim 2 (Chapter 7) Examine heterogeneity in beneficiaries’ trajectories of dispensed opioid dosages across periods prior to, during, and following release from the MLIP.
To examine dispensed opioid dosages, we calculated average daily MMEs of dispensed opioids (paid for using any payment source). For modeling purposes, we averaged each beneficiary’s average daily MMEs across each calendar month. We then log transformed this monthly average to obtain an approximately normal
distribution for improved model estimation. Trajectories were estimated across months prior to, during, and following release from the MLIP.
Latent classes were characterized by the covariates described above in Aim 1.
Cohort same as above (i.e., followed from first day of receiving any opioid prescription on or after October 1, 2009, throughout their period of lock-in, and up to one year following
program release or until June 30, 2013, whichever came first. Followed only those who remained in the MLIP for a full 12 months or were administratively censored in June 2013, the last month for which we had data).
34
35
CHAPTER 4 – METHODS
4.1 Overview
In this dissertation, we applied advanced modeling methods to gain insight into the sustained impacts of NC’s MLIP and to explore heterogeneity in trajectories of dosages (MMEs)
of opioids dispensed across periods prior to, during, and following release from the MLIP. To accomplish these aims, we utilized linked data that provided a comprehensive picture of dispensed CS acquired by beneficiaries.74 This data set allowed for more valid estimation of a MLIP’s impacts by accounting for all CS dispensed, data which other studies have lacked. 35,43,46-52,54,55,57,59-67,69-73 Capturing information on all CS prescriptions dispensed, including those not
submitted for Medicaid reimbursement, allowed us to understand how prescription dispensing is truly changing over time, as compared to how dispensing might appear to be changing in
Medicaid claims. Analyses from the parent study indicated that paying for prescriptions out-of-pocket, as opposed to filing with Medicaid, was not a rare practice among NC MLIP
beneficiaries, and therefore, having information on prescriptions filled by all payment methods, as compared to only those paid for by Medicaid, can notably change our understanding of MLIP impacts.76-79,83
36
Finally, our study used an advanced analytic method, latent class growth analysis (LCGA), to model and explore heterogeneity in beneficiaries’ dosages of opioids dispensed across MLIP-related periods. Latent class growth analysis has become an increasingly popular exploratory tool that can be used to approximate and describe different patterns of change within a larger population.92-98 While the approach has been successfully used to understand
longitudinal change in other substance use-related behaviors for different subpopulations, 85-91,99,100 it has never been used to examine different patterns of change associated with MLIP
enrollment. Identification of different patterns of longitudinal change and the types of
beneficiaries that tend to follow these trajectories can help inform future MLIP improvements.
4.2 Data Sources
In this section, we describe the two databases linked by the parent study (i.e., the CSRS and Medicaid claims), the linking process, and the final dataset available for analysis, including how beneficiaries were enrolled in the MLIP and therefore our analytic dataset. As previously mentioned, the parent study linked NC Medicaid claims to records from NC’s CSRS from October 2009 through June 2013 for all beneficiaries enrolled in NC’s MLIP at some point between October 2010 and September 2012.74
4.2.1 Controlled Substances Reporting System (CSRS)
NC’s CSRS is a rich database that provides detailed information on each CS dispensed in