COMMUNICATION PARTNER ATTITUDES, SOCIAL AND COGNITIVE CHALLENGE, AND SPOKEN LANGUAGE IN APHASIA
Tyson G. Harmon
A dissertation submitted to the faculty at the University of North Carolina at Chapel Hill in partial fulfillment of the requirements for the degree of Doctor of Philosophy in Speech and Hearing Sciences in
the School of Medicine.
Chapel Hill 2018
Approved by: Adam Jacks Katarina L. Haley Antoine Bailliard Sharon W. Williams Emily Buss
ABSTRACT
Tyson G. Harmon: Communication Partner Attitudes, Social and Cognitive Challenge, and Spoken Language in Aphasia
(Under the direction of Adam Jacks and Katarina L. Haley)
The purpose of these studies was to investigate how partner attitudes, attention, and emotion affect communication in aphasia. The first study investigated the attitudes of potential communication partners regarding speech output, speaker attributes and their own feelings after hearing unaltered and digitally modified samples from PWA as well as samples from speakers with no aphasia. Listeners reported less favorable attitudes about PWA than speakers with no aphasia. In addition, samples that were modified to sound more fluent caused listeners to improve their attitudes.
The second study investigated the impact of cognitive and social demands on
psychological stress and spoken language for PWA. Twenty-one PWA (10 moderate, 11 mild) and 12 controls retold short stories to a supportive partner, nonsupportive partner, and with a dual task (i.e., discriminating between high and low tones). Spoken language was measured in terms of content accuracy and delivery speed. Dual task communication was more detrimental to the spoken language of PWA than controls but different speed-accuracy trade-off patterns were noted for the mild and moderate aphasia groups. The effects of communicating with a
iv
After retelling stories in the three experimental conditions, participants were interviewed. Interviews were transcribed and analyzed qualitatively to explore participants’ subjective
reactions when communicating with nonsupportive partners and under divided attention. PWA were found to be biased toward negative stimuli and have a heightened emotional response in these situations. Social and cognitive demands also resulted in less favorable self-perceptions of their performance. To deal with these demands, participants with mild aphasia commented on using a variety of intentional strategies.
Together, these studies show that the speech of PWA leads to unfavorable attitudes, which—when manifest through nonsupportive partner behaviors—results in negative emotional reactions from PWA and distorts their perception of the communication experience.
vi
ACKNOWLEDGMENTS
This dissertation would not have been possible without the help, support, and
encouragement of numerous people. I am deeply grateful for all who offered their time, talents, kind words, and material support. In particular, I wish to thank my dissertation committee, other students and colleagues at UNC who assisted with this work, my family, and the funding sources that made this work possible.
First, I wish to acknowledge my dissertation committee. I appreciate each of you
years to serve and support me. Dr. Emily Buss, thank you for your help with methods and Matlab scripts. Dr. Heidi Roth, thank you for the mentorship you provided to me throughout my doctoral training. I’ve appreciated observing the personal interest you take in your patients and your passion for helping those with neurological communication disorders.
Second, I would like to acknowledge my other assistants, colleagues, and friends at UNC as well as those who participated in the research presented here. A small army of graduate and undergraduate student research assistants helped with data collection, data processing, and coding. Each of them was invaluable. Tayler Simonds and Morgan Billinger went above and beyond fulfilling their research requirement to act as communication partners for the participants in the study. Lena Wedeen helped with recruitment and administration of tests and
questionnaires for the first participants in the study. Marissa Rock, Laura Blizard, Madison Goers, and Daniel Picetti helped with data preparation and coding. In addition, Daniel Picetti spent many hours contributing to the qualitative analysis. I was also blessed with an amazing Ph.D. cohort who provided encouragement all along the way. Most of the participants in these studies volunteered their time to participate in this research. It would not have been possible without their generosity. I wish to sincerely thank each of them.
Third, I wish to acknowledge my family. Brittney, you have believed in me, supported me, and encouraged me through nearly ten years of professional training. You have sacrificed many of life’s comforts to help fulfill this dream. You are my best friend and strongest
inspiration. Thank you for being united with me on this journey! Hannah, Hiram, Andrew, and Daniel, you brought so much joy and meaning to this process. Thanks for your smiles and hugs!
viii
Institute on Deafness and Other Communication Disorders of the National Institutes of Health under award number [R03DC011881]. Samples for the first study were taken from the
AphasiaBank database, which is funded through the National Institute on Deafness and Other Communication Disorders of the National Institutes of Health under award number
[R01DC008524]. While completing portions of the second and third study, I was supported by a doctoral stipend from the National Institute of Neurological Disorders and Stroke under award number [R44NS092144]. During the final year of completing these studies, I was supported by a Dissertation Completion Fellowship from the University of North Carolina at Chapel Hill
TABLE OF CONTENTS
LIST OF TABLES ... xiii
LIST OF FIGURES ... xiv
LIST OF ABBREVIATIONS ... xv
CHAPTER 1: INTRODUCTION ... 1
Communication Partners ... 2
Attention, Emotion, and Language ... 4
Attention ... 4
Emotion ... 5
REFERENCES ... 7
CHAPTER 2: LISTENER PERCEPTIONS OF SIMULATED FLUENT SPEECH IN NONFLUENT APHASIA ... 10
Introduction ... 10
Perceptions of PWA ... 10
Speech fluency as a behavior of interest ... 14
Method ... 16
Participants ... 16
Procedures ... 17
Design and Statistical Analysis ... 22
Results ... 26
Overall Ratings ... 27
Speech Output Ratings ... 27
x
Listener Feeling Ratings ... 29
Discussion... 31
Negative Perceptions of PWA ... 31
Graduate Student Perceptions of PWA ... 32
Improved Perceptions of PWA with Simulated Fluency ... 32
Clinical Implications ... 35
Conclusion ... 38
REFERENCES ... 39
CHAPTER 3: EFFECTS OF SOCIAL AND COGNITIVE DEMANDS ON STORY RETELL IN APASIA ... 43
Introduction ... 43
Attention and Cognitive Demands ... 43
Communication Partners and Social Demands ... 45
Stress in Aphasia ... 46
Potential Links between Attention and Nonsupportive Partner Feedback... 47
Methods for Manipulating Cognitive and Social Demands ... 48
Purpose ... 49
Method ... 50
Participants ... 50
Procedures ... 53
Statistical Analysis ... 60
Results ... 62
Psychological Stress ... 64
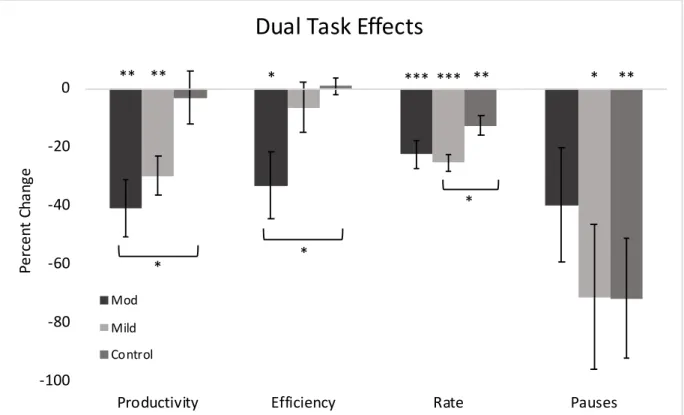
Dual Task Effects ... 65
Nonsupportive Partner Effects ... 68
Discussion... 72
Speed-Accuracy Trade-offs ... 72
Response to Stress Induced by a Nonsupportive Partner... 76
Connections Between Attention, Emotion, and Language ... 80
Conclusion ... 82
REFERENCES ... 83
CHAPTER 4: SUBJECTIVE RESPONSE OF PEOPLE WITH APHASIA TO NONSUPPORTIVE PARTNERS AND A DUAL TASK ... 89
Introduction ... 89
Communication Partners and Emotion ... 89
Noise and Attention ... 91
Purpose ... 92
Method ... 92
Participants ... 93
Procedure ... 93
Analysis ... 98
Results ... 101
Theme I: PWA React Negatively to Nonsupportive Partners and a Dual Task ... 101
Theme II: Nonsupportive Partners and a Dual Task Interfere with the Communication Experience ... 110
Theme III: Active Response to Nonsupportive Partners and a Dual Task ... 115
Discussion... 119
Heightened Emotional Reactions in Aphasia ... 119
Strategies for Improved Everyday Communication ... 122
Limitations ... 123
Promoting Social Participation ... 124
xii
APPENDIX 3.A: CONDITION PRESENTATION GUIDE ... 130
APPENDIX 3.B: LISTENER TRAINING PROTOCOL ... 133
APPENDIX 4.A: INTERVIEW GUIDE ... 136
LIST OF TABLES
Table 2.1. Demographics and Clinical Test Scores from Nine Speaker
Participants ...16
Table 2.2. Audio Sample Information ...18
Table 2.3. Complex Factorial Design for Statistical Analysis. ...23
Table 2.4. Fixed Effects from Mixed Effects Model. ...25
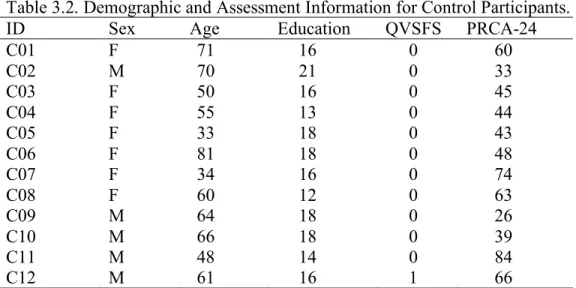
Table 3.1. Demographic and Assessment Information for Participants with Aphasia. ...52
Table 3.2. Demographic and Assessment Information for Control Participants. ...53
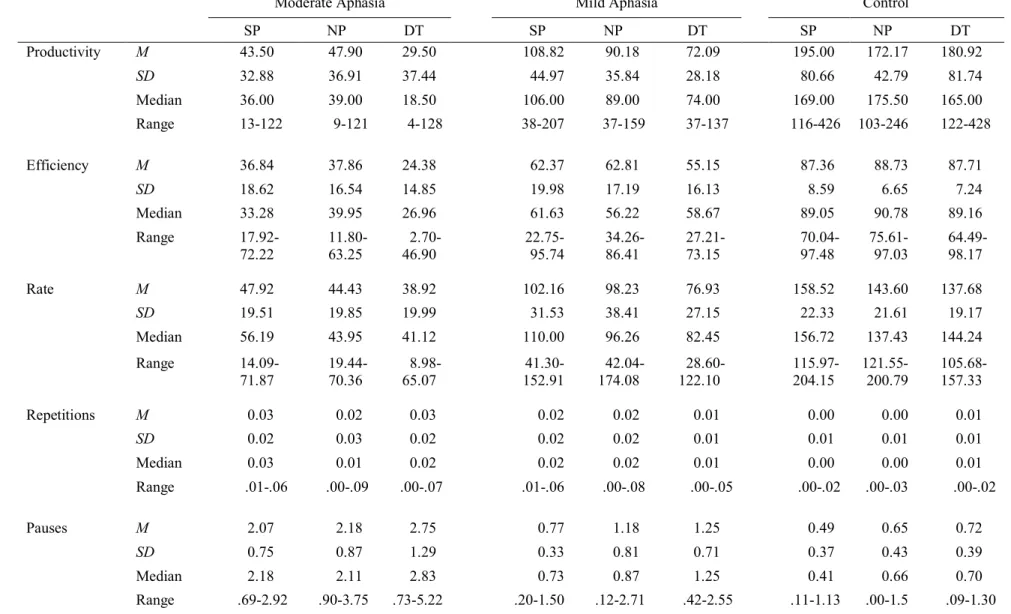
Table 3.3. Descriptive Data for Story Retell Performance Among Participant Groups Within Three Experimental Conditions. ...63
Table 3.4. Means and Standard Deviations for Tone Discrimination Accuracy and Reaction Time in Isolation and while Concurrently Retelling a Story Across Three Groups. ...64
Table 3.5. Correlations Between Perceived Stress and All Spoken Language Behaviors...72
Table 4.1. Participant Information. ...94
Table 4.2. Organizational Structure of Themes, Subthemes, and Categories. ... 100
Table 4.3. Frequency of Communication Partner Behavior Codes ... 103
xiv
LIST OF FIGURES
Figure 2.1. Visual depiction of matched portions of aphasic speech and simulated fluent samples in Praat (Boersma & Weenink, 2014) for
participant P01 ... 19 Figure 2.2. Mean Likert ratings of three audio sample conditions by
undergraduate and graduate student listeners for all dependent variables ... 26 Figure 2.3. Aphasia by Listener Group interactions ... 30 Figure 3.1. Psychological stress ratings reported by each group across three
conditions ... 65 Figure 3.2. Dual task effects on measures of accuracy (productivity and
efficiency) and speed (rate and pauses) during story retell production
across participant groups ... 66 Figure 3.3. Nonsupportive partner effects on measures of accuracy
(productivity and efficiency) and speed (rate and pauses) during story
retell production across participant groups ... 69 Figure 3.4. Dual task and nonsupportive partner effects for each individual
LIST OF ABBREVIATIONS
AQ Aphasia Quotient
AS Aphasic Speech
BNT Boston Naming Test
CCRSA Communication Confidence Rating Scale
DT Dual Task
GDS Geriatric Depression Scale
LG Listener Group
NH Neurologically Healthy
NP Nonsupportive Communication Partner
PRCA-24 Personal Report of Communication Apprehension PWA People with Aphasia
QVSFS Questionnaire for Verifying Stroke-Free Status
RT Response Time
SF Simulated Fluency
SP Supportive Communication Partner
TALSA Temple Assessment of Language processing and Short-term memory in Aphasia TONI-IV Test of Nonverbal Intelligence, Fourth Edition
TPO Time Post-Onset
1
CHAPTER 1: INTRODUCTION
People with aphasia (PWA) struggle to transfer the gains they make in speech language therapy to everyday communication situations and frequently withdraw from social settings (Carragher, Conroy, Sage, & Wilkinson, 2012; Le Dorze, Salois-Bellerose, Alepins, Croteau, & Hallé, 2014; Nadeau, 2014; Parr, 2007). Although mounting evidence has revealed the benefits of speech-language treatment for people with aphasia in general (Brady, Kelly, Godwin, Enderby, & Campbell, 2016), these improvements are most often shown on specific tasks in controlled therapy environments and do not necessarily reflect better daily verbal
communication, which is widely accepted as the ultimate goal of therapy (Nadeau, 2014). Contextual generalization (i.e., the transfer of skills and knowledge to daily conversational life) has rarely been investigated and, when assessed, has proven difficult to achieve (see e.g., Carragher et al., 2012).
One challenge to contextual generalization and social participation in aphasia is that attentional and emotional demands are greater in everyday communication situations than in the therapy room. Everyday communication and participation is influenced, for example, by
communication partner support and environmental noise (Baylor, Burns, Eadie, Britton, & Yorkston, 2011; Garcia, Barrette, & Laroche, 2000; Le Dorze et al., 2014). Thus, the impact of communication partners and the role of attentional and emotional processing in speech and language function are of particular interest when considering improved everyday
Communication Partners
Everyday communication is interactive. It involves at least one person who transmits a message and another who receives it. Both parties influence each other (Bernieri & Rosenthal, 1991; Burgoon, Le Poire, & Rosenthal, 1995). This knowledge has been the impetus for much of the work on communication partner training, which seeks to improve the communication of PWA by teaching their partner to be supportive (see Simmons-Mackie, Raymer, Armstrong, Holland, & Cherney, 2010; Simmons-Mackie, Raymer, & Cherney, 2016).
Important aspects of communication partner support are the partner’s attitude toward the speaker and the nonverbal behaviors they demonstrate. With this in mind, communication partner training programs may give special attention to how partners view and react to PWA (e.g., Kagan, Black, Duchan, Simmons-Mackie, & Square, 2001; Lock et al., 2001). For example, partners might be trained to be patient and friendly in order to help PWA feel comfortable.
While training communication partners to be supportive is important, it is most practical for close family members and friends. To improve generalization and social participation, PWA need opportunities to communicate in social settings outside their home. In such settings, they will inevitably confront partners who are not trained in supportive communication (Dalemans, de Witte, Wade, & van den Heuvel, 2010; Davidson, Howe, Worrall, Hickson, & Togher, 2008; Parr, 2007). The attitudes of these partners toward PWA and the impact of their behaviors on the emotional response of PWA are important to consider.
3
of listeners who heard narrative samples from participants with no aphasia and PWA. To understand how speech fluency affects perceptions, an additional group of simulated fluent samples was also included. These samples were modified by deleting all disfluent behaviors. Because previous studies suggest that a lack of knowledge and education about aphasia contributes to nonsupportive attitudes and behaviors (Dalemans et al., 2010; Le Dorze et al., 2014), we divided potential communication partners into two groups based on their educational experience. We found that potential communication partners perceived PWA less favorably but their perceptions were more favorable when aphasic samples were made fluent. Even those with some education about aphasia perceived PWA significantly less favorably and experienced feelings of impatience and discomfort.
The finding that potential communication partners experience less favorable perceptions of PWA based on their speech output formed the foundation for the studies reported in chapters 3 and 4. Partners’ feelings of discomfort and impatience are likely to be reflected in the behaviors they demonstrate during a communicative exchange. But do these behaviors affect PWA? One aim of chapters 3 and 4 was to understand how nonsupportive partner behaviors influence how PWA feel. In chapter 3, we measured psychological stress quantitatively using a self-report rating scale. In chapter 4, we explored comments that participants made during a semi-structured interview about their emotional reaction to a nonsupportive partner. In each study emotional reactions were compared between participants with mild, moderate, and no aphasia. The findings showed that talking to a nonsupportive partner induces more stress and a stronger overall
Attention, Emotion, and Language
Among other higher order cognitive functions, attention and emotion influence communication and may be subserved by neural networks that dynamically interconnect with language networks (Cahana-Amitay & Albert, 2015b). Neuroimaging studies have demonstrated that attention networks are involved in novel verb generation (Pertersen & Fiez, 1993), self-monitoring, and self-correction during verb generation (Myachykov & Posner, 2005), and sentence processing (Rogalsky & Hickok, 2009). Language tasks have also been shown to increase physiological stress response, which suggests the involvement of the hypothalamo-pituitary-adrenal axis (Dickerson & Kemeny, 2004). In addition, various studies have shown that anxiety can lead to a breakdown in communication (Buchanan, Laures-Gore, & Duff, 2014; Cahana-Amitay et al., 2015; Christenfeld & Creager, 1996). These and similar findings led to the development of the theory of neural multifunctionality, which posits that the dynamic interaction and integration of neural networks responsible for linguistic and nonlinguistic functions (e.g., attention and emotion) determines communicative performance and impacts language
rehabilitation (Cahana-Amitay & Albert, 2015a, 2015b). Attention
Multiple studies have shown that PWA are vulnerable to deficits in attention, which impact their nonlinguistic and linguistic processing (e.g., Erickson, Goldinger, & LaPointe, 1996; LaPointe & Erickson, 1991; Murray, Holland, & Beeson, 1997; Tseng, McNeil, &
Milenkovic, 1993). Further, Murray (2012) found that most PWA score in the impaired range on standardized measures of attention with more complex attention skills having stronger
5
Hinckley and Carr (2005) used a divided attention task to simulate real-world distractions during a functional treatment program.
To our knowledge, only one study has previously investigated the effects of divided attention on running speech in aphasia (Murray, Holland, & Beeson, 1998). Unlike that study, we used a narrative discourse task and included measures of speech fluency and a moderate aphasia group. Our aim was to understand how divided attention differentially affects content accuracy and delivery speed among people with mild, moderate, and no aphasia. Our findings revealed group-specific speed accuracy trade-offs. Chapter 4 expanded on these findings to explore the subjective experience of PWA when communicating under divided attention. Emotion
Along with attention, emotion plays an important role in language function and recovery from aphasia. Symptoms of depression and anxiety are common after stroke (Hackett, Yapa, Parag, & Anderson, 2005) and may be even more prevalent for those with aphasia (Shehata, El Mistikawi, Risha, & Hassan, 2015). Using language may be one source of stress for PWA (Cahana-Amitay et al., 2011; Laures-Gore, Heim, & Hsu, 2007), but the social situations in which language is used might also contribute to these feelings. Qualitative studies have found that communication partner reactions and noisy environments can cause barriers to
communication and participation for PWA (Baylor et al., 2011; Garcia et al., 2000).
Chapter 3 addressed how perceived stress (induced by talking to a nonsupportive partner) affects communication for people with mild, moderate, and no aphasia. In chapter 4, we
communication were found to vary, its influence might be particularly detrimental over time because of how it affects the way PWA perceive their communication experiences.
Taken together, the three studies presented herein represent first steps toward
7
REFERENCES
Baylor, C., Burns, M., Eadie, T., Britton, D., & Yorkston, K. (2011). A qualitative study of interference with communicative participation across communication disorders in adults. American Journal of Speech-Langauge Pathology, 20(November), 269–287.
http://doi.org/10.1044/1058-0360(2011/10-0084)intervention
Bernieri, F. J., & Rosenthal, R. (1991). Interpersonal coordination: Behavioral matching and interactional synchrony. In R. S. Feldman & B. Rime (Eds.), Fundamentals of Nonverbal Behavior (pp. 401–433). New York, NY: Cambridge University Press.
Brady, M. C., Kelly, H., Godwin, J., Enderby, P., & Campbell, P. (2016). Speech and language therapy for aphasia following stroke. In M. C. Brady (Ed.), Cochrane Database of
Systematic Reviews. Chichester, UK: John Wiley & Sons, Ltd. http://doi.org/10.1002/14651858.CD000425.pub4
Buchanan, T. W., Laures-Gore, J. S., & Duff, M. C. (2014). Acute stress reduces speech fluency. Biological Psychology, 97(1), 60–66. http://doi.org/10.1016/j.biopsycho.2014.02.005
Burgoon, J. K., Le Poire, B. A., & Rosenthal, R. Effects of preinteraction expectancies and target communication on perceiver reciprocity and compensation in dyadic interaction, 31Journal of Experimental Social Psychology 287–321 (1995). http://doi.org/10.1006/jesp.1995.1014 Cahana-Amitay, D., & Albert, M. L. (2015a). Neuroscience of aphasia recovery : the concept of
neural multifunctionality. Current Neurology and Neuroscience Reports, 15(41). http://doi.org/10.1007/s11910-015-0568-7
Cahana-Amitay, D., & Albert, M. L. (2015b). Redefining recovery from aphasia. New York: Oxford University Press.
Cahana-Amitay, D., Albert, M. L., Pyun, S.-B., Westwood, A., Jenkins, T., Wolford, S., & Finley, M. (2011). Language as a stressor in aphasia. Aphasiology, 25(2), 593–614. http://doi.org/10.1080/02687038.2010.541469
Cahana-Amitay, D., Oveis, A. C., Sayers, J. T., Pineles, S. L., Spiro, A., & Albert, M. L. (2015). Biomarkers of “Linguistic Anxiety” in aphasia: A proof-of-concept case study. Clinical Linguistics & Phonetics, 29(5), 401–413. http://doi.org/10.3109/02699206.2015.1014572
Carragher, M., Conroy, P., Sage, K., & Wilkinson, R. (2012). Can impairment-focused therapy change the everyday conversations of people with aphasia? A review of the literature and future directions. Aphasiology, 26(7), 895–916.
http://doi.org/10.1080/02687038.2012.676164
Christenfeld, N., & Creager, B. (1996). Anxiety , Alcohol , Aphasia , and Ums. Journal of Personality and Social Psychology, 70(3), 451–460. http://doi.org/10.1037//0022-3514.70.3.451
through the eyes of people with aphasia. International Journal of Language &
Communication Disorders, 45(5), 537–550. http://doi.org/10.3109/13682820903223633
Davidson, B., Howe, T., Worrall, L., Hickson, L., & Togher, L. (2008). Social participation for older people with aphasia: The impact of communication disability on friendships. Topics in Stroke Rehabilitation, 15(4), 325–340. http://doi.org/10.1310/tsr1504-325
Dickerson, S. S., & Kemeny, M. E. (2004). Acute stressors and cortisol responses: A theoretical integration and synthesis of laboratory research. Psychological Bulletin, 130(3), 355–391. http://doi.org/10.1037/0033-2909.130.3.355
Erickson, R. J., Goldinger, S. D., & LaPointe, L. L. (1996). Auditory vigilance in aphasic individuals: Detecting nonlinguistic stimuli with full or divided attention. Brain and Cognition, 30(2), 244–253. http://doi.org/10.1006/brcg.1996.0016
Garcia, L. J., Barrette, J., & Laroche, C. (2000). Perceptions of the obstacles to work reintegration for persons with aphasia. Aphasiology, 14(3), 269–290.
http://doi.org/10.1080/026870300401478
Hackett, M. L., Yapa, C., Parag, V., & Anderson, C. S. (2005). Frequency of depression after stroke: A systematic review of observational studies. Stroke, 36, 1330–1340.
http://doi.org/10.1161/01.STR.0000165928.19135.35
Hinckley, J., & Carr, T. (2005). Comparing the outcomes of intensive and non-intensive context-based aphasia treatment. Aphasiology, 19(10–11), 965–974.
http://doi.org/10.1080/02687030544000173
Kagan, A., Black, S., Duchan, J., Simmons-Mackie, N., & Square, P. (2001). Training Volunteers as Conversation Partners Using “Supported Conversation for Adults With Aphasia” (SCA): A Controlled Trial. Journal of Speech, Language, and Hearing Research, 44(June), 624–638.
LaPointe, L. L., & Erickson, R. J. (1991). Auditory vigilance during divided task attention in aphasic individuals. Aphasiology, 5(6), 511–520.
http://doi.org/10.1080/02687039108248556
Laures-Gore, J. S., Heim, C. M., & Hsu, Y.-S. (2007). Assessing cortisol reactivity to a linguistic task as a marker of stress in individuals with left-hemisphere stroke and aphasia. Journal of Speech Language and Hearing Research, 50(2), 493.
http://doi.org/10.1044/1092-4388(2007/034)
Le Dorze, G., Salois-Bellerose, É., Alepins, M., Croteau, C., & Hallé, M.-C. (2014). A
description of the personal and environmental determinants of participation several years post-stroke according to the views of people who have aphasia. Aphasiology, 28(4), 421– 439. http://doi.org/10.1080/02687038.2013.869305
9
International Journal of Language & Communication Disorders, 36(s1), 25–30. http://doi.org/10.3109/13682820109177853
Mayer, J. F., & Murray, L. L. (2012). Measuring working memory deficits in aphasia. Journal of Communication Disorders, 45(5), 325–39. http://doi.org/10.1016/j.jcomdis.2012.06.002
Murray, L. L., Holland, A. L., & Beeson, P. M. (1997). Auditory processing in individuals with mild aphasia: a study of resource allocation. Journal of Speech, Language & Hearing Research, 40(4), 792–808 17p.
Murray, L. L., Holland, A. L., & Beeson, P. M. (1998). Spoken language of individuals with mild fluent aphasia under focused and divided-attention conditions. Journal of Speech Language and Hearing Research, 41(1), 213–227.
Myachykov, A., & Posner, M. I. (2005). Attention in language. In L. Itti, G. Rees, & J. Tsotsos (Eds.), Neurobiology of Attention (pp. 324–329). New York: Academic Press/Elseivier. http://doi.org/10.1016/B978-012375731-9/50057-4
Nadeau, S. E. (2014). Neuroplastic mechanisms of language recovery after stroke. In Cognitive Plasticity in Neurologic Disorders (pp. 61–84). Oxford University Press.
http://doi.org/10.1093/med/9780199965243.001.0001
Parr, S. (2007). Living with severe aphasia: Tracking social exclusion. Aphasiology, 21(1), 98– 123. http://doi.org/10.1080/02687030600798337
Pertersen, S. E., & Fiez, J. A. (1993). The processing of single words studies with positron emission tomography. Annual Review of Neuroscience, 16, 509–530.
Rogalsky, C., & Hickok, G. (2009). Selective attention to semantic and syntactic features modulates sentence processing networks in anterior temporal cortex. Cerebral Cortex, 19(4), 786–796. http://doi.org/10.1093/cercor/bhn126
Shehata, G. A., El Mistikawi, T., Risha, A. S. K., & Hassan, H. S. (2015). The effect of aphasia upon personality traits, depression and anxiety among stroke patients. Journal of Affective Disorders, 172, 312–314. http://doi.org/10.1016/j.jad.2014.10.027
Simmons-Mackie, N., Raymer, A., Armstrong, E., Holland, A., & Cherney, L. R. (2010). Communication Partner Training in Aphasia: A Systematic Review. Archives of Physical Medicine and Rehabilitation, 91(12), 1814–1837. Retrieved from
http://www.sciencedirect.com/science/article/pii/S0003999310007719
Simmons-Mackie, N., Raymer, A., & Cherney, L. R. (2016). Communication partner training in aphasia: An updated systematic review. Archives of Physical Medicine and Rehabilitation, 97(12), 2202–2221.e8. http://doi.org/10.1016/j.apmr.2016.03.023
CHAPTER 2: LISTENER PERCEPTIONS OF SIMULATED FLUENT SPEECH IN NONFLUENT APHASIA1
Introduction
Listener perceptions play an important role in the communicative interactions of people with aphasia (PWA). Listeners often perceive the speech output and personal attributes of PWA less favorably than their peers (Allard & Williams, 2008; Croteau & Le Dorze, 2001; Zraick & Boone, 1991). Additionally, listeners may perceive themselves as having negative feelings in response to PWA. Communication partner training has shown that listeners can change their perceptions of PWA and contribute to improved communicative interaction (Kagan, Black, Duchan, Simmons-Mackie, & Square, 2001). While directly training the listener is an important way to change societal impressions, listeners’ perceptions may also change as PWA modify their speech and language behaviors. Behavioral modification might similarly lead to increased opportunities for successful communicative interactions. The relationship between the speech behavior of PWA and societal impressions, however, has rarely been investigated. The present study examined the impact of digitally altered fluency on listener perceptions of people with nonfluent aphasia.
Perceptions of PWA
PWA are concerned about the way they are perceived by communication partners. In semi-structured interviews, PWA have identified negative perceptions of communication partners as causing them to feel misunderstood and unsupported. These perceptions create
1 This chapter previously appeared as an article in Aphasiology. The original citation is as follows: Harmon TG, Jacks A, Haley KL, Faldowski RA. Listener perceptions of simulated fluent speech in nonfluent aphasia.
11
barriers to their communicative participation (Le Dorze, Salois-Bellerose, Alepins, Croteau, & Hallé, 2014; Le Dorze & Brassard, 1995). Parr (2001) reported on qualitative interview data from 50 PWA and found that disabling attitudes such as ignorance, prejudice, and pity were among the principal social barriers interviewees described. For example, one PWA commented about being ignored in public places, while another remarked on being deemed an “imbecile” (Parr, 2001, p. 276). Others have observed that being viewed as “stupid” is, in fact, a common fear for many PWA (Kagan, 1998). Such negative perceptions can increase the burden of communication and augment anxiety or apprehension about social interaction. PWA have specifically reported holding back, withdrawing, and even avoiding social situations because they were afraid of being perceived negatively (Le Dorze et al., 2014).
Unfortunately, in accordance with their fears, negative perceptions of PWA seem to be a reality. Previous research clearly suggests that loved ones and the general public perceive PWA, particularly those with nonfluent aphasia, less favorably than their peers. These negative
assumptions are not restricted to the speech output but also include negative impressions about the character, personality, and attributes of PWA. Zraick and Boone (1991) compared
their partner with aphasia significantly worse in achievement, endurance, and organization. The authors argued that negative spousal perceptions might exacerbate the impairments of PWA. In other words, their abilities may decrease due to diminished spousal expectations associated with negative perceptions.
The personality and attributes of PWA are also perceived less favorably by unfamiliar communication partners. Several studies have documented that unfamiliar communication partners may not be aware of the competence and intelligence of PWA. (Kagan, 1998; Le Dorze et al., 2014; Simmons-Mackie & Damico, 2007; Simmons-Mackie & Elman, 2011). However, the perceptions of unfamiliar communication partners have mostly been reported from the perspective of PWA. One exception is a study conducted by Allard and Williams (2008) in which 445 listeners heard an actor’s depiction of Wernicke’s aphasia, articulation disorder, stuttering, voice disorder, and no disorder. They found that listeners perceived the Wernicke’s aphasia condition as significantly less decisive and reliable, and more anxious than the other four conditions. Although little research is available regarding listeners’ perceptions of PWA, less favorable speaker attributes appear to be ascribed to PWA by both familiar and unfamiliar communication partners.
13
unaided aphasic speech. The listeners reported that their discomfort was, in part, due to lack of understanding and difficulty fulfilling their role as communication partner.
Listener discomfort may cause people to avoid conversations with PWA. This is evident from both the perspective of PWA and their communication partners. PWA have reported that speaking partners seem to avoid attempting or pursuing conversation with them due to
discomfort (Le Dorze et al., 2014). Family members and friends have reported regularly
performing communicative tasks such as reading, writing, and answering questions for the PWA (Le Dorze & Brassard, 1995). Discomfort felt by communication partners may limit social interaction for PWA.
Communication partner perceptions regarding speech, speaker attributes, and their own feelings during interaction have important implications for autonomy and identity of PWA. Shadden and Agan (2004) described that fostering values of respect, acceptance, validation, and encouragement were key elements of a stroke support group that aimed to nurture identity. In a qualitative analysis of a group therapy session involving 10 people with aphasia, Simmons-Mackie and Elman (2011) confirmed that respect and an assumption of competence by communication partners marked important aspects of identity renegotiation during group
therapy. From these two studies, it appears that fostering positive perceptions of PWA is critical in successfully renegotiating identity.
are looked down on. The authors proposed that the solution to these issues includes partners perceiving PWA as competent and able to contribute to an interaction. Because negative perceptions interfere with communication, they have been targeted in communication partner training (Kagan et al., 2001; Kagan, 1998).
Perceptions of communication partners can change with intervention. In communication partner training, partners are taught to successfully converse with PWA (Simmons-Mackie, Raymer, Armstrong, Holland, & Cherney, 2010; Turner & Whitworth, 2006). Training usually includes strategies that partners can integrate into their interactions to improve the
communicative exchange and encourage participation (Turner & Whitworth, 2006). One area of emphasis in Supported Conversation for Adults with Aphasia (SCA; Kagan et al., 2001) is acknowledging competence, which includes an assumption of competence as well as attitudes of encouragement, support, and respect. Kagan et al. (2001) found that 17 out of 20 trained
volunteers improved in their scores of acknowledging competence during a conversation with PWA. Thus, direct intervention can affect partner communication, which may, in turn, improve their perceptions and overall interactions with PWA.
Speech fluency as a behavior of interest
15
1982). Both language and motor speech impairments common in nonfluent aphasia (i.e., anomia, agrammatism, or apraxia of speech) are likely to contribute to disfluent speech production (McNeil & Copland, 2011). For example, poor word retrieval may result in pauses and
hesitations, agrammatism might impact rhythm, and difficulties programming motor speech tasks may trigger revisions and repetitions.
Increased speech fluency through simulation has led to improved listener perceptions of people who stutter (Evans, Healey, Kawai, & Rowland, 2008; Panico, Healey, Brouwer, & Susca, 2005; Susca & Healey, 2001). These improvements have been shown across listener perceptions regarding speech output, speaker attributes, and listener feelings in response to stuttered speech (Evans et al., 2008; Lay & Burron, 1968; Panico et al., 2005; Susca & Healey, 2001, 2002; Von Tiling, 2011). Conversely, listeners have made more negative comments about the character traits (i.e., pleasantness, friendliness, confidence, and intelligence) of more
disfluent speakers (Susca & Healey, 2002; Von Tiling, 2011). Listeners also perceive themselves as less comfortable, expending more effort, and becoming more impatient while listening to increasingly disfluent speech (Panico et al., 2005; Susca & Healey, 2001, 2002). The impact that speech fluency has on listener perceptions of people who stutter might transfer to other
populations such as PWA.
who had taken a course about neurogenic communication disorders and undergraduate students differed in their perceptions of PWA. Because communication partner training has been shown to improve behaviors of acknowledging competence (Kagan et al., 2001), we hypothesized that graduate student listeners would perceive PWA more positively than undergraduate listeners.
Method Participants
Speakers. Audio samples were obtained from nine speakers using the AphasiaBank database (http://talkbank.org/AphasiaBank/). These were monologue language samples from the discourse production portion of the AphasiaBank protocol for story narrative (AphasiaBank, 2007). Six aphasic speech samples were obtained using the following criteria: Western Aphasia Battery (WAB; Kertesz, 2006) classification of Broca’s aphasia, WAB aphasia quotient of greater than 40, and Boston Naming Test short form (Kaplan, Goodglass, & Weintraub, 1983) score of greater than or equal to five (see Table 2.1). The remaining three AphasiaBank samples were from neurologically healthy speakers.
Table 2.1. Demographics and Clinical Test Scores from Nine Speaker Participants
Speaker Sex Age BNT WAB
Fluency
WAB Aphasia Quotient
WAB Classification
P01 F 69.9 6 2 63.9 Broca
P02 M 66.2 8 4 77.6 Broca
P03 F 54.7 8 4 59.4 Broca
P04 M 41.9 9 4 70.1 Broca
P05 F 53.9 5 4 40.9 Broca
P06 M 54.9 11 4 72.2 Broca
P07 F 75.6 NA NA NA Control
P08 M 41.0 NA NA NA Control
P09 F 61.3 NA NA NA Control
Note. BNT = Boston Naming Test (Kaplan, Goodglass, & Weintraub, 1983); WAB = Western Aphasia Battery Revised (Kertesz, 2006).
Listeners. Thirty-six adults participated as listeners. Eighteen were undergraduate
17
declared a variety of majors and were between the ages of 18 and 22 (M = 19.5). Eighteen were graduate level speech-language pathology (SLP) students (15 females) between the ages of 22 and 40 (M = 26.5). Fourteen graduate students and five undergraduate students reported 10 or more hours listening to or working with adults with speech or language problems. In addition, all graduate students had taken at least one semester-long course about adult neurogenic
communication disorders.
Listeners were asked to rate nine audio samples from three sample conditions. Ratings were based on listeners’ perceptions of the speech, thoughts about the speaker, and feelings associated with listening to the sample.
Procedures
Audio samples. After selection, each of the six aphasic speech samples was modified to create a simulated fluent sample. Information about the audio samples used in the study is summarized in Table 2.2. The first author followed a procedure used in previous studies (Lay & Burron, 1968; Susca & Healey, 2001) to create simulated fluent samples in Audacity 2.0.5 (Audacity Team, 2013) by deleting pauses greater than 0.4 seconds, fillers, filled pauses,
samples were rated as unmodified, three were rated as equivocally modified, and one was rated as slightly modified. None were rated as moderately or heavily modified.
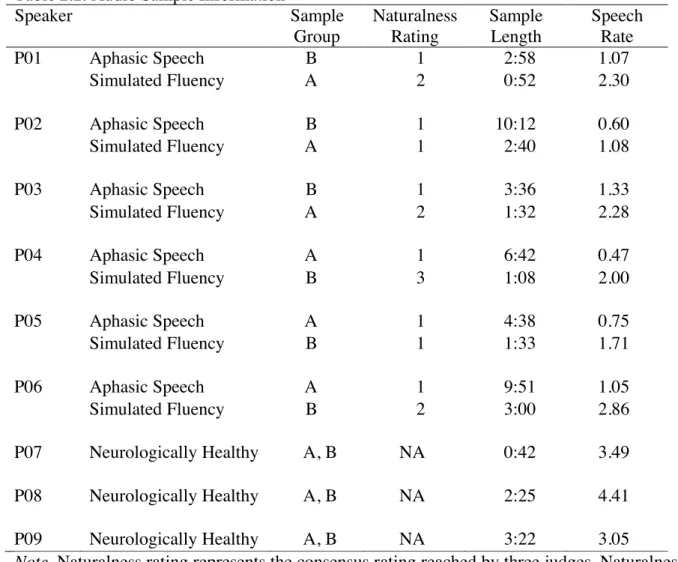
Table 2.2. Audio Sample Information
Speaker Sample
Group
Naturalness Rating
Sample Length
Speech Rate
P01 Aphasic Speech B 1 2:58 1.07
Simulated Fluency A 2 0:52 2.30
P02 Aphasic Speech B 1 10:12 0.60
Simulated Fluency A 1 2:40 1.08
P03 Aphasic Speech B 1 3:36 1.33
Simulated Fluency A 2 1:32 2.28
P04 Aphasic Speech A 1 6:42 0.47
Simulated Fluency B 3 1:08 2.00
P05 Aphasic Speech A 1 4:38 0.75
Simulated Fluency B 1 1:33 1.71
P06 Aphasic Speech A 1 9:51 1.05
Simulated Fluency B 2 3:00 2.86
P07 Neurologically Healthy A, B NA 0:42 3.49
P08 Neurologically Healthy A, B NA 2:25 4.41
P09 Neurologically Healthy A, B NA 3:22 3.05
Note. Naturalness rating represents the consensus rating reached by three judges. Naturalness ratings were provided on the following scale: 1 = unmodified; 2 = equivocally/questionably modified; 3 = slightly modified; 4 = moderately modified; 5 = heavily modified. Sample length is represented in minutes and seconds (MM:SS). Speech rate represents syllables per second.
Syllable boundaries were coded automatically using a customized syllable identification routine implemented in Praat to obtain the number of syllables produced in each sample
19
proxy measure for speech fluency but did not count specific disfluent behaviors or percentage of disfluencies, as the reliability of coding for these is often limited (e.g. Curlee, 1981). The speech rate for the simulated fluent samples was, on average, 2.49 syllables per second greater than the speech rate for the aphasic speech samples. The mean duration of the aphasic speech, simulated fluent, and neurologically healthy samples were 6 min 19 s (SD = 3 min 8 s), 1 min 47 s (SD = 51 s), and 2 min 9 s (SD = 1 min 21 s) respectively. Figure 2.1 shows a spectrogram of a paired portion of the aphasic speech and simulated fluent samples for P01.
For listening purposes, the speech samples were partitioned into two groups so that no listener could hear the same speaker with aphasia under both the unmodified and simulated fluency conditions. If a speaker’s unmodified speech sample appeared in group A, his/her
simulated fluent speech sample had to appear in group B, and vice versa. All listeners heard three samples of unmodified aphasic speech, three samples of simulated fluent speech, and three samples from neurologically healthy speakers (see Table 2.2, “Listener Group” column). To keep the listeners blind to the experimental manipulation, they were not informed about the editing or modification of the aphasic speech samples.
Questionnaire. The questionnaire consisted of nine seven-point Likert statements (ranging from strongly disagree to strongly agree). The nine statements were formulated based on adaptation of similar questionnaires used in the stuttering literature (Evans et al., 2008; Panico et al., 2005; Susca & Healey, 2001). The statements were divided into three categories (i.e., speech output, speaker attributes, listener feelings) to measure various aspects of listener perception. As previously explained, listener perceptions are not confined to impressions about speech behavior per se, but also encompass thoughts about the personality and characteristics of the speaker and feelings that listeners experience in response to speech (Ostrom, 1969).
Separation of the statements into the three categories followed a procedure used by Evans et al. (2008) who divided individual Likert statements into behavioral (pertaining to the speech), cognitive (pertaining to thoughts about the speaker), and affective (pertaining to feelings)
responses. The nine declarations included two concerning speech output (Sp), four about speaker attributes (SA), and three regarding listener feelings (LF). The nine statements were:
21
2. This person’s speech made me feel impatient. (LF)
3. I felt like listening to this person speak took a lot of effort. (LF) 4. This person told the story easily. (Sp)
5. I think this person is intelligent. (SA) 6. I think this person lacks confidence. (SA) 7. I think this person is a competent speaker. (SA) 8. This person’s speech was hard to understand. (Sp)
9. I think this person would have a hard time making friends. (SA)
Three open-ended questions were also included in the questionnaire to probe qualitative aspects of the listeners’ perceptions. Responses from open-ended questions are not reported in this study.
Data collection. Listening sessions occurred individually (12 listeners) or in groups ranging in size from two to six people (24 listeners). All sessions took place on the UNC-CH campus in a quiet room behind closed doors. Sessions were randomly assigned to either sample group A or B. The order of sample presentation was randomized for each of these groups. Although all listeners during group sessions listened to the same sample group, an equal number of graduate and undergraduate student listeners heard the same samples in the same order. The audio samples were presented in a sound field over PC speakers. To ensure a comfortable intensity level, listeners were given control of adjusting the speaker volume throughout the session. In the group listening sessions, one listener was assigned volume control for the group.
the session. The first author was present at each listening session to provide instructions and ensure that no discussion took place between listeners.
Listeners responded to nine Likert statements, presented in randomized order,
immediately following the presentation of each sample. In other words, listeners heard a sample, rated their perceptions of that sample, then repeated the process for a different speaker. Each listener or group heard each of the nine samples once. When a listening session occurred in a group, all listened to the same sample simultaneously then provided individual responses to Likert statements. Upon completing the listening session, the listeners were asked to keep details of the experiment confidential in order to avoid biasing the responses of future participants. Prior to data analysis, scores from all negatively worded Likert statements were inverted so higher scores would represent more positive perceptions across all questions.
Design and Statistical Analysis
23
sample (P01*) would appear in Sample Group B, and vice versa (see Table 2.3). This prevented
any listener from hearing both the unmodified and modified speech samples of any speaker. As also shown in Table 2.3, the within group factors were crossed with a between group factor for Listener Group (Undergraduate, Graduate).
Table 2.3. Complex Factorial Design for Statistical Analysis.
Within Group Factors Aphasia Factor
Aphasic Non-aphasic
Fluency Factor Fluency
Unmodified Modified Fluency
Speakers Speakers Speakers
Between Group Factor
Undergraduate Student Listeners
Group A P04, P05, P06 P01*, P02*, P03* P07, P08, P09
Group B P01, P02, P03 P04*, P05*, P06* P07, P08, P09
Graduate Student Listeners
Group A P04, P05, P06 P01*, P02*, P03* P07, P08, P09
Group B P01, P02, P03 P04*, P05*, P06* P07, P08, P09
Note. * indicates simulated fluent speech.
Listener ratings were analyzed using a mixed effects ANOVA model. Dependent
variables included Likert scores for each individual question and an overall composite (average) of the nine questions. A mixed effects ANOVA model was especially appropriate in the present application because it allowed for both estimation of the same error terms as a conventional repeated measures ANOVA and estimation of additional sources of heterogeneity associated with speakers. Mixed effects models also allow for estimation of fixed effects such as those associated with Aphasia, Fluency, and Listener Group. It should be noted that, due to nesting, we can only uniquely estimate the nested effect of the Fluency factor and not a Fluency by Aphasia interaction.
determine the effects of different speakers on listener perceptions but rather the effects of aphasia and simulated fluency, we included these terms in all models, but treated them as statistical nuisance parameters. That is, they were treated as effects that must be included in statistical models in order to obtain unbiased estimates of the primary effects of interest but are not of inherent interest themselves. Although space and parsimony preclude reporting the secondary effects in detail, we note that numerous speaker effects were observed.
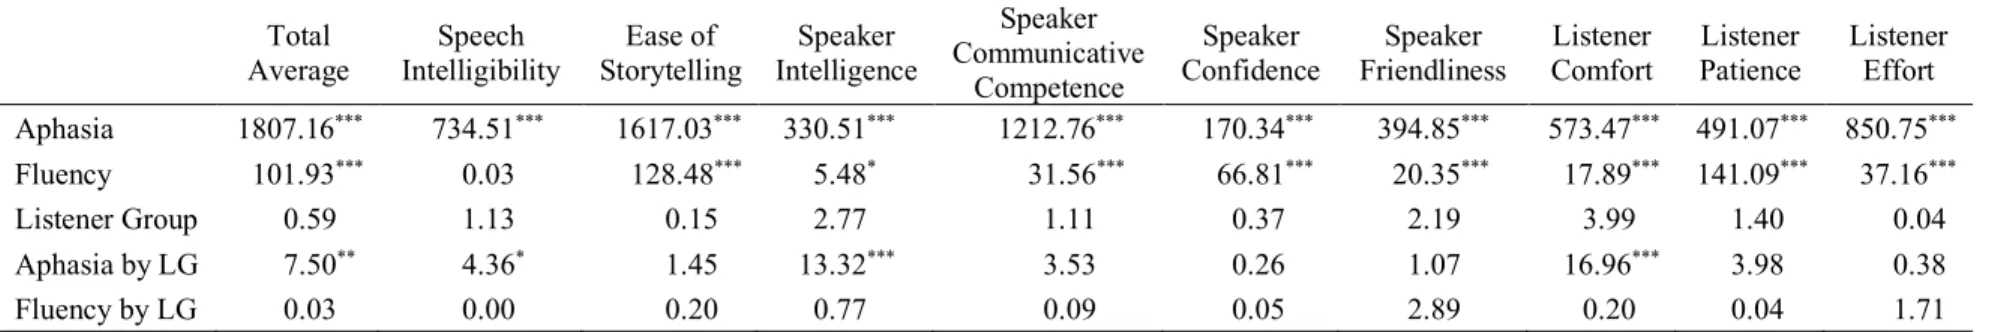
Primary effects of interest in this study were ones involving Aphasia, Fluency, Listener Group, and interactions of Aphasia by Listener Group and Fluency by Listener Group. This model was reduced to find the most parsimonious model for each of the ten dependent variables, but for completeness, we report results based on the full model (see Table 2.4).
Following mixed effects model analyses, least squares means tests (i.e., marginal means) were completed for follow up on statistically significant 2-way interaction effects. All analyses to test assumptions and visualize the data were conducted using R version 3.0.2 (R Core Team, 2014). Mixed effects models and least squares means follow up analyses were completed with SAS version 9.2. The alpha level was set at .05 for all tests.
25
Table 2.4. Fixed Effects from Mixed Effects Model. Total
Average Intelligibility Speech Storytelling Ease of Intelligence Speaker
Speaker Communicative
Competence
Speaker
Confidence Friendliness Speaker Comfort Listener Patience Listener Listener Effort Aphasia 1807.16*** 734.51*** 1617.03*** 330.51*** 1212.76*** 170.34*** 394.85*** 573.47*** 491.07*** 850.75***
Fluency 101.93*** 0.03 128.48*** 5.48* 31.56*** 66.81*** 20.35*** 17.89*** 141.09*** 37.16***
Listener Group 0.59 1.13 0.15 2.77 1.11 0.37 2.19 3.99 1.40 0.04
Aphasia by LG 7.50** 4.36* 1.45 13.32*** 3.53 0.26 1.07 16.96*** 3.98 0.38
Fluency by LG 0.03 0.00 0.20 0.77 0.09 0.05 2.89 0.20 0.04 1.71
Results
The results of this study show a large impact of aphasia and fluency modification on
listener responses to a variety of questions pertaining to speech output, speaker attributes, and
listener feelings. Specifically, neurologically healthy speakers received more positive ratings
than speakers with aphasia, and aphasic speech samples that were modified to simulate greater
fluency were rated more favorably than speech samples that were unmodified (i.e. less fluent; see
Figure 2.2).
Figure 2.2. Mean Likert ratings of three audio sample conditions by undergraduate and graduate student listeners for all dependent variables. Higher ratings indicate more positive perceptions.
The results for the nine individual questions largely mirrored the overall average, with
some minor variations. Therefore, we begin by describing the results for the rating composite
and then describe differences among the questions. The questions are grouped by conceptual
category (i.e., speech output, speaker attributes, and listener feelings). When we refer to a 0" 1" 2" 3" 4" 5" 6" 7" Total"Average" Speech"
Intelligibility" Ease"of"Story"Telling" Intelligence"Speaker" CommunicaDve"Speaker" Competence"
Speaker"
Confidence" Friendliness"Speaker" Comfort"Listener" PaDence"Listener" Listener"Effort"
Li ke rt 'Ra *n g' Likert'Ra*ngs'by'Undergraduate'Listener'Group' 0" 1" 2" 3" 4" 5" 6" 7" Total"Average" Speech"
Intelligibility" Ease"of"Story"Telling" Intelligence"Speaker" CommunicaDve"Speaker" Competence"
Speaker"
Confidence" Friendliness"Speaker" Comfort"Listener" PaDence"Listener" Listener"Effort"
Li ke rt 'Ra *n g'
27
Fluency effect in the results or discussion, it always refers to the effect of Fluency nested within
the Aphasia condition.
Overall Ratings
The bar graphs in Figure 2.2 show mean Likert ratings across three conditions (i.e.,
aphasic speech, simulated fluency, and neurologically healthy) for each individual question and
their overall average. A separate graph is shown for undergraduate and graduate student listener
responses. High ratings indicate more positive perceptions. The highest listener ratings were
observed for neurologically healthy speakers, followed by simulated fluent speech of PWA,
while lowest ratings were found for unmodified samples of PWA. The difference between the
sample conditions was statistically robust, with highly significant effects for the Aphasia and
Fluency factors (p < .001). The main effect of Listener Group and the Fluency by Listener Group
interaction were not statistically significant, but the Aphasia by Listener Group interaction was
significant, F (1, 34) = 7.50, p = .01. Although both listener groups rated samples from PWA less
favorably than those from neurologically healthy individuals, differences between the group’s
ratings of PWA approached significance (p = .059), indicating that graduate students perceived
aphasic speech samples more favorably than did undergraduate student listeners (see Figure 2.3).
Speech Output Ratings
In this section we will focus on Likert Ratings of the speech output. The statements
related to speech output probed listener perceptions of speech intelligibility and ease of
storytelling. Figure 2.2 illustrates the average undergraduate and graduate listener responses for
these two statements. Table 4 reports the F statistic and significance for all main and interaction
Aphasia. A statistically significant main effect for Aphasia was found for both questions
related to the speech output. PWA were rated less favorably than neurologically healthy speakers
on both ease of storytelling, F (1, 34) = 1617.03, p < .001, and speech intelligibility, F (1, 34) =
734.51, p < .001.
Simulated fluency. Simulated fluency yielded more positive perceptions of the ease with
which PWA retold the story, as measured by the Fluency effect, F (1, 34) = 128.48, p < .001.
However, simulated fluency had no effect on listeners’ ratings of speech intelligibility, F (1, 34)
= .03, p = .86.
Listener group. The main effect for Listener Group was non-significant for both
statements about speech output. The Aphasia by Listener Group interaction was statistically
significant for speech intelligibility, F (1, 34) = 4.36, p = .04. Follow up analyses revealed that
graduate student listeners rated speech intelligibility of PWA higher than undergraduate listeners
(p = .048), whereas no difference was found between groups for non-aphasic samples. Figure 2.3
illustrates these differences.
Speaker Attribute Ratings
The Likert statements regarding speaker attributes dealt with listeners’ thoughts about the
intelligence, confidence, communicative competence, and friendliness of the speaker. The
average ratings that undergraduate and graduate student listeners assigned for these four
statements are represented in Figure 2.2. Table 2.4 reports all main and interaction effects related
to these four statements.
Aphasia. The main effect for Aphasia was statistically significant for all questions
referring to speaker attributes. Listeners perceived PWA as less intelligent, F (1, 34) = 330.51, p
29
friendly, F (1, 34) = 394.85, p < .001, than neurologically healthy speakers.
Simulated fluency. The effect of simulated fluency was also statistically significant for
all speaker attribute ratings. Simulated fluency led to more positive perceptions of speaker
intelligence, F (1, 34) = 5.48, p = .03, confidence, F (1, 34) = 66.81, p < .001, communicative
competence, F (1, 34) = 31.56, p < .001, and friendliness, F (1, 34) = 20.35, p < .001. There was
no interaction among speaker attribute ratings, indicating that the effect of simulated fluency on
improving listener perceptions of speaker attributes was independent of listener group.
Listener group. The Listener Group main effect was non-significant for all statements
about speaker attributes. Only ratings of speaker intelligence showed a statistically significant
Aphasia by Listener Group interaction effect, F (1, 34) = 13.32, p < .001. Follow up analyses
revealed significantly higher ratings of speaker intelligence from graduate compared with
undergraduate student listeners (p = .006). This difference is illustrated with a boxplot in Figure
2.3. No difference in speaker intelligence ratings was found between listener groups for
non-aphasic samples.
Listener Feeling Ratings
The perceptions that listeners had about their own affective response to the samples were
measured through statements about listeners’ feelings of comfort, patience, and effort. Responses
for these three statements can be visualized in Figure 2.2. Main and interaction effects associated
with these three statements are reported in Table 2.4.
Aphasia. The Aphasia main effect was statistically significant for all questions referring
to listener feelings. Listeners felt less comfortable, F (1, 34) = 573.47, p < .001, patient, F (1, 34)
= 491.07, p < .001, and felt like they exerted more effort, F (1, 34) = 850.75, p < .001, while
Simulated fluency. The effect of simulated fluency was statistically robust for all ratings
related to listener feelings. Listeners reported feeling significantly more comfortable, F (1, 34) =
17.89, p < .001, patient, F (1, 34) = 141.09, p < .001, and having to exert less effort, F (1, 34) =
37.16, p < .001. Fluency by Listener Group interactions were non-significant for all questions
pertaining to listener feelings. Thus, the effect of simulated fluency on listener feelings was
consistent between listener groups.
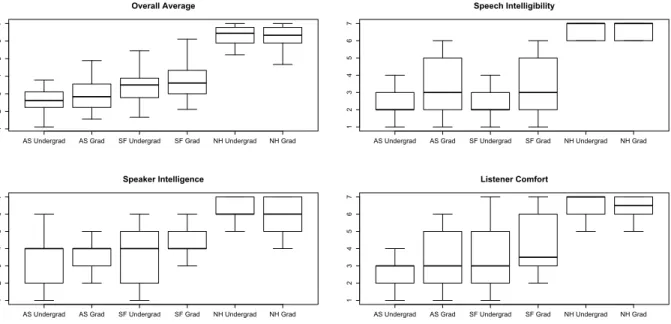
Figure 2.3. Aphasia by Listener Group interactions. This figure shows box-and-whisker plots of the average Likert ratings for all dependent variables with statistically significant Aphasia by Listener Group interaction effects. The plots illustrate the medians and interquartile range with whiskers extending to 1.5 times the interquartile range. AS = aphasic speech; SF = simulated fluency; NH = neurologically healthy. Undergrad = undergraduate student listener group; Grad = graduate student listener group.
Listener group. No significant Listener Group main effects were found for ratings of
listener feelings. Aphasia by Listener Group interactions were non-significant for all statements
except the one regarding listener comfort, F (1, 34) = 16.96, p = < .001. Consistent with all other
Aphasia by Listener Group interactions heretofore reported, follow up analyses revealed higher
ratings of comfort from graduate SLP students while listening to PWA (p < .001) but no AS Undergrad AS Grad SF Undergrad SF Grad NH Undergrad NH Grad
1 2 3 4 5 6 7 Overall Average
AS Undergrad AS Grad SF Undergrad SF Grad NH Undergrad NH Grad
1 2 3 4 5 6 7 Speech Intelligibility
AS Undergrad AS Grad SF Undergrad SF Grad NH Undergrad NH Grad
1 2 3 4 5 6 7 Speaker Intelligence
AS Undergrad AS Grad SF Undergrad SF Grad NH Undergrad NH Grad
31
difference between group ratings while listening to neurologically healthy speakers (see Figure
2.3).
Discussion
Findings from this study indicate that (a) samples from PWA yield less favorable listener
perceptions of the speech, speaker, and listener feelings than samples from neurologically
healthy individuals; (b) graduate student listeners perceive PWA as more intelligible, intelligent,
and comfortable to listen to than do undergraduate student listeners; and (c) simulated fluency of
aphasic speech positively impacts listener ratings of speech, speaker, and listener feelings. We
will discuss each of these findings separately. We will then suggest several clinical implications.
Negative Perceptions of PWA
The first purpose of the present study was to confirm previous reports that listeners
perceive PWA less favorably than neurologically healthy adults. Listeners in this study reported
less favorable perceptions of PWA across ratings about speech output, speaker attributes, and
listener feelings. Negative listener perceptions of PWA may contribute to decreased life
participation and ultimately lead to social isolation (Gillespie, Murphy, & Place, 2010; Shadden
& Agan, 2004). Professionals have been called upon to help communication partners of PWA
change their perceptions to increase opportunities for social interaction (e.g., Kagan, 1998;
Simmons-Mackie & Damico, 2007). The present data strongly support this appeal. They also
confirm fears often expressed by PWA: being perceived as having compromised intelligence and
competence (Kagan, 1998; Parr, 2001). Education and training can help change the public view
Graduate Student Perceptions of PWA
Graduate student listeners perceived the speech of PWA as more intelligible and PWA as
more intelligent and comfortable to listen to than did undergraduate student listeners. Graduate
students had been educated about aphasia and exposed to adults with communication disorders.
They likely showed less difficulty understanding PWA because they were equipped with
strategies derived from experience. Although exposure to PWA alone has shown minimal effects
on conversational partners’ ability to acknowledge and reveal competence (Kagan et al., 2001),
the graduate student listeners in this study had a combination of education and clinical
experience. It seems that education combined with experience leads listeners to recognize PWA
as intelligent individuals and be more comfortable listening to them. Another potential
explanation is that the graduate students were more caring and compassionate toward individuals
with disability because of personality characteristics that led them to pursue a profession in
healthcare in the first place.
Future studies about listener perceptions should account for factors related to listener sex
and age. The listeners represented a younger age range than might typically interact with PWA.
In addition, an unequal number of male and female listeners were represented. These
considerations may limit the generalization of these findings.
Improved Perceptions of PWA with Simulated Fluency
Our second purpose was to determine the effect of simulated fluency on listener
perceptions of PWA. Simulated fluency significantly improved perceptions of listener comfort,
listener patience, listener effort, ease of storytelling, speaker confidence, speaker communicative
competence, and speaker friendliness regardless of listener group. These findings are consistent
33
used similar methods to remove disfluencies (i.e., part-word repetitions, whole-word repetitions,
phrase repetitions, prolongations, and pauses) from the speech sample of a person who stuttered.
They found that listeners’ perceptual ratings were generally more favorable as fluency increased.
In the present study, aphasic speech samples were modified to create fluent versions of the
narrative while maintaining other common aphasic speech behaviors (e.g., sound distortions,
agrammatisms, paraphasias), showing that listener perceptions improved as a function of fluency
even when other disordered speech and language behaviors remained unchanged. These
improvements were found across a variety of questions related to speech output, speaker
attributes, and listener feelings.
Simulated fluency improved listeners’ perception of how easy it is for PWA to
communicate through a story retell task. This result could potentially be an artifact of differing
story lengths, as the modified samples were, on average, more than four minutes shorter than the
original samples. It may also be that listeners’ feelings (i.e., comfort, patience, and effort)
influence their perception of how easily the speaker tells the story. Thus, if listeners’ emotional
reaction to the speech improves, we might expect them to perceive the story as being told more
easily. In addition to the nine Likert statements, three open-ended questions were asked of
listeners, which may add insight into qualitative aspects of their ratings. Future exploration and
report will include qualitative analysis of these responses.
It is notable that no significant difference was found in listeners’ perception of
intelligibility for simulated fluent compared with aphasic speech samples. Because the simulated
fluent samples contained the same sound and word productions as the paired aphasic speech
sample we would not expect intelligibility to improve per se. The contrast between ease of
social variables such as listener perceptions. Increasing speech fluency may not improve how
well the speech of PWA is understood, though it may improve how PWA are perceived and
increase their opportunities for communicative interaction.
Speakers from simulated fluent samples were perceived as more confident, competent,
and friendly. This is particularly important given that listener acknowledgement of competence
when communicating with PWA is thought to have a significant impact on communicative
interactions (Kagan et al., 2001; Kagan, 1998). Perceptions of competence and intelligence also
highlight an area of direct concern for many people with aphasia during real-world interactions
(Kagan, 1998; Le Dorze et al., 2014; Parr, 2001). PWA who are viewed as more competent,
confident, and friendly will likely receive and take advantage of more opportunities for social
interaction. Of note is the wording of the question regarding competence, which was a rating of
competence as a speaker and not competence as a person. It is possible that listeners’ responses
to the question regarding competence might have been different had they been asked about the
person’s general competence rather than communicative competence.
Listeners felt more comfortable and patient, and they expended less effort listening to
simulated fluent speech compared with unmodified aphasic speech. This is consistent with
findings from Lasker and Beukelman (1999), who found that peer listeners (i.e., older adults over
age 60) reported a greater level of comfort with shorter message duration. Decreased comfort,
patience, and effort felt by the listener may cause them to limit their interaction with PWA. Due
to its impact on the self-reported affective response of listeners, increased fluency may yield
more favorable and more numerous social interactions.
We acknowledge that simulated fluency is not the same as fluent speech produced
35
possible outcomes of therapeutic targets—in this case, improved speech fluency—without
providing treatment. Because disfluent verbal output may be the result of a variety of aphasic
impairments, treatments that increase speech fluency might simultaneously impact other
impaired behaviors. On the other hand, treatments that target behaviors such as naming and
grammatical encoding might also affect speech fluency—both positively and negatively. One of
the strengths of this study is the robust effect of speech fluency on listener perceptions.
Clinical Implications
Findings from this study suggest several clinical applications related to (a) targeting
speech fluency and evaluating social treatment outcomes, (b) targeting conversation partners’
perceptions through direct training, and (c) using simulated fluency in treatment.
This study showed that speech fluency of PWA affects listener perceptions. Fluency is a
viable treatment target for PWA that has been manipulated successfully via script training and
choral speech (Fridriksson et al., 2012; Goldberg, Haley, & Jacks, 2012; Youmans et al., 2005;
Youmans, Youmans, & Hancock, 2011). Additional research from our laboratory has shown
promising results for increasing fluency in PWA using masked auditory feedback (Jacks &
Haley, 2015). In particular, we have found that some people with aphasia and/or apraxia of
speech increase their rate of speech and decrease disfluencies while listening to noise. While
these results have been achieved in a controlled laboratory setting and over a limited period of
time, the technique has the potential to achieve lasting gains in combination with behavioral
treatment. The outcomes of increased speech fluency extend beyond behavioral change alone
and include important social outcomes (i.e., improved listener perceptions) that should not be