1
Van Vliet, O., Caminada, K., Goudswaard, K. and Wang, J. (2020) Poverty reduction among older people through pensions: a comparative analysis. In: B. Greve (ed.)
Routledge International Handbook of Poverty. New York: Routledge, pp. 363-375.
Poverty reduction among older people through pensions:
a comparative analysis
1Olaf van Vliet1,2 Koen Caminada1,3 Kees Goudswaard1,3
Jinxian Wang 4
1 Leiden University, Department of Economics 2 Leiden University, Institute of Public Administration
3 Netspar, Network for the research on Savings, Pensions, Aging, and Retirement 4 Central South University China, Business School
Abstract
Given the ageing of the populations in many Western countries, older people constitute an important group in the analysis of poverty. In this chapter, we examine the poverty incidence among older people across LIS countries, relying on data from the Luxembourg Income Study. The data show that poverty rates are substantially reduced by redistribution via tax/benefit systems (mainly via pension benefits). Furthermore, the data show that old-age poverty rates and the antipoverty effect of pensions vary substantially across countries. Finally, in almost all countries, the poverty rates based on disposable income declined between 1985 and 2013. The reason for this reduction in old-age poverty is the increase of the poverty reducing effect of pension benefits). Interestingly, the trend in the poverty rates of the working age population differs from that of older people; in most countries of our sample, the poverty incidence increased for the working age population. However, it should be noted that in most Western countries, poverty rates for older people are still at a higher level than for the working age population.
1. Introduction
In the analysis of the developments in monetary poverty, older people constitute an important
group within populations. Older people who quit the labor market are, by definition,
vulnerable to financial poverty, and with the ageing of many Western societies this group is
1 This study is part of the research program Reform of Social Legislation of Leiden University. Financial support
2
growing rapidly. Interestingly in this respect, earlier research has shown that poverty rates
among older people have declined in many European countries over the past few decades
(Van Vliet et al., 2012). Poverty among older people is linked to several factors, such as
gender, social class, age and marital status (Kangas and Palme, 2000; Price, 2006). Yet an
important reason for the declining poverty rates over the past few decades is the expansion of
pension systems and hence the increased expenditures on pension benefits. A study by the
OECD (2008) concludes that the poverty reducing effect of transfers and taxes is the strongest
for older people, because of the impact of pensions. Across OECD countries, the poverty
reducing effect of the tax/benefit systems for people of retirement age is on average 1.5 times
as high as for people of working age. Based on a comparative analysis across countries and
over time, Been et al. (2017) concluded that high levels of public pension expenditures are
associated with lower levels of income inequality and poverty in old age. Recently, Jacques et
al. (2018) came to similar conclusions. Both studies examined the association between
at-risk-of-poverty rates based on EU-SILC data and social expenditures data from the OECD or
Eurostat with panel data regression analysis. An important advantage of this approach is that
in addition to the redistributive effect of pensions, the effects of various other socio-economic
developments, such as unemployment or aging of the population, can be taken into account
too.
In the current study, we do not estimate the redistributive effect of pensions on poverty among older people. Instead, we measure the poverty reduction that results from redistribution via tax/benefit-systems (i.e. through pensions). We focus on the actual income
redistribution for older people (65 and above), which is the difference between the market
income (before income taxes and social benefits) and the disposable income (after income
taxes and social benefits). For this analysis, we utilize a new dataset on fiscal redistribution
and relative income poverty rates that is based on data from LIS: Cross-National Data Center
in Luxembourg (Caminada and Wang, 2019).
The remainder of this chapter is organized as follows. First, we introduce and discuss
the key concepts used in our analysis, being poverty incidence and the poverty reducing effect
of social transfers and income taxes (i.e. lifting people out of poverty via tax/benefit systems).
Then, we show the variation in old-age poverty rates across LIS countries and over the period
1985-2016. Furthermore, we employ a decomposition analysis to examine the underlying
dynamics in redistribution by social transfers (mainly pensions) and income taxes.
3
2. Core concepts
Measuring poverty incidence
A good pension system protects people against poverty and smooths people’s income over their life-cycle. To achieve these goals countries organize their pension system in different
ways. Considerable effort has been made to compare pension systems across countries and to
identify strengths and weaknesses of different systems. To be able to evaluate adequacy we need to know how much resources retirees need. A variety of standards can be chosen against
which to judge adequacy (Knoef et al, 2016). A widely accepted standard in the literature is
having a retirement income of 70 percent of previous earnings (Haveman et al, 2007).
Another approach is to set a social standard for adequacy. In such an approach, retirement
income could be considered adequate when it is equal to or greater than the poverty threshold. There are three common ways of setting the poverty line: an absolute standard, a
relative standard, and a subjective standard (see also Chapters 2-4). The U.S. poverty
threshold is based on an absolute poverty standard, which remains fixed over time in real
terms. The EU agreed upon a relative poverty line that is set as a fixed percentage of the
median income in each country, which may change over time if median income changes in
real terms. The subjective poverty line is based on respondents’ answers to questions
regarding what they consider an adequate standard of living. Following international
standards, we use the relative rather than the absolute or subjective approach in measuring
income poverty. This means that we define those households that have an equivalent
disposable income below a certain threshold representing the level of well-being of the
population in a specific country as being poor. In a number of comparative studies, the
poverty threshold has been set at 50 percent of median equivalent disposable income.
However, we employ the EU-agreed definition of poverty. The official EU indicator for social
cohesion is the at-risk-of-poverty rate after social transfers. This rate is defined as the share of
persons with an equivalized disposable income below the risk-of-poverty threshold, which is
set at 60 percent of the national median equivalized disposable income.
Caminada et al (2019) performed a sensitivity analysis for all waves of the 49 LIS
countries 1967-2016 when different poverty lines are applied. They found that all poverty
lines (PL60, PL50, P40) follow more or less the same pattern. The country ranking changes
only slightly when a threshold of 40 percent instead of 60 percent is applied (although there
are some exceptions). As a result, in most cases empirical findings will hardly be affected by
4
It should be noted that there have been controversial arguments regarding the issues in
the measurement of income poverty. These arguments have their own merits and
shortcomings, and there has been little professional consensus among researchers with regard
to the theoretical superiority of a particular way of measuring poverty. The aim of this chapter
is not to review definitional issues that arise in assessing the extent of, and change in, income
inequality and poverty across countries. We simply refer to a vast literature on the sensitivity
of measured results to the choice of income definitions, inequality and poverty indices,
appropriate equivalence scales, and other elements that may affect results in comparative
research; see Caminada et al (2019a) and al papers cited therein.
Unit of analysis
The unit of analysis is an important issue in poverty and income distribution studies. It is
evident that the ultimate source of concern is the welfare of the individual. However, an
individual is often not the appropriate unit of analysis. For example, children and spouses
working at home do not have recorded income, but may nevertheless be enjoying a high
standard of living as a result of income sharing with parents/spouses. Traditionally, studies have
used household income per capita to adjust total incomes according to the number of persons in
the household. In recent decades, equivalence scales have been widely used in the literature on
income distribution (Figini, 1998). Equivalence scale elasticity for the LIS database is set
around 0.5. This implies that where the income of a household of one person is 100, a
household of two persons must have an income of 140 to have equivalent incomes.
Alternatively, a one-person household must have 70 percent of the total income of a two-person
household to have equivalent income. In our comparative analysis we use this equivalence scale
of LIS. Caminada et al. (2019c) show that the results of such an analysis are hardly influenced
by the equivalence method used.2
Measuring the poverty reducing effects of social transfers and income taxes
Usually, the impact of social programs on poverty and income inequality is calculated in line
with the work of Musgrave et al. (1974), i.e. statutory or budget incidence analysis. A
standard analysis of the redistributive effect of income taxes and social transfers is to compare
pre-tax-transfer poverty or income inequality and post-tax-transfer poverty or income
2 Caminada et al. (2019c) applied three widely used equivalence scales methods: from LIS (this study), OECD
5
inequality (OECD 2008: 98). A well-known critique of this approach is that pre-transfer
poverty is compared to post-transfer poverty keeping all other things constant, thus
disregarding any possible behavioral changes that the situation of absence of social transfers
would involve. In particular, labor supply responses could be expected. However, in our
analysis of poverty and the poverty reducing effects of tax/benefit systems among older
people, labor supply effects are obviously less relevant, as older people have a very low labor
supply.
In order to assess the partial effects of pensions and income taxes on the overall
poverty reducing effect of tax/benefit systems, we apply a sequential accounting
decomposition technique followed by Jesuit and Mahler (2010 and 2017) and Kammer et al.
(2012). This enables us to calculate poverty rates without a certain type of social transfer or
income tax. Consequently, we can determine the effective antipoverty impact of different
income sources. Likewise, the poverty reducing effects of all income components on poverty
within the trajectory between market income and disposable income can be calculated using
this approach.
Data
For this chapter we use data from the Luxembourg Income Study. The LIS Cross-National
Data Center in Luxembourg provides the largest available income database of harmonized
microdata collected from 49 countries in Europe, North America, Latin America, Africa,
Asia, and Australasia. Harmonized into a common framework, LIS datasets contain
household- and person-level data on labor income, capital income, social security and private
transfers, income taxes and social contributions, demography, employment, and expenditures
(LIS, 2019). The LIS database allows scholars to access the microdata, so that income
inequality measures and fiscal redistribution (and the partial effect per social program) can be
derived consistently from the underlying data at the individual and household levels. LIS
microdata seem to be the best available data for describing how poverty and the redistributive
effects of taxes and transfers vary across countries (Nolan & Marx, 2009; Smeeding & Latner,
2015). However, country-comparative and trend analyses of income distribution based on LIS
gross/net datasets should be done with caution (Gornick et al., 2013; Nieuwenhuis et al.,
2017). LIS provides gross income data for most countries and years while providing income
data that are net of (income) taxes in others. Of the 339 LIS datasets available at the time of
writing, 214 are classified as gross, 103 as net and 22 as ‘mixed’; see Caminada & Wang
6
effects of pensions and income taxes and social contributions, this analysis only considers
LIS-countries for which full tax-benefit information is available (classified by LIS as ‘gross’).
In the empirical literature, the selection of countries and data-years varies due to the
consideration of data quality. From nearly 300 variables in the dataset, we select those related
to household income (all kinds of income sources), total number of persons in a household
and household weight (in order to correct sample bias or non-sampling errors) to measure
poverty and the redistributive effect across countries. In line with LIS conventions and the
work by Mahler & Jesuit (2017) and Caminada et al. (2017 and 2019b), we have included
households which report zero market income (i.e., all of their income is derived from the state)
but have excluded households that report zero disposable income.
How to deal with pensions?
An important choice in this analysis is whether pensions should be earmarked as market
income or as transfers and therefore pension contributions as taxes. This choice is of vital
importance for the results. Most studies conclude that the redistributive effect of transfers is
much more important than the redistributive effect of taxes. But Guillaud et al. (2017) show
that if pensions are categorized as market income rather than transfers, tax redistribution
dominates transfer redistribution in most countries. Countries differ to a large extent in public
versus private provision of their pensions (OECD, 2008: 120). Public pension plans are
generally seen as part of the safety net, generating large antipoverty effects. Occupational and
private pensions, on the other hand, generally aim to redistribute income inter-temporally over
the life cycle. These pensions are not redistributive programs per se, although they too have a
significant effect on redistribution when pre-tax-transfer inequality and post-tax-transfer
inequality are measured at one moment in time, particularly among older people. The standard
approach treats contributions to government pensions as a tax that finances the retirement
pensions paid out in the same year, while contributions to private pensions are effectively
treated as a form of private consumption. This may affect international comparisons of
redistribution effects of social transfers and taxes. We deal with this bias rather pragmatically
by following the LIS Household Income Variables List: occupational and private pensions are
earmarked and treated as social transfers. Jesuit and Mahler (2017) also consider the pension
system as whole, because the distinction between public and private pensions is somewhat
artificial.3 For a substantial number of LIS countries it is impossible to disaggregate income
3 For a more extensive discussion about the distinction between public and private pensions in empirical
7
from public and private schemes. The implication hereof is that the measured redistribution
through pensions cannot be fully considered as interpersonal redistribution. Other transfers
and benefits, such as housing transfers, for instance, are also included in the decomposition
analysis; they are included in ‘other transfers’.
3. Empirical analysis
Decomposition analysis
Because the data for a number of countries is not detailed enough for performing a
decomposition analysis, the decomposition analysis is based on 25 LIS countries. Table 29.1
shows poverty rates and the antipoverty effect of social transfers and income taxes and social
contributions around 2013. The numbers presented are unweighted averages of the values of
25 LIS countries, see list of countries in Table 29.1. The table indicates that the poverty rate
based on market income is the lowest among the working-age population and the highest
among older people. Among the working-age population, 26 percent of the population has a
market income that lies below the risk-of-poverty threshold of 60 percent of the national
median income. Among older people, 76 percent of the population has a market income that is
lower than the poverty threshold. This difference in poverty rates reflects the fact that many
older people are retired from paid work. The poverty rate based on disposable income is also
lower for the working-age population than for older people, but the difference is much
smaller; 17 percent for the working-age population versus 21 percent for older people. The
reason why this difference in poverty rates is smaller is that the tax/benefit system has lifted
many more people out of poverty in the case of older people than in the case of the
working-age population. In the case of older people, 55 percent of the population has been lifted out of
poverty via social transfers and income taxes. For the working-age population, income taxes
and social benefits have lifted 9 percent of that population out of poverty. In contrast, for
children the difference between the poverty rates based on market and disposable income
amounts 8 percent and for the total population this is 16 percent.
The lower part of the table displays the results of the decomposition analysis. The
overall poverty reducing effect of income taxes and social transfers presented in the upper
part of the table is decomposed in order to determine the effective antipoverty impact of
different income sources. The first income category that we use, consists of old-age, disability
8
in the LIS-data, but for the group of older people we can reasonably assume that this category
consists mainly of old-age transfers, being pensions. The results of the decomposition analysis
show that in the case of the older people, the overall poverty reducing effect of tax/benefits
systems can be almost completely attributed to old-age transfers. In other words, pension
schemes are responsible for lifting roughly 55 per cent of the older population out of poverty.4 Since we are mainly interested in the older population in this chapter, we do not go into detail
about the social transfers which are mainly aimed at the working age population, such as
family, unemployment and education transfers. Instead, we group them together into ‘other
transfers’ as the second income source. Indeed, the table shows that for the older population
only two percentage points of the poverty reduction via tax/benefits-systems can be attributed
to these other transfers. This equals 4 percent of the overall poverty reduction via tax/benefits
systems. Third, we present the distributional effect of income taxes and social security
contributions. Since income taxes and social contributions reduce the disposable income, they
may draw incomes below the poverty threshold, which is indicated by the negative sign. So
for older people, income taxes and social security contributions contribute to an increase of
the poverty rate based on disposable income with three percentage points on (unweighted)
average.
4 More precisely: 55.7 percent of the older population is lifted out of poverty by pensions. Taking into account
9
Table 29.1 Poverty (alleviation) and poverty reducing effects of social programs in 25 LIS countries around 2013
Total population
Working age
population Children Older people
(a) Poverty market income
35.0 25.5 30.4 76.3
(b) Poverty disposable income
19.1 16.8 22.7 21.4
Poverty reduction (a-b)
15.9 8.7 7.7 54.9
share share share share
Old-age/disability/survivor transfers
13.1 82% 6.1 70% 2.3 30% 55.7 101%
Other transfers
5.9 37% 5.3 61% 8.9 116% 2.2 4%
Income taxes and social security contributions
-3.1 -19% -2.7 -31% -3.5 -45% -3.1 -6%
Residual
0.0 0% 0.0 0% -0.1 -1% 0.1 0%
Notes:
- When we take the mean of the decomposition results across countries, the sum of all partial antipoverty effects amounts to (a little) over 100 percent due to missing observations. We rescaled the antipoverty effects of each social program by applying an adjustment factor, which is defined as the overall poverty reduction (=100%) divided by sum of all partial antipoverty effects of all programs (over 100%), in order to correct for an over-estimated effect.
- LIS 25: Australia, Austria, Brazil, Czech Republic, Denmark, Estonia, Finland, Germany, Greece, Guatemala, Iceland, Ireland, Israel, Luxembourg, the Netherlands, Norway, Panama, Peru, Slovakia, South Africa, Spain, Switzerland, the United Kingdom and the United States.
Source: Database Caminada & Wang (2019) based on LIS, and own calculations.
Cross-country variation
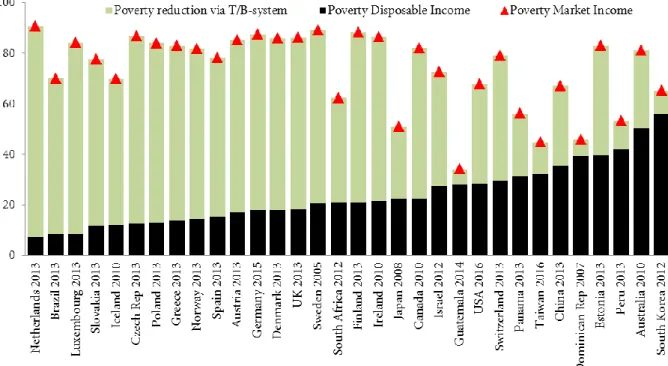
Figure 29.1 shows the cross-country variation in poverty rates and in poverty reduction by
tax/benefits systems among older people for 32 countries around 2012.5 The figure indicates that the poverty rates based on market income vary substantially across the countries. The
highest poverty rate can be found in the Netherlands where 91 percent of the older people fall
below the poverty threshold, followed by Sweden (89 percent), Finland (88 percent),
Germany (87 percent) and the Czech Republic (87 percent). The countries with the lowest
poverty based on market income are Guatemala (34 percent), Taiwan (45 percent), the
Dominican Republic (46 percent) and Peru (53 percent). Subsequently, the figure also shows
substantial variation in poverty rates based on disposable income. The countries with the
highest poverty rates are South Korea (56 percent), Australia (50 percent) and Peru (42
percent) whereas the countries with the lowest poverty rates are the Netherlands (7 percent),
Brazil (8 percent) and Luxembourg (8 percent).
Interestingly, the countries with the highest poverty rates based on market income are
not the countries with the highest poverty rates on disposable income. The reason for this is
5 The seven additional countries (compared to the 25 countries included in Table 29.1) are: Sweden, Japan,
10
that there is substantial variation in the magnitude of poverty reduction (i.e. lifting older
people out of poverty) via tax/benefits systems across countries, which is graphically
indicated by the grey bars in the figure. The most notable example is the Netherlands, as this
is the country with the highest poverty rate based on market income, the lowest poverty rate
based on disposable income and the largest poverty alleviation. Here, 84 percent of the older
people are lifted above the poverty line via social transfers. Also in Luxembourg, Czech
Republic, Poland and Germany, the share of older people with a disposable income below the
poverty threshold is more than 70 percentage points lower as a result of the
tax/benefit-systems. The countries with the smallest antipoverty impact of social transfers are Guatemala,
the Dominican Republic and South Korea. In these three countries, the difference between
poverty rates before and after redistribution is smaller than 10 percentage points. It should be
noted that these countries are among those with the lowest poverty rates before redistribution.
Yet, with the small magnitude of redistribution by income taxes and benefits, these countries
end up in the group of countries with the higher poverty rates based on disposable income.
Figure 29.1 Relative poverty rates (PL 60) among older people in LIS countries around 2012.
11 Developments over time
Subsequently, we examine the developments in old-age poverty and poverty reduction
through pensions between 1985 and 2013 in Table 29.2a. In Table 29.2b, we present the same
concepts but for the working-age population. The selection of countries for which at least
three waves are available (around 1985, around 1997 and around 2013) limits the analysis to a
sample of 14 LIS countries. Between 1985 and 2013, poverty rates among older people based
on market income declined in only four countries, namely Denmark, Sweden, Switzerland and
the U.S. In all other countries, the poverty rates among older people increased, with modest
increases in the majority of the countries. In contrast, the poverty rates based on disposable
income declined in almost all countries between 1985 and 2013. They only increased in
Australia and Taiwan. A remarkable trend can be observed in Sweden, where the poverty rate
declined from 21 to 8 percent and then increased to 21 percent again, which is probably
related to the Swedish pension reform that was adopted in 1998.6
The antipoverty effect of tax/benefit systems (i.e. pensions) increased in all countries
but the U.S., where the antipoverty effect slightly decreased from 40 to 39 percent. In a
number of countries the poverty rates based on disposable income sharply declined as a result
of strong increases in redistribution. For example, in Denmark the poverty rate dropped from
56 to 18 percent and the reduction of poverty via the tax/benefit system increased from 31 to
68 percent. Also Norway witnessed substantial declines in poverty rates as a result of an
increased antipoverty effect of social transfers. In other countries, the increased antipoverty
effect of tax/benefit systems was used to offset (to some extent) the increased poverty rates
based on market income. In Ireland for instance, the poverty rate based on market income rose
from 76 to 86 percent over the period 1985-2013, whereas the poverty rate based on
disposable income declined from 25 to 22 percent. In Taiwan, the increase in poverty based
on market income from 26 to 45 percent was translated into a relatively modest increase in
poverty based on disposable income from 24 to 32 as a result of the increased antipoverty
effect of the tax/benefit system.
Interestingly, the trends in poverty rates and the share of older people lifted out of
poverty seem to follow a different path from the trends in poverty and antipoverty effects of
tax/benefit systems among the working age population. The most notable difference between
the two groups is that the old-age poverty rate based on disposable income declined in most
countries whereas for the working age population it increased in most countries. The averages
6 Sweden transformed its public pension system to a notional contribution plan; that is a
12
of the country groups display similar trends. A remarkable case in this respect is the
Netherlands. As a result of increased redistribution, the old-age poverty rate based on
disposable income declined between 1983 and 2013, whereas in the working-age population
the poverty rate increased as a result of smaller antipoverty effects of the tax/benefit system.
Interestingly, in 2013 the poverty rate based on disposable income is even lower among older
people (7 percent) than among the working-age population (13 percent). Yet it should be
noted that the Netherlands is an exception in this respect, as in the other countries with such
opposite trends between older people and the working-age population the poverty rate
remains higher among older people. Finally, Norway is an interesting case. Here the opposite
trends of old-age and working-age poverty after transfers converged to a similar poverty rate
of 14 percent in 2013. However, the underlying dynamics differ significantly. In the case of
older people, there was a relatively modest increase in the poverty rate based on market
income and a substantial increase in the antipoverty effect of the tax/benefit system. In
contrast, in the case of the working-age population there was a relatively large increase in the
poverty rate based on market income and a relatively small increase in the share of people
lifted out of poverty via the tax/benefit system.
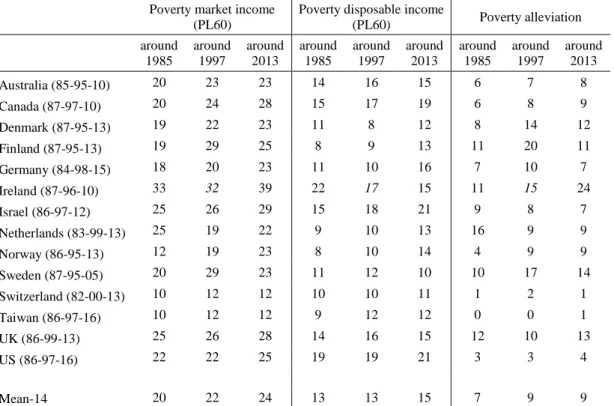
Table 29.2a Poverty rates and poverty alleviation, older people, 14 LIS countries, 1985 - 2013
Poverty market income (PL60)
Poverty disposable
income (PL60) Poverty alleviation
around 1985 around 1997 around 2013 around 1985 around 1997 around 2013 around 1985 around 1997 around 2013
Australia (85-95-10) 78 79 81 49 44 50 30 35 31
Canada (87-97-10) 77 81 82 25 17 22 52 63 60
Denmark (87-95-13) 88 89 86 56 35 18 31 54 68
Finland (87-95-13) 86 90 88 32 18 21 54 72 67
Germany (84-98-15) 87 89 87 23 16 18 65 73 70
Ireland (87-96-10) 76 81 86 25 42 22 50 40 65
Israel (86-97-12) 73 76 73 32 35 27 41 40 45
Netherlands (83-99-13) 90 94 91 14 15 7 77 79 84
Norway (86-95-13) 79 86 82 39 29 14 40 57 67
Sweden (87-95-05) 92 93 89 21 8 21 71 86 69
Switzerland (82-00-13) 83 83 79 37 28 29 46 55 50
Taiwan (86-97-16) 26 44 45 24 33 32 2 11 13
UK (86-99-13) 86 87 86 24 34 18 62 53 68
US (86-97-16) 70 74 68 31 30 28 40 44 39
13
Table 29.2b Poverty rates and poverty alleviation, working age population, 1985 - 2013
Poverty market income (PL60)
Poverty disposable income
(PL60) Poverty alleviation
around 1985 around 1997 around 2013 around 1985 around 1997 around 2013 around 1985 around 1997 around 2013
Australia (85-95-10) 20 23 23 14 16 15 6 7 8
Canada (87-97-10) 20 24 28 15 17 19 6 8 9
Denmark (87-95-13) 19 22 23 11 8 12 8 14 12
Finland (87-95-13) 19 29 25 8 9 13 11 20 11
Germany (84-98-15) 18 20 23 11 10 16 7 10 7
Ireland (87-96-10) 33 32 39 22 17 15 11 15 24
Israel (86-97-12) 25 26 29 15 18 21 9 8 7
Netherlands (83-99-13) 25 19 22 9 10 13 16 9 9
Norway (86-95-13) 12 19 23 8 10 14 4 9 9
Sweden (87-95-05) 20 29 23 11 12 10 10 17 14
Switzerland (82-00-13) 10 12 12 10 10 11 1 2 1
Taiwan (86-97-16) 10 12 12 9 12 12 0 0 1
UK (86-99-13) 25 26 28 14 16 15 12 10 13
US (86-97-16) 22 22 25 19 19 21 3 3 4
Mean-14 20 22 24 13 13 15 7 9 9
Notes: Ireland 1996: income data net of income taxes (marked italic).Sweden is included although latest data year available is 2005.
Source: Database Caminada & Wang (2019) based on LIS, and own calculations.
Analysis of the results: the role of pensions
In response to the pressure stemming from the ageing of populations, pension reforms have
been implemented in many Western countries over past years. More structural long-term
reforms of the pension systems entail changes from the defined benefit to the defined
contribution system (Barr & Diamond, 2009). In more recent years, many countries have
opted for changes in the parameters of their pension systems. In particular, the retirement age
has been changed in a number of countries.7 Many countries have implemented automatic
links between pension benefits and life expectancy. Other changes that have been
implemented entail increases in employee contributions, changes in the tax incentives related
to pensions, measures to increase the coverage of pensions, for instance by using
auto-enrollment, or changes of the indexation rules (OECD 2017; Bridgen, 2018). Obviously, these
institutional changes will affect the level of pension benefits and that might explain the
varying incidence of old-age poverty and the varying extent of the share of older people lifted
out of poverty via pensions as presented above.
7 Interestingly, in the Czech Republic and Poland the retirement age was reduced, which will directly lead to
14
First of all, the level at which the first layer of (public) pension benefits are set will be
an important factor that might explain the variation in old-age poverty. In OECD countries
this first layer consists of basic pensions, minimum pensions or social assistance; in some
countries a combination of these programs can be seen. OECD data allow us to roughly
compare, for a number of countries, old-age poverty with the benefit levels of these safety net
schemes. The OECD (2017) provides these public benefit levels as a percentage of average
economy-wide earnings (see Table 29.3, left panel). Several countries combine relatively high
minimum level pension benefits with relatively high poverty alleviation and relatively low
poverty rates: Luxembourg, Netherlands, Denmark, Norway, Sweden, Finland, Slovakia and
Austria. The US, Japan and South Korea combine relatively low minimum benefit levels with
relatively low poverty alleviation and relatively high poverty rates. Germany combines low
minimum benefits with low poverty and high poverty alleviation. This implies that the second
(or third) layer of the pension system is relatively important in this country. Australia on the
other hand, combines relatively high minimum benefits with relatively low poverty
alleviation. For some other countries, including Switzerland, the UK, Israel and Iceland we do
not find a clear relationship between the level of minimum benefits and poverty rates and
poverty alleviation.
Another comparison can be made between redistribution and old-age poverty on the
one hand and replacement rates of pension benefits on the other hand. The replacement rate is
defined as pension entitlement as a percentage of gross pre-retirement earnings. Replacement
rates can be calculated in gross or in net terms. For the disposable income of older people, net
replacement rates will matter more than gross rates. The OECD has calculated net
replacement rates from public and private (mandatory) pension schemes for different levels of
earnings: low, average and high (see Table 29.3, right panel).8 It appears that most of the countries that show low old-age poverty rates and high poverty alleviation have relatively
high replacement rates for low income earners. In Denmark, the Netherlands, Luxembourg,
Austria, Czech Republic, Denmark, Slovak Republic and Brazil these low-income earner
replacement rates lie above 85 percent. Australia and Israel remarkably combine relatively
high replacement rates for low-income earners with relatively high old-age poverty rates and
relatively small poverty alleviation. The targeting of pension benefits does not seem to be
optimal in these countries. On the other hand, some countries, including Germany, Sweden,
8 It should be mentioned that these calculations are made for ‘standard’ workers, on the basis of various
15
Norway and the UK combine relatively low replacement rates for low-income earners with
relatively low poverty and relatively large poverty alleviation. For these countries,
replacement rates for low income earners are not a good indicator of the effectiveness of
pensions to reduce poverty.9 A few countries, including The Netherlands, Luxembourg, Austria, Denmark and Slovak Republic also have high replacement rates for average- and
high-income earners. These countries have relatively universal and generous pension
schemes, that also succeed in keeping most of the older people out of poverty.
9 For a more general discussion about the limitations of the use of replacement rates of pension benefits, see
16
Table 29.3 Minimum pension benefits and net pension replacement rates
Minimum pension benefits as a % of average earnings in a country, 2016
Net pension replacement rates for low, average and high earners
(% of individual earnings)
basic minimum social
assistance low average high
Australia 27.6 - - 95.0 42.6 45.4
Austria - - 27.8 92.2 91.8 90.9
Brazil 92.4 76.4 76.4
Canada 13.5 - 19.2 62.2 53.4 38.5
China 104.4 83.0 77.0
Czech Republic 8.9 11.7 12.4 88.3 60.0 48.7
Denmark 17.6 - 18.6 110.3 80.2 76.2
Estonia 14.7 - 14.7 73.7 57.4 51.1
Finland 17.4 - 21.0 66.9 65.0 65.1
Germany - - 20.1 54.7 50.5 49.8
Greece 23.0 - - 60.7 53.7 54.1
Iceland 5.7 - 17.9 85.5 75.7 77.8
Ireland 34.1 - 32.4 70.0 42.3 32.4
Israel 12.9 - 23.5 100.4 75.1 54.9
Japan 15.3 - 19.0
Luxembourg 9.8 36.7 28.8 98.3 88.4 83.6
Netherlands 26.3 - - 105.1 100.6 100.2
Norway 32.5 - - 64.8 48.8 41.3
Poland - 22.2 15.2 37.2 38.6 37.9
South Africa 32.1 17.1 11.9
South Korea - - 5.5
Slovak Republic - 40.7 19.8 85.0 83.8 83.5
Spain - 33.3 19.3 79.3 81.8 81.7
Sweden 22.3 - - 62.4 54.9 67.6
Switzerland - 16.5 22.6 57.4 44.9 31.5
UK 22.2 - - 52.1 29.0 20.7
US - - 16.7 59.9 49.1 42.4
Note: Dashes indicate that a country does not have such a pension scheme; empty cells indicate that information is not available.
Source: OECD (2017), pp. 89 and 109.
4. Conclusion
Given the ageing of the populations in many Western countries, older people constitute an
important group in the analysis of poverty. In this chapter, we examined the poverty incidence
among older people across LIS countries, relying on data from the Luxembourg Income
Study. The data show that poverty rates are substantially reduced via tax/benefit systems
(mainly by pensions); on average 56 percent of older people are lifted out of poverty. These
17
al., 2017; Jacques et al. 2018). Furthermore, the data show that old-age poverty rates and the
redistribution through pensions vary substantially across countries. A closer look at minimum
pension benefits and at pension replacement rates for different earnings levels provides
insight into the varying incidence of old-age poverty and the varying magnitude of
redistribution through pensions.
Finally, we examined the developments in the old-age poverty incidence over time. In
almost all countries, the poverty rates based on disposable income declined substantially
between 1985 and 2013. The reason for this substantial reduction in old-age poverty is the
increase of the share of older people lifted out of poverty via tax/benefit systems, mainly
through pensions. Interestingly, the trend in the poverty rates of the working-age population
differs from that of older people; in most countries of our sample, the poverty incidence
increased for the working-age population. However, it should be noted that in most Western
countries, poverty rates for older people are still at a higher level than for the working-age
population.
18
References
Barr, N., & Diamond, P. (2009). Reforming pensions: Principles, analytical errors, and policy
directions. International Social Security Review, 62(2), 5–29.
Been, J., Caminada, K., Goudswaard, K., & Van Vliet, O. (2017) Public/private pension mix,
income inequality, and poverty among the Elderly in Europe: an empirical analysis using
new and revised OECD data, Social Policy & Administration 51(7): 1079-1100.
Bridgen, P. (2018) The retrenchment of public pension provision in the liberal world of
welfare during the age of austerity – and its unexpected reversal, 1980 – 2017, Social Policy & Administration, doi.org/10.1111/spol.12444.
Caminada, K., Wang, J., Goudswaard, K., & Wang, C. (2017) Income inequality and fiscal
redistribution in 47 LIS-countries (1967-2014), LIS Working Paper Series no. 724.
Caminada, K., & Wang, J. (2019) Leiden LIS Budget Incidence Fiscal Redistribution Dataset
on Relative Income Poverty Rates for 49 LIS countries, 1967 – 2016. Leiden University.
Caminada, K., Goudswaard, K., Wang, C., & Wang, J. (2018) Income inequality and fiscal
redistribution in 31 countries after the crisis, Comparative Economic Studies
doi.org/10.1057/s41294-018-0079-z.
Caminada. K., Wang, J., Goudswaard, K. & Wang, C. (2019), Relative income poverty rates
and poverty alleviation via tax/benefit systems in 49 LIS-countries, 1967-2016, LIS Working Paper Series no. 761.
Caminada, K., Goudswaard, K., Wang, C. & Wang, J. (2019), Has the redistributive effect of
social transfers and taxes changed over time across countries?, International Social Security Review 72 (1): 3-31. http://dx.doi.org/10.1111/issr.12193.
Chybalski, F., & Marcinkiewicz, E. (2016) The replacement rate: An imperfect indicator of
pension adequacy in cross-country analyses, Social Indicators Research 126(1): 99–117. Figini, P. (1998) Inequality Measures, Equivalence Scales and Adjustment for Household
Size and Composition, LIS Working Paper Series no. 185.
Gornick, J.C., Ragnarsdóttir, B.H., & Kostecki, S. (2013) LIS, Cross-National Data Center in
Luxembourg – An Overview, LIS Technical Working Paper Series no. 5.
Guillaud, E., Olckers, M., & Zemmour, M. (2017) Four Levers of Redistribution: The Impact
19
Haveman, R., Holden, K., Romanov, A. & Wolfe, B. (2007), Assessing the maintenance of
savings sufficiency over the first decade of retirement, International Tax and Public Finance 14 (4), 481–502.
Jacques, P., Leroux, M., & Stevanovic, D., (2018) Poverty among the elderly: The role of
public pension systems. Working Paper 18-07. Chaire de recherché Industrielle Alliance
sur les enjeux économiques des changements démographiques.
Jesuit, D.K., & Mahler, V.A., (2010) Comparing Government Redistribution across
Countries: The Problem of Second-order Effects, LIS Working Paper Series no. 546.
Jesuit, D.K., & Mahler, V.A., (2017) Fiscal redistribution in comparative perspective: Recent
evidence from the Luxembourg Income Study (LIS) datacenter, LIS Working Paper Series no. 717.
Kammer, A., Niehues, J., & Peichl, A. (2012) Welfare regimes and welfare state outcomes in
Europe, Journal of European Social Policy 22(5): 455–471.
Kangas, O., & Palme, J. (2000) Does social policy matter? Poverty cycles in OECD countries.
International Journal of Health Services 30(2): 335-352.
LIS Cross-National Data Center in Luxembourg (2019), Luxembourg Income Study (LIS) Database, https://www.lisdatacenter.org/, (accessed between December 2017 and December 2018, through the secured remote-execution system from the LIS database, for
49 countries). Luxembourg: LIS.
Musgrave, R.A., Case, K.E., & Leonard, H.B. (1974) The Distribution of Fiscal Burdens and
Benefits, Public Finance Quarterly 2(July): 259-311.
Nieuwenhuis, R., Munzi, T. & Gornick, J.C. (2017) Comparative research with net and gross
income data: An evaluation of two netting down procedures for the LIS Database, Review of Income and Wealth 63(3): 564-573.
Nolan, B. & Marx, I. (2009) Economic Inequality, Poverty, and Social Exclusion in: W.
Salverda, B. Nolan & T.M. Smeeding (eds.), The Oxford Handbook of Economic Inequality, New York: Oxford University Press: 315-341.
OECD (2008) Growing unequal? Income distribution and Poverty in OECD Countries, Paris.
OECD (2017) Pensions at a Glance 2017: OECD and G20 Indicators. Paris.
Price, D. (2006) The poverty of older people in the UK. Journal of Social Work Practice
20
Smeeding T & Latner (2015), PovcalNet, WDI and ‘All the Ginis’: a critical review, The
Journal of Economic Inequality, 13 (4): 603–628.
Van Vliet, O., J. Been, K. Caminada and K. Goudswaard (2012) Pension reform and income
inequality among the elderly in 15 European countries, International Journal of Social Welfare 21, 4(s1): S8-S21.