NMR STUDIES OF PROTEIN HYDRATION AND PROTEIN-LIGAND INTERACTIONS
Yuan Chong
A dissertation submitted to the faculty of the University of North Carolina at Chapel Hill in partial fulfillment of the requirements for the degree of Doctor of Philosophy in the Department
of Physics and Astronomy.
Chapel Hill 2017
Approved by: Yue Wu Sean Washburn Laurie E. McNeil
©2017 Yuan Chong
ABSTRACT
YUAN CHONG: NMR Studies of Protein Hydration and Protein-Ligand Interactions (Under the direction of Yue Wu)
Water on the surface of a protein is called hydration water. Hydration water is known to play a crucial role in a variety of biological processes including protein folding, enzymatic activation, and drug binding. Although the significance of hydration water has been recognized, the underlying mechanism remains far from being understood. This dissertation employs a unique in-situ nuclear magnetic resonance (NMR) technique to study the mechanism of protein hydration and the role of hydration in alcohol-protein interactions. Water isotherms in proteins are measured at different temperatures via the in-situ NMR technique. Water is found to interact differently with hydrophilic and hydrophobic groups on the protein. Water adsorption on
hydrophilic groups is hardly affected by the temperature, while water adsorption on hydrophobic groups strongly depends on the temperature around 10C, below which the adsorption is
series of controlled hydration levels. The free energy, enthalpy, and entropy of alcohol binding are also determined. Two distinct types of alcohol binding are identified. On the one hand, alcohols can directly bind to a few specific sites on the protein. This type of binding is
independent of temperature and can be facilitated by hydration. On the other hand, alcohols can bind to many nonspecific sites on the protein. In dry proteins, this type of binding only occurs above a threshold of alcohol vapor pressure. Such a threshold is gradually reduced by increasing the hydration level and can be removed above a critical hydration level. Hydration also shifts the nonspecific alcohol binding from an entropy-driven to an enthalpy-driven process. This
ACKNOWLEDGMENTS
I would like to express my gratitude to my advisor, Dr. Yue Wu, for his guidance and help in my PhD study. He brought me into the fascinating area of NMR. He taught me how to do experiments, how to analyze data and find the physics behind it, how to present my works and write manuscripts, and most importantly, how to think deeply and creatively as a real scientist. The knowledge and skills I learnt from him will benefit me throughout my further work, which I appreciate thoroughly and deeply.
I would like to thank Dr. Alfred Kleinhammes, without the help and advice from him, it would not have been possible to complete my PhD work. I am also grateful to Dr. Horst
Kessemeier, a pioneer in NMR who sits next to me in the laboratory. I conducted most of my experiments using his magnet and NMR probes. I really enjoy the time talking with him about research as well as life experience.
I want to express my gratitude to Drs. Songhua Chen, Wei Shao, Magdalena Sandor, Mark Butler, and Lilong Li during my internship at Halliburton. With their help, I gained valuable experience in designing and developing NMR software and hardware.
I would like to thank my committee members, Drs. Yue Wu, Sean Washburn, Laurie E. McNeil, Rosa T. Branca, and Jack Y. Ng., for their good advice on my research and valuable suggestion on my dissertation and presentation. The questions they brought up also made me think deeply about my research topics.
Yan Song, Yanchun Ling, Yao An, Yunzhao Xing, Zhixiang Luo, Haijing Wang, Jacob
Forstater, Magdalena Sandor, Shaun Gidcumb, B. J. Anderson, and Courtney Hadsell. I benefit from the discussions and collaborations with them and I enjoy the time working with them.
I also want to thank my parents, for their encouragement and support during my PhD study. They have done too much to raise me, support my education, and give me a warm family. I understand that it was not easy for them. I really want to express my love to them.
TABLE OF CONTENTS
LIST OF TABLES ... xi
LIST OF FIGURES ... xii
LIST OF ABBREVIATIONS ... xvi
CHAPTER 1 INTRODUCTION ... 1
1.1 Water at Interfaces and in Confinement ... 1
1.1.1 Water: Structure and Property ... 1
1.1.2 Water on Surfaces: Interfacial Water ... 3
1.1.3 Water on Biomolecular Surfaces ... 5
1.1.4 Water in Confinement ... 6
1.2 Nuclear Magnetic Resonance ... 7
1.2.1 Nuclei in a Magnetic Field ... 7
1.2.2 Resonance and Free Induction Decay (FID) ... 9
1.2.3 Relaxation ... 10
1.3 Outlines of Dissertation ... 14
1.4 REFERENCES ... 17
CHAPTER 2 WATER ADSORPTION ON THE PROTEIN ... 19
2.1 Introduction ... 19
2.2 Experiments ... 20
2.2.1 Protein Samples ... 20
2.3 Results and Discussion ... 23
2.3.1 Adsorption Isotherms of Water on Proteins... 23
2.3.2 Upswing of Water Isotherm above h~0.2: Surface Adsorption vs Mixing Model ... 24
2.3.3 Temperature Dependence of Water Isotherms above h∼0.2 ... 26
2.3.4 Protein Elasticity and Its Temperature Dependence ... 28
2.3.5 Protein Structural Changes with Hydration and Temperature ... 29
2.3.6 Implication for Protein Functions ... 31
2.4 Conclusions ... 31
2.5 REFERENCES ... 33
CHAPTER 3 DYNAMICS AND THERMODYNAMICS OF PROTEIN HYDRATION ... 36
3.1 Introduction ... 36
3.2 Experiments ... 38
3.2.1 In-situ NMR Measurement ... 38
3.2.2 Determination of ∆G, ∆H, and T∆S ... 39
3.2.3 NMR T1 Relaxation Measurement ... 41
3.2.4 NMR T1ρ Relaxation Measurement ... 43
3.3 Results and Discussion ... 46
3.3.1 Hydration at Distinct Groups: Temperature Effect ... 46
3.3.2 Nano-Microsecond Protein Dynamics: Crossover at 10C and Hydration Effect ... 47
3.3.2.1 T1 Relaxation and Nanosecond (ns) Protein Dynamics ... 47
3.3.2.2 T1ρ Relaxation and Microsecond (µs) Protein Dynamics ... 50
3.3.2.3 Distinct Effects of Hydration at Hydrophilic and Hydrophobic Groups ... 53
3.3.2.5 Water-Protein Interactions and Protein Dynamics ... 55
3.3.3 Thermodynamics of Protein Hydration at Crossover Temperature ... 56
3.4 Conclusions ... 59
3.5 REFERENCES ... 60
CHAPTER 4 ALCOHOL-PROTEIN INTERACTIONS: SPECIFIC AND NONSPECIFIC BINDING ... 65
4.1 Introduction ... 65
4.2 Experiments ... 67
4.2.1 NMR Isotherm Measurements ... 67
4.2.2 Determination of ∆G, ∆H, and T∆S ... 68
4.3 Results and Discussion ... 68
4.3.1 Isotherms of Alcohols on the Protein ... 68
4.3.2 Thermodynamics of nonspecific alcohol binding ... 71
4.3.3 Comparison of Specific and Nonspecific Alcohol Binding ... 74
4.3.4 Active Role of Protein in Nonspecific Binding ... 75
4.4 Conclusions ... 77
4.5 REFERENCES ... 78
CHAPTER 5 ALCOHOL-PROTEIN INTERACTIONS: THE EFFECT OF HYDRATION ... 82
5.1 Introduction ... 82
5.2 Experiments ... 85
5.3 Results and Discussions ... 86
5.3.1 Alcohol Isotherms on Hydrated Proteins ... 86
5.3.2 Hydration and Protein Flexibility ... 88
5.3.4 Effects of Hydration on Alcohol Binding ... 93
5.3.5 Difference between Alcohols and Anesthetics ... 95
5.4 Conclusions ... 96
5.5 REFERENCES ... 98
CHAPTER 6 CONCLUSIONS ... 102
APPENDIX A ... 110
A1. T1ρ relaxation of BSA at spin-locking field B1~90 kHz ... 110
A2. Hydration effects on dynamics and thermodynamics of lysozyme around 10C ... 112
LIST OF TABLES
Table 4.1: ∆G, ∆H, and T∆S of EtOH and TFE binding to dry BSA at 10C and 20C. Relative vapor pressures in the region where nonspecific binding dominates the isotherms (after completion of binding to high-affinity sites and before denaturation taking place) are used in the calculation (EtOH at 10 C, P/P0~0.4; EtOH at 20 C,
P/P0~0.35; TFE at 10 C, P/P0~0.55; TFE at 20 C, P/P0~0.4). ∆G, ∆H, and T∆S are
LIST OF FIGURES
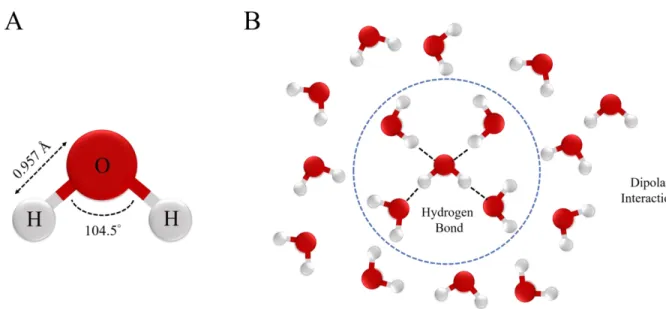
Figure 1.1: (A) Chemical structure of a water molecule (H2O). The mean O-H bond length is 0.957 Å and the mean H-O-H angle is 104.5°. (B) A water molecule can form up to four hydrogen bonds with nearby water molecules. The hydrogen bonds are illustrated in dotted lines. Meanwhile, the water molecule can interact with many
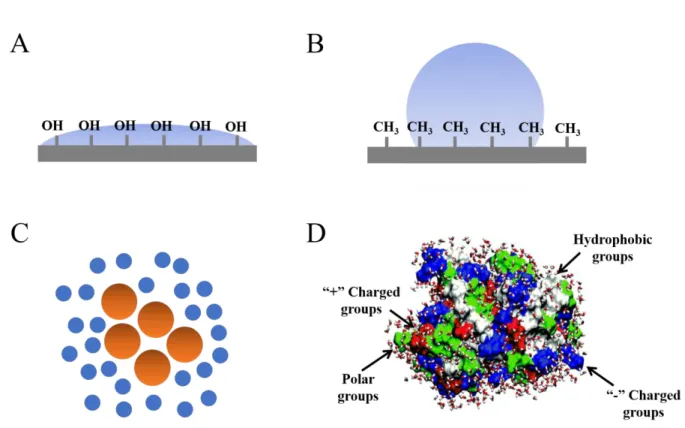
others via dipolar interactions. ... 2 Figure 1.2: (A) A typical hydrophilic surface that is composed of hydroxyl (OH)
groups. Water tends to spread on the surface. (B) A typical hydrophobic surface that is composed of methyl (CH3) groups. The surface tends to repel water molecules. (C) Hydrophobic solutes are illustrated by brown dots, and water molecules are illustrated by blue dots. Hydrophobic solutes tend to aggregate together and repel water
molecules out. (D) The surface of a protein is composed of various hydrophilic and hydrophobic groups. The positively (“+”) charged groups (red regions), negatively charged (“-”) groups (blue regions), and polar groups (green regions) are hydrophilic,
while nonpolar groups (white regions) are hydrophobic [20]. ... 4 Figure 1.3: (A) In hydrophilic confinement, such as in MCM-41 and SBA-15, water
molecules can absorb on the surface. (B) In hydrophobic confinement, such as in carbon nanotubes, water molecules tend to exclude from the surface and stay near the
cavity center. ... 7 Figure 1.4: A spin-1/2 nucleus in a static magnetic field B0. The spin processes at
Larmor frequency 0 B0. The energy of the spin splits into two states and the
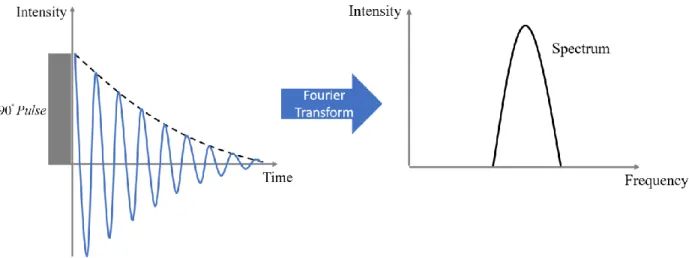
energy difference is E 0. ... 9 Figure 1.5: Illustration of a typical free induction decay (FID) signal. After Fourier
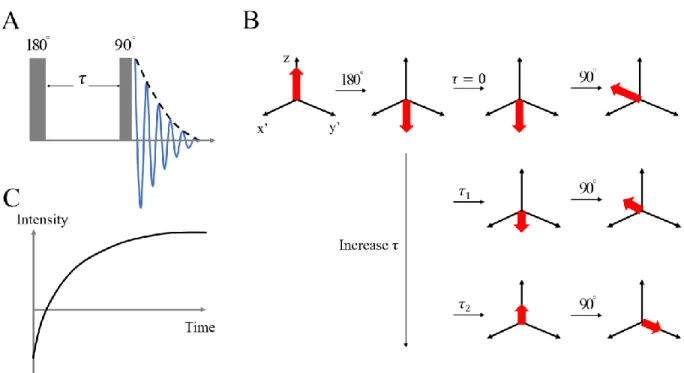
Transform (FT), the spectrum in the frequency domain is obtained. ... 10 Figure 1.6: (A) Inversion-recovery sequence to measure T1 relaxation. (B) The change
of the magnetization in the rotating frame during the pulse sequence. (C) The
regrowth curve of the magnetization in the T1 measurement. ... 11 Figure 1.7: (A) Spin echo (Hahn echo) sequence to measure T2 relaxation. (B) The
change of the magnetization during the pulse sequence. After the 90o pulse, because of the inhomogeneity in the magnetic field, some spins process faster (blue arrows) while some spins process slower (red arrows). A following 180o pulse is applied to refocus the magnetization, eliminating the inhomogeneous effect. (C) The decay
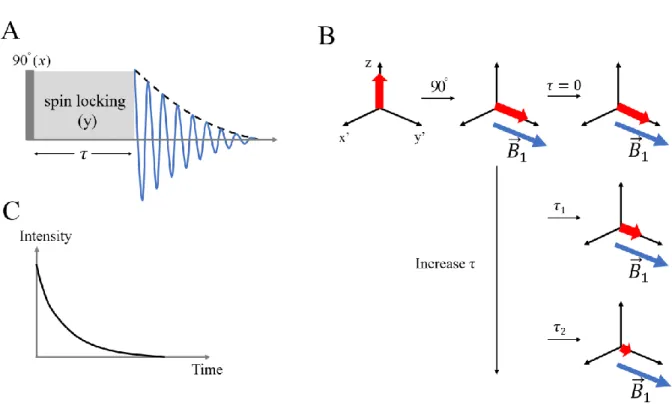
curve of the magnetization in the T2 measurement. ... 13 Figure 1.8: (A) Spin-locking sequence to measure T1ρ relaxation. (B) The change of
the magnetization in the rotating frame during the pulse sequence. After the 90o pulse, in the rotating frame, the magnetization is on the same direction with the RF field B1.
Figure 2.1: Illustration of the in-situ NMR instrument (for the 34MHz magnet). ... 21 Figure 2.2: (A) 1H NMR spectrum of dry BSA at 16C. Only a broad peak (FWHM
~40 kHz) is observed. (B) 1H NMR spectrum of BSA at 16C at hydration level h~0.15 (g water/g BSA). With hydration, the spectrum consists of a broad peak
(FWHM ~30 kHz) and a sharp peak (FWHM ~1-2 kHz) above it. ... 23 Figure 2.3: Water isotherms on (A) BSA and (B) lysozyme measured in situ at 3C, 5
C, 16C, and 27C by NMR. ... 24 Figure 2.4: Water isotherms on lysozyme measured 27C (red triangles, this work), 35
C (magenta squares, from reference [23, 24]) , and 50C (green circles, reference ). In contrast to Figure 2.3, these water isotherms only show weak temperature
dependence. ... 27 Figure 2.5: Elastic modulus of lysozyme versus temperature. Below 10 C, the elastic
modulus of the protein significantly increases with decreasing temperature [11, 26]. ... 29 Figure 3.1: Schematic illustration of hydration on the protein surface. Binding of
water to hydrophilic groups (convex surface shadowed in red) is insensitive to temperature while water adsorption on hydrophobic groups (concave surface shadowed in gray) depends strongly on temperature. Below 10C, the coupling
between water and hydrophobic groups is greatly suppressed. ... 38 Figure 3.2: (A) 1H NMR spectrum of BSA at 16C at hydration level h~0.15 (g
water/g BSA). It consists of a broad peak (FWHM ~30 kHz) and a sharp peak (FWHM ~1-2 kHz). (B) The decay of mp(t) and mw(t) at 3C at h = 0.354 (g water/g BSA) in T1 measurement. The decay curves are fitted by Equation (3.15). The fitting parameters 𝑅1±, 𝑐𝑝±, and 𝑐
𝑤± are used in Equation (3.16)-(3.18) to solve the intrinsic T1 relaxations of the protein and water as well as the proton exchange rate between the protein and water. (C) The decay of the reduced magnetization m(t) of BSA at 3C and 27C at h~0.15 in T1ρ measurement. As shown in the inset, ln(-ln(m)) is linear with ln(t), in agree with Eqn (16). The slope of the line equals the stretching
parameter β. ... 45 Figure 3.3: (A) Intrinsic T1 relaxation time of BSA and its hydration water (inset of
A) as a function of hydration level at 3C, 5C, 16C, and 27C. (B) The correlation time of BSA. Relative errors of T1 relaxations and correlation times at different
temperatures are very close. Hence, only error bars at 27C are shown. ... 48 Figure 3.4: Proton exchange rates (A) from hydration water to BSA kw, and (B) from
BSA to hydration water kp as a function of hydration level at 3C, 5C, 16C, and 27C.
kw and kp are calculated from Equation (3.15)-(3.18). Relative errors of exchange rates at different temperatures are very close. Hence, only error bars at 27C are
Figure 3.5: (A) T1ρ relaxation of BSA as a function of hydration level at 3C, 5C, 16 C, and 27C. (B) The correlation time of BSA derived from Equation (3.22). Here, T1ρ
is measured at the spin locking field B1 ~50 kHz. ... 51 Figure 3.6: (A) stretching parameter β as a function of hydration level at 3C, 5C, 16
C, and 27C. The distribution function of the correlation time at (B) 3C and (C) 27C
at hydration level h~0 (dry), 0.1, 0.15, 0.2, 0.3, and 0.5, derived from Equation (3.23). ... 52 Figure 3.7: (A) Changes in the Gibbs free energy ΔG associated with the hydration
process of BSA as a function of hydration level at 3C, 5C, 16C, and 27C. (B) Changes in enthalpy ΔH and entropy TΔS associated with the hydration process of
BSA at ~9C and ~21 C. ... 57 Figure 4.1: Adsorption isotherms of (A) EtOH and (B) TFE in dry BSA at 6C, 15C,
and 25C. The insets show isotherms below P/P0~0.7. Thresholds of relative vapor pressure in the isotherms are recognized. The threshold of relative vapor pressure is
P/P0~0.15 for EtOH (Inset of A) and P/P0~0.3 for TFE (Inset of B). The sorption of both alcohols shows little temperature dependence below this threshold and is marked with shade in yellow. Above the threshold, alcohol sorption is enhanced by
temperature. Sharp alcohol uptake above the relative vapor pressure of P/P0~0.7
occurs for both alcohols, associated with protein denaturation. ... 69 Figure 4.2: Adsorption-desorption isotherms of (A) EtOH and (B) TFE in dry BSA at
6C. Large hysteresis is observed for both alcohols. In desorption curves, there are ~50 bound EtOH and ~40 bound TFE that cannot be removed from BSA when the vapor pressure reaches 0. Such irreversibility indicates the denaturation of BSA by alcohols. The insets show adsorption-desorption isotherms below P/P0~0.65, showing
that the alcohol-protein interaction is reversible below P/P0~0.65. ... 70 Figure 4.3: Changes in the Gibbs free energy ∆G (black), enthalpy ∆H (red), and
entropy T∆S (blue) of (A) EtOH in dry BSA at 10C, (B) EtOH in dry BSA at 20C, (C) TFE in dry BSA at 10C and (D) TFE in dry BSA at 20C. The binding of both alcohols in the dry protein is totally driven by favorable entropy changes that compensate for the unfavorable enthalpy changes. The error bars of isotherms in
Figure 4.1 are propagated to calibrate the error bars. ... 73 Figure 5.1: (A) Isotherms of TFE in hydrated BSA at 15C below P/P0=0.3 at various
hydration levels. Dotted straight lines associated with the isotherms of h=0.11, 0.16 and 0.18 illustrate how the threshold (the intercept of the dotted line with the
horizontal line of y=0) is determined for a given isotherm associated with nonspecific alcohol binding. (B) The determined alcohol relative vapor pressure threshold is plotted versus h at 15C. The threshold decreases linearly with h and reaches zero at
h=0.32 and 15C and 25C. The isotherms at h=0.11 show a relative pressure threshold
at P/P0~0.25, while no threshold is seen in isotherms at h=0.32. ... 88 Figure 5.2: (A) Water isotherms on BSA at 6 C, 15 C, and 25 C. (B) 1H spectra of the
protein at different hydration levels. (C) Changes of the protein 1H NMR linewidth
with hydration level at 6C, 15C, and 25C. ... 89 Figure 5.3: Changes in the Gibbs free energy ∆G (black), enthalpy ∆H (red), and
entropy T∆S (blue) of TFE binding to hydrated BSA at 20C at (A) h=0.11, (B)
h=0.21, and (C) h=0.32. Isotherms at 15C and 25C were used to calculate ∆G, ∆H, and T∆S at 20C. In contrast to binding in dry protein, binding of TFE to hydrated protein is driven by favorable enthalpy changes that compensate for the unfavorable
entropy changes. ... 91 Figure 5.4: ∆G, ∆H, and T∆S of TFE binding in hydrated BSA versus hydration level
h at 20C. Relative vapor pressures in the region where nonspecific binding dominates the isotherms (after completion of binding to high-affinity sites and before
denaturation taking place) are used in the calculation (dry, P/P0~0.4; h=0.11,
P/P0~0.4; h=0.21, P/P0~0.2; h=0.32, P/P0~0.1). ∆G, ∆H, and T∆S are calculated at
such relative vapor pressures and plotted in Figure 5.4. ... 93 Figure 6.1: Illustration of protein-water interactions. The interaction of water with
hydrophilic groups on the protein is temperature independent. In contrast, the interaction of water with hydrophobic groups strongly depends on the temperature. Above 10C water intimately mixes with hydrophobic groups, while below 10C the mixing process is substantially suppressed. Such phenomenon is caused by the
change in the protein flexibility with temperature. ... 103 Figure 6.2: Illustration of the crossover at 10C in protein dynamics and
thermodynamics. ... 105 Figure 6.3: Illustration of alcohol (blue ball) binding to the protein (gray block) in
water (red-white sticks). When the alcohol molecule approaches the protein, (A) in previous works, water around the binding site is displaced and rearranged, resulting in the structural modifications in the water network. In this case, the protein is
considered as a rigid cavity. (B) in this dissertation, the state of the protein changes before (green) and after (orange) the binding. The change of the protein is enabled by water-protein coupling. Because of this mechanism, alcohol binding increases
dramatically with hydration level, especially above the hydration level of 0.2 (g water/g protein). With increasing hydration, alcohol binding also changes from a
LIST OF ABBREVIATIONS
BET Brunauer, Emmett, and Teller
BSA Bovine Serum Albumin
EtOH Ethanol
FID Free Induction Decay FT Fourier Transformation
FWHM Full Width at Half Maximum
HEWL Hen Egg White Lysozyme
NMR Nuclear Magnetic Resonance
RF Radio Frequency
CHAPTER 1
INTRODUCTION 1.1 Water at Interfaces and in Confinement
1.1.1 Water: Structure and Property
Water is present everywhere. It is well known that 70% of the Earth’s surface is covered by liquid water and water vapor is an important constituent of the atmosphere [1-4]. In particular, water is essential to living systems [1, 2, 5-8]: without water, life would not exist and evolve.
The chemical structure of water is simple. As shown in Figure 1.1 (A), a water molecule (H2O) consists of two hydrogen atoms (H) that are attached to one oxygen atom (O). The mean O-H bond length is 0.957 Å and the mean H-O-H angle is 104.5° [1, 2, 9]. The oxygen atom has a nucleus of eight positive charges while the hydrogen atom nucleus only has one positive
Figure 1.1: (A) Chemical structure of a water molecule (H2O). The mean O-H bond length is 0.957 Å and the mean H-O-H angle is 104.5°. (B) A water molecule can form up to four hydrogen bonds with nearby water molecules. The hydrogen bonds are illustrated in dotted lines. Meanwhile, the water molecule can interact with many others via dipolar interactions.
behaviors of water make it very different from other liquids. Although there exist extensive studies focusing on the properties of water, the mechanism underlying the unique properties of water remains controversial and far from being understood [1, 12]. Therefore, research on water is still one of the most exciting topics in science.
1.1.2 Water on Surfaces: Interfacial Water
When water is in the proximity of a surface, its behavior becomes more intriguing. It has been found that the structure, dynamics (including the diffusion, rotation, and vibration
behavior), and thermodynamics (including entropy, enthalpy, and phase transition property) of interfacial water all differ from those of bulk water [13, 17-19]. In general, the influence of an existing surface comes from two aspects [13, 17-19]. First, water can directly interact with the surface via hydrogen bonds, electrostatic forces, and other interactions. Second, water-water interactions can be disturbed and the water network over the surface is then reorganized. Although it has been recognized that these effects can contribute to the unusual properties of interfacial water, there is yet no agreement on the detailed mechanism [17-19].
17-19]. This so-called “hydrophobic effect” results in the well-known oil-water separation [18], and also leads to the cell membrane formation, protein folding, and lipid-protein interaction [17]. Therefore, the interactions of water with hydrophilic and hydrophobic components have been of particular interest to researchers.
Figure 1.2: (A) A typical hydrophilic surface that is composed of hydroxyl (OH) groups. Water tends to spread on the surface. (B) A typical hydrophobic surface that is composed of methyl (CH3) groups. The surface tends to repel water molecules. (C) Hydrophobic solutes are illustrated by brown dots, and water molecules are illustrated by blue dots. Hydrophobic solutes tend to aggregate together and repel water
charged (“-”) groups (blue regions), and polar groups (green regions) are hydrophilic, while nonpolar groups (white regions) are hydrophobic [20].
1.1.3 Water on Biomolecular Surfaces
Water on the surface of a biomolecule is called “hydration water” [6, 7, 21, 22]. Hydration water is an integral part of a biomolecule, because it is of central importance for a biomolecule to maintain its three-dimensional structure and fluctuate between different
conformations [6-8, 23]. Moreover, hydration water is actively involved in a variety of essential biological processes, such as protein folding, enzymatic activation, nucleic acid interactions, and drug recognition [6-8, 23]. Due to the importance of hydration water, extensive work has been done to investigate the hydration mechanism of proteins, nucleic acids, and membranes [8].
This dissertation is focused on the hydration of proteins. It has been recognized that without hydration, there is no protein activity [21, 22]. The protein activity is restored only when the amount of hydration water reaches ~0.2 (g water/g protein), and it increases dramatically with hydration till ~0.5 (g water/g protein) [21, 22]. Moreover, it has been suggested that hydration water drives protein folding and denaturation [8, 21-24]. In addition, hydration water mediates the recognition process in proteins [8, 21-23]. It is found that hydration water can help drug molecules target their binding sites [25, 26]. The mechanism underlying protein hydration is the key to understand protein functions; therefore, the effect of hydration on proteins is one of the main topics in this dissertation.
In particular, a protein is composed of a variety of hydrophilic (charged and polar) and hydrophobic (non-polar) groups [8, 20-22]; hence, the surface of a protein is highly
hydrophilic and hydrophobic components in distinct ways [8, 17, 18]. Therefore, this dissertation also aims to investigate how differently water at hydrophilic and hydrophobic groups affect protein properties.
1.1.4 Water in Confinement
When water is confined, it has to interact with the relatively large cavity surface and fit within the available space. Some well-known examples include water in the ion-channels of cell membranes [6, 8] and water in sedimentary rocks in the ground [27]. The configuration,
orientation, and motion of confined water are largely restricted [13, 28-30]. The hydrogen-bonding pattern of the confined water network is also altered [13, 28-30]. The property of confined water strongly depends on the degree of confinement and the surface characteristics [13, 28-30].
Figure 1.3: (A) In hydrophilic confinement, such as in MCM-41 and SBA-15, water molecules can absorb on the surface. (B) In hydrophobic confinement, such as in carbon nanotubes, water molecules tend to exclude from the surface and stay near the cavity center.
1.2 Nuclear Magnetic Resonance 1.2.1 Nuclei in a Magnetic Field
The atomic nucleus is composed of protons and neutrons, which are known as nucleons. The spins of nucleons give rise to the total spin of the nucleus. In an external magnetic field, the nuclear spin interacts with the field in a way that is analogous to a compass in the Earth’s magnetic field. Specifically, the nuclear spin is quantized and the spin quantum number is denoted as I. The spin only has (2I+1) orientations with the magnetic quantum number m equals -I, -I+1, … I. Typical spin-1/2 (I=1/2) nuclei include 1H, 19F, 31P, and 15N. Typical spin-1 (I=1) nuclei include 2H and 14N. 23Na is a typical spin-3/2 (I=3/2) nucleus.
When a spin-1/2 nucleus is placed in a static magnetic field B0, there exist two states for the spin with the magnetic quantum number m equals +1/2 and -1/2, respectively. The magnetic moment µ of the spin is defined as µ = γI, where γ is the gyromagnetic ratio. If we define the
direction of the static magnetic field B0 as z, the z component of the spin 2 z
h
I m
component of the magnetic moment 2 z h m
. The energy of the magnetic moment in the
magnetic field is E B0 zB0. Therefore, for the spin-1/2 nucleus, there exist two energy
levels with 0
1 1 2 2 hB E
and 0
2 1 2 2 hB E
. The energy difference is 0 0
2
hB
E
,
where 0 B0. ω0 is the well-known Larmor frequency, i.e. the procession rate of a magnetic momentum in a magnetic field [31, 32]. This is illustrated in Figure 1.4. The population of the spins at two energy states can be described by the Boltzmann distribution [31, 32]. The
population ratio is 1 0
2
exp( ) exp( )
B B
N E
N k T k T
, where N1 and N2 represent the population of
spins at the low-energy state and the high-energy state, respectively. Assuming that protons (1H) are in a magnetic field of 1T at room temperature (300K), the population ratio of protons at two states is 6
Figure 1.4: A spin-1/2 nucleus in a static magnetic field B0. The spin processes at Larmor frequency 0 B0. The energy of the spin splits into two states and the energy difference is E 0.
1.2.2 Resonance and Free Induction Decay (FID)
To transit between two energy levels, the spin must absorb or emit an amount of energy that equals E 0. Therefore, if an oscillating RF field (a pulse) with Larmor frequency (ω0) is applied to the nucleus, the nuclear spin can jump from the low-energy state to the high-energy state. When the RF pulse is removed, the nuclear spin would relax to its low-energy state and re-emit RF waves with the Larmor frequency (ω0). This process is called magnetic resonance [31, 32].
To describe the behavior of the macroscopic magnetization generated by all spins, it is preferred to switch from the laboratory frame to a rotating frame. The frame is rotating at Larmor frequency with the static magnetic field B0. The RF field generates a magnetic field B1 that is perpendicular to the static magnetic field B0; hence, in the rotating frame, the effect of such RF pulse is to flip the magnetization with a certain angle with respect to the z axis (the direction of
Figure 1.5: Illustration of a typical free induction decay (FID) signal. After Fourier Transform (FT), the spectrum in the frequency domain is obtained.
1.2.3 Relaxation
When the RF pulse is removed, the spin system will return to its equilibrium state. This process is called relaxation. Some common relaxation processes include the spin-lattice
relaxation, the spin-spin relaxation, and the spin-lattice relaxation in the rotating frame [31, 32]. The spin-lattice relaxation (or longitudinal relaxation) corresponds to the regrowth of the magnetization in the z direction (Mz) [31, 32]. In this process, the spins in the excited state relax to the equilibrium state and transfer energy to the “lattice”. The so-called “lattice” can be rotations and vibrations of the molecule. T1 is denoted to characterize the spin-lattice relaxation process,
0 1
z
z M M
dM
dt T
(1.1)
0
1
(1 exp( )) z
t
M M
T
(1.2)
include the inversion-recovery sequence and the saturation-recovery sequence [31, 32]. The inversion-recovery sequence is illustrated in Figure 1.6. A 180o pulse is applied to flip the magnetization from Mz to -Mz. During a time interval τ, the magnetization regrows to the z direction. After that, a 90o pulse is applied to flip the magnetization (M(τ)) to the x-y plane. Finally, the FID signal is acquired. The T1relaxation time can be obtained by varying the time interval τ and fitting the FID intensity with Equation (1.2).
Figure 1.6: (A) Inversion-recovery sequence to measure T1 relaxation. (B) The change of the magnetization in the rotating frame during the pulse sequence. (C) The
regrowth curve of the magnetization in the T1 measurement.
pulse, nuclear spins gradually lose their coherence, inducing the decay of Mxy. T2 is denoted to characterize the spin-spin relaxation process,
2
xy xy
dM M
dt T (1.3)
0
2
exp( ) xy
t
M M
T
(1.4)
A typical pulse sequence to measure T2 is the spin-echo (Hahn echo) sequence, which is
illustrated in Figure 1.7. A 90o pulse is applied to flip the magnetization from Mz to Mxy. During a time interval τ, the magnetization Mxy decays. Due to the inhomogeneity in the magnetic field, different spins may process at different rates. A following 180o pulse is applied to refocus the magnetization a time interval τ, eliminating the inhomogeneous effects [31, 32]. The T2
Figure 1.7: (A) Spin echo (Hahn echo) sequence to measure T2 relaxation. (B) The change of the magnetization during the pulse sequence. After the 90o pulse, because of the inhomogeneity in the magnetic field, some spins process faster (blue arrows) while some spins process slower (red arrows). A following 180o pulse is applied to refocus the magnetization, eliminating the inhomogeneous effect. (C) The decay curve of the magnetization in the T2 measurement.
The spin-lattice relaxation in the rotating frame corresponds to the decay of the
magnetization along the RF field (B1) [31, 32]. T1ρ is the time constant of this decay process. T1ρ
is obtained by the spin-locking pulse sequence, which is illustrated in Figure 1.8. A 90o pulse is applied to flip the magnetization from Mz to Mxy. After that, a long-duration and low-power RF pulse is applied in the same direction as the magnetization in the x-y plane. Hence, the
magnetization appears to be “locked” in the rotating frame by such an RF pulse, which is also called the “spin-locking” pulse. During the spin-locking time interval τ, the magnetization decays along the RF field (B1) in the rotating frame. The T1ρ relaxation time can be obtained by varying
the time interval τ and fitting the FID intensity with Equation (1.6).
1
xy xy
dM M
dt T (1.5)
0
1 exp( spin locking)
xy
M M
T
(1.6)
Particularly, T1ρ characterizes the relaxation in the RF field (B1) which is usually about ~kHz; in
process (~ms), while T1 and T2 measurements are usually used to characterize the fast relaxation process (~ns) [31, 32].
Figure 1.8: (A) Spin-locking sequence to measure T1ρ relaxation. (B) The change of
the magnetization in the rotating frame during the pulse sequence. After the 90o pulse, in the rotating frame, the magnetization is on the same direction with the RF field B1. (C) The decay curve of the magnetization in the T1ρ measurement.
1.3 Outlines of Dissertation
interactions. This dissertation is organized as follows:
In CHAPTER 2, I investigate the interaction between hydration water and the protein. I use an in-situ NMR technique to measure water isotherms on proteins at different temperatures. The unique NMR technique is introduced in detail. A qualitative change in the water isotherms around 10C is observed. This phenomenon is explained by the change of protein’s elasticity with temperature and is discussed in detail.
In CHAPTER 3, I discuss the thermodynamic and dynamic properties of the protein during its hydration process. The method of determining the changes in the free energy, entropy, and enthalpy of protein hydration is introduced. The dynamics of the protein on the timescales of nanosecond (ns) and microsecond (ms) are measured by NMR. Different roles of hydration at hydrophilic and hydrophobic groups are identified. A crossover in protein dynamics and thermodynamics at 10C is revealed. This is induced by the qualitative changes in the protein-water interaction at 10C, which is discussed in Chapter 2.
In CHAPTER 4, I study the interactions between alcohols and proteins. Isotherms of alcohols on dry proteins are obtained by the in-situ NMR technique introduced in Chapter 2. The thermodynamics of the alcohol-dry protein interaction are also studied. It is found that alcohol is able to bind to dry proteins and there exist two distinct types of alcohol-protein interactions.
In CHAPTER 5, I study the effect of hydration on the alcohol-protein interaction. Isotherms of alcohols on the protein are measured at different levels of protein hydration. The thermodynamics of the alcohol-protein interaction are studied as a function of hydration level. It is found that hydration facilitates the alcohol binding to nonspecific sites via reducing the
are also discussed.
1.4 REFERENCES
[1] D. Eisenberg, W. Kauzmann, The structure and properties of water, Oxford University Press, 2005.
[2] M. Chaplin, http://www1.lsbu.ac.uk/water/index.html.
[3] L.B. Railsback, An earth scientist's periodic table of the elements and their ions, Geology 31 (2003) 737-740.
[4] S. Mockler, Water vapor in the climate system, Special Report, American, Geophysical Union (1995).
[5] F. Franks, Water: a matrix of life, Royal Society of Chemistry, 2000. [6] A. Author, Water in biological systems, Royal Society of Chemistry, 2010.
[7] D. Zhong, S.K. Pal, A.H. Zewail, Biological water: A critique, Chem. Phys. Lett. 503 (2011) 1-11.
[8] P. Ball, Water as an active constituent in cell biology, Chem. Rev. 108 (2008) 74-108. [9] A.G. Császár, G. Czakó, T. Furtenbacher, J. Tennyson, V. Szalay, S.V. Shirin, N.F. Zobov, O.L. Polyansky, On equilibrium structures of the water molecule, The Journal of chemical physics 122 (2005) 214305.
[10] V. Voloshin, Y.I. Naberukhin, Proper and improper hydrogen bonds in liquid water, J. Struct. Chem. 57 (2016) 497-506.
[11] A. Rastogi, A.K. Ghosh, S. Suresh, Hydrogen Bond Interactions Between Water Molecules in Bulk Liquid, Near Electrode Surfaces and Around Ions, INTECH Open Access Publisher, 2011.
[12] A. Nilsson, L.G. Pettersson, The structural origin of anomalous properties of liquid water, Nat. Commun. 6 (2015).
[13] S. Granick, S.C. Bae, A curious antipathy for water, Science 322 (2008) 1477-1478. [14] D.H. Lawrence, The complete poems of DH Lawrence, Wordsworth Editions, 1994. [15] H. Tanaka, Simple physical explanation of the unusual thermodynamic behavior of liquid water, Phys. Rev. Lett. 80 (1998) 5750.
[17] L.R. Pratt, A. Pohorille, Hydrophobic effects and modeling of biophysical aqueous solution interfaces, Chem. Rev. 102 (2002) 2671-2692.
[18] D. Chandler, Interfaces and the driving force of hydrophobic assembly, Nature 437 (2005) 640-647.
[19] C. Sendner, D. Horinek, L. Bocquet, R.R. Netz, Interfacial water at hydrophobic and hydrophilic surfaces: Slip, viscosity, and diffusion, Langmuir 25 (2009) 10768-10781.
[20] L. Mitra, N. Smolin, R. Ravindra, C. Royer, R. Winter, Pressure perturbation calorimetric studies of the solvation properties and the thermal unfolding of proteins in solution—
experiments and theoretical interpretation, PCCP 8 (2006) 1249-1265.
[21] J.A. Rupley, G. Careri, Protein hydration and function, Adv. Protein Chem. 41 (1991) 37-172.
[22] I.D. Kuntz, W. Kauzmann, Hydration of Proteins and Polypeptides, Adv. Protein Chem. 28 (1974) 239-345.
[23] M. Chaplin, Do we underestimate the importance of water in cell biology?, Nat. Rev. Mol. Cell Biol. 7 (2006) 861-866.
[24] F. Mallamace, C. Corsaro, D. Mallamace, P. Baglioni, H.E. Stanley, S.-H. Chen, A possible role of water in the protein folding process, The Journal of Physical Chemistry B 115 (2011) 14280-14294.
[25] J.E. Ladbury, Just add water! The effect of water on the specificity of protein-ligand binding sites and its potential application to drug design, Chemistry & Biology 3 (1996) 973-980.
[26] R. Baron, J.A. McCammon, Molecular recognition and ligand association, Annual review of physical chemistry 64 (2013) 151-175.
[27] S. Rocks, Petrology of the sedimentary rocks, Cambridge University Press, (1974). [28] N.E. Levinger, Water in confinement, Science 298 (2002) 1722-1723.
[29] M.F. Chaplin, Structuring and behaviour of water in nanochannels and confined spaces, Adsorption and phase behaviour in nanochannels and nanotubes, Springer, 2010, pp. 241-255. [30] F. Mallamace, C. Corsaro, D. Mallamace, S. Vasi, C. Vasi, H.E. Stanley, Thermodynamic properties of bulk and confined water, The Journal of chemical physics 141 (2014) 18C504. [31] A. Abragam, The principles of nuclear magnetism, Oxford university press1961.
CHAPTER 2
WATER ADSORPTION ON THE PROTEIN
2.1 Introduction
Hydration water plays a crucial role in protein folding, enzyme catalysis, and protein-ligand interactions [1-3]. For instance, it has been suggested that hydrophobic interactions originating from the disruption and reconstruction of the hydration shell may drive protein folding [1, 2, 4, 5]. Furthermore, it is known that the onset of the enzymatic activity of a protein requires a minimum hydration level h ~0.2 (g water/g protein) [6, 7]. In addition, some
researchers have suggested that water molecules at specific groups on the protein surface are critical for ligands to target their binding sites [3, 8, 9]. Therefore, the mechanism governing protein-water interactions has attracted great attention over the past decades.
instrument, which enables me to measure isotherms at in-situ sample conditions with precisely controlled vapor pressure and temperature.
By employing this in-situ NMR method, I measured water isotherms on proteins over a wide range of water vapor pressure and temperatures. It is found that there is a qualitative change in the water isotherm above the hydration level h of ~0.2 (g water/g protein), especially around 10C. This is induced by the change in the protein elasticity and will be discussed in detail. The work in this chapter shows the significant effect of hydration on protein flexibility and protein function.
2.2 Experiments 2.2.1 Protein Samples
Two typical globular proteins, bovine serum albumin (BSA) and hen egg-white lysozyme (HEWL), are used in the experiments. BSA (lyophilized powder, ≥ 98%, pH ≈ 7, 1% in 0.15 M NaCl) and HEWL (catalog no. L-7561, 3x crystallized, dialyzed, and lyophilized) are purchased from Sigma-Aldrich and used without further purification. These two proteins are very common model proteins because of their well-known protein structure and function [11, 13-15].
2.2.2 NMR Isotherm Measurements
Figure 2.1: Illustration of the in-situ NMR instrument (for the 34MHz magnet).
sharp peak with FWHM of ~1-2 kHz above the broad peak is now observed. The 1H NMR signal of water vapor in the empty NMR tube without a protein sample is negligible as compared to this sharp peak. Therefore, this sharp peak is associated with water sorption in the protein. The integrated area of the spectrum of the dry protein is subtracted from that of the hydrated protein; hence, such difference in the spectrum intensity is purely attributed to protons from adsorbed water and is used to calculate the protein hydration level h (g water/g protein), based on the ratio of proton numbers of the protein and water. Isotherms are obtained by carrying out the
Figure 2.2: (A) 1H NMR spectrum of dry BSA at 16C. Only a broad peak (FWHM ~40 kHz) is observed. (B) 1H NMR spectrum of BSA at 16C at hydration level
h~0.15 (g water/g BSA). With hydration, the spectrum consists of a broad peak (FWHM ~30 kHz) and a sharp peak (FWHM ~1-2 kHz) above it.
2.3 Results and Discussion
2.3.1 Adsorption Isotherms of Water on Proteins
Figure 2.3: Water isotherms on (A) BSA and (B) lysozyme measured in situ at 3C, 5 C, 16C, and 27C by NMR.
Similar water isotherms on BSA and lysozyme are observed, indicating that such hydration behavior could be general in globular proteins due to their similar surface chemistry [6, 7, 18]. It has been suggested that water adsorption on globular proteins has several stages [6, 7]. Briefly, when the protein hydration level h < ∼0.2 (g water/g protein), water only binds to hydrophilic (charged and polar) groups on the protein surface; when h > ∼0.2, all the hydrophilic groups are covered and water starts interacting with hydrophobic (nonpolar) groups. The results in Figure 2.3 indicate that water interacts differently with hydrophilic and hydrophobic groups on the protein, where the temperature plays distinct roles.
describing this multilayer formation process is the Brunauer-Emmett-Teller (BET) theory [19]. In the BET theory, the amount of the adsorbed molecules v can be expressed as:
(1 )[( 1) 1] m
v cx v
x c x
(2.1)
or, ( 1)
1 ( 1) 1
m
v x c x
v x c x
(2.2)
where vm is the amount of the monolayer adsorbed molecules,
0 P x
P
, and c is the BET constant
which is related to the heat of adsorption. It is seen in Equation (2.2) that the adsorption
dramatically increases with increasing vapor pressure, and the amount of adsorption would reach infinity when P/P0 approaches 1. In fact, the spatial restriction of the protein surface will set a limitation on the number of adsorbed water layers and prevent the condensation of bulk water [6, 7, 11].
In an alternative theory, the upswing of the isotherm above h~0.2 is explained by the mixing of the protein with water molecules based on the Flory-Huggins solution theory [6, 20, 21]. In the Flory-Huggins theory, the number of adsorbed water molecules is N1 and the protein is composed of N2 molecules. The adsorption is treated as a mixing process of N1 water
molecules with N2 protein molecules in a 3-D lattice. In the lattice, each water molecule occupies one lattice cell and the protein occupiesxlattice cells. In the view of thermodynamics, the Gibbs free energy change of the mixing process is:
m m m el
G H T S H
(2.3)
There are there terms in Equation (2.3). The first termHmis the enthalpy of mixing:
1 2
1 2
B m
k TN N H
N xN
where is a constant that is related to the strength of the protein-water interaction. The second termSmis the entropy of mixing:
1 1 2 2
( ln ln )
m B
S k N v N v
(2.5)
where 1
1 1 2 N v N xN and 2 2 1 2 xN v N xN
are the volume ratios of water and the protein
respectively. The third term Helis the elastic energy of the system due to the volume expansion of the protein in the mixing process.
1/3 2 2 1 ( 1) 2 el
H KV v
(2.6)
where K is a parameter representing the elastic modulus of the protein, and V is the total volume of N1 water molecules and N2 protein molecules. Therefore, it is seen that the mixing of water and the protein is driven by the favorable change in the entropy of the mixingSm. The upswing in the isotherm induces a dramatic increase in the entropy of the mixing, hence it is favored by the change in the Gibbs free energy.
2.3.3 Temperature Dependence of Water Isotherms above h ∼0.2
measured at 35C (magenta squares) and 50C (green circles) in the reference [23-25]. It is seen that the water isotherms in Figure 2.4 show little temperature dependence, which is different from the result in Figure 2.3.
Figure 2.4: Water isotherms on lysozyme measured 27C (red triangles, this work), 35 C (magenta squares, from reference [23, 24]) , and 50C (green circles, reference ). In contrast to Figure 2.3, these water isotherms only show weak temperature
dependence.
small to have any effect on the isotherm [6, 7, 20, 21], so the isotherm was thought to be dominated by the first and second terms in Equation (2.3), which are temperature independent. However, this claim is not correct when the temperature is below 10C [11] and will be discussed later. Another reason is that it is very inconvenient to measure water isotherms at low
temperatures by traditional gravimetric and volumetric methods, especially around 0C [6, 7, 10-12]. Here, the in-situ NMR technique enables me to precisely measure water isotherms below 10 C; hence the unique temperature dependence of water isotherms above P/P0 ∼0.7 is revealed.
2.3.4 Protein Elasticity and Its Temperature Dependence
In the BET theory, the first term in Equation (2.3) dominates the isotherm at high vapor pressure (above h~0.2) and is temperature independent. The second term contains a BET constant c showing weak temperature dependence [6, 7, 19]; however, it has a trivial
contribution to the isotherm in such a small temperature variation as in Figure 2.3 (from 27C to 3C). Hence, the strong temperature dependence of water adsorption on the protein above h~0.2 cannot be explained by the traditional surface adsorption theory.
In the Flory-Huggins theory, the third termHel in Equation (2.3) was generally ignored and the isotherm was believed to be dominated by the other two temperature independent terms [6, 7, 20, 21]; however, our previous work has shown that this is incorrect, especially at
temperatures below 10C [11]. The third termHel actually plays a critical role in water
strong temperature dependence of the water isotherm above h~0.2 around 10C [11]: when the temperature decreases below 10C, the elastic modulus of the protein increases dramatically; hence, the elastic energyHel of the system is very large. According to Equation (2.3), this would substantially increase the Gibbs free energy changeGm. In other words, the mixing of water and the protein below 10C is significantly energy unfavorable. Therefore, water
adsorption on the protein below 10C is substantially suppressed.
Figure 2.5: Elastic modulus of lysozyme versus temperature. Below 10 C, the elastic modulus of the protein significantly increases with decreasing temperature [11, 26].
2.3.5 Protein Structural Changes with Hydration and Temperature
It has been shown that the elastic modulus of the protein decreases dramatically with increasing hydration level till h~0.2, but it depends weakly on the hydration level above h~0.2 [28]. This indicates that water at hydrophilic groups strongly enhances the protein flexibility, while water at hydrophobic groups weakly affects the protein flexibility. This is because in the dry protein there exist strong hydrogen bonds and electrostatic contacts between hydrophilic groups of the protein, leading to a very compact protein structure [6, 7, 29]. Hydration of hydrophilic groups (h<~0.2) can loosen the compact structure and ease the spatial restriction in the protein, because the strong non-native protein-protein interactions are replaced by water-protein hydrogen bonds [6, 7, 29]. This significantly increases the flexibility of the water-protein. In addition, it has been recognized that hydration of hydrophilic groups basically removes all non-native interactions in the protein, and the protein structure above h~0.2 is similar to that in solution [6, 7, 29]. Further hydration of the hydrophobic groups (h>~0.2) has a weak effect on the protein structure [6, 7, 29], hence the elastic modulus of the protein hardly changes above
h~0.2.
Figure 2.5 shows that the elastic modulus of the protein weakly depends on the
protein [14, 32]. As the temperature decreases below 10 C, the relative angles between α helices significantly change, leading to a more compact packing of helix units [31-33]. Such local structural distortion below 10 C results in a strong spatial restriction of α helices, substantially decreasing the protein flexibility [31-33]. Meanwhile, the cavities between helices are shrunk and water molecules in those cavities are squeezed out [31-33]. These microscopic structural changes in the protein are consistent with the crossover around 10 C in the protein flexibility and water adsorption reported in this chapter.
2.3.6 Implication for Protein Functions
It is worth mentioning that the property of water adsorption on proteins is strongly correlated to protein functions. For instance, the protein has no enzymatic activity without
hydration and it requires a minimum hydration level of h~0.2 to restore the enzymatic activity [6, 7]. This agrees with the change in water isotherms around h~0.2. At h~0.2, water starts mixing with the protein, accompanying the activation of the enzyme. In addition, it has been reported that above h~0.2, the enzymatic activity of the protein decreases with decreasing temperature from 50C to 5C [34]. This is consistent with the temperature dependence of water isotherms on proteins above h~0.2. As the temperature decreases, the adsorption of water is substantially reduced especially below 10C, accompanying the decrease in the enzymatic activity. Therefore, the results in this chapter show that hydration water is critical to protein functions.
2.4 Conclusions
proteins over a wide range of hydration level and temperature; as a result, some unique
properties of protein hydration are revealed. It is found that when the hydration level h is below ~0.15-0.2, water adsorption increases linearly with the water vapor pressure and the isotherms at different temperatures practically overlap. Above h~0.15-0.2, the water isotherms show obvious temperature dependence: there is a dramatic upswing in the isotherms above 10C, while water adsorption below 10C is substantially suppressed.
As explained above, at h<~0.15-0.2 water only binds to hydrophilic (charged and polar) groups on the protein surface via electrostatic forces and hydrogen bonding that are hardly affected by the small temperature variation in our experiment. When h>~0.15-0.2, water starts mixing with hydrophobic (nonpolar) protein groups favored by the entropy of mixing. At higher temperatures, the elastic modulus of protein is small and such mixing of the protein with water is energetically less costly in terms of elastic energy. However, at lower temperatures, the protein becomes rigid with much larger elastic modulus and the mixing process becomes energetically unfavorable. The reduction in the protein flexibility with decreasing temperature is particularly significant below 10C. As a result, adsorption of water at hydrophobic groups is drastically reduced below 10C.
The changes in the water isotherms are found to be directly related to protein functions. The onset of protein enzymatic activity at h~0.2 is consistent with the upswing of water
2.5 REFERENCES
[1] P. Ball, Water as an active constituent in cell biology, Chem. Rev. 108 (2008) 74-108. [2] Y. Levy, J.N. Onuchic, Water mediation in protein folding and molecular recognition, Annu. Rev. Biophys. Biomol. Struct. 35 (2006) 389-415.
[3] Z. Li, T. Lazaridis, Water at biomolecular binding interfaces, PCCP 9 (2007) 573-581. [4] L.R. Pratt, A. Pohorille, Hydrophobic effects and modeling of biophysical aqueous solution interfaces, Chem. Rev. 102 (2002) 2671-2692.
[5] F. Mallamace, C. Corsaro, D. Mallamace, P. Baglioni, H.E. Stanley, S.-H. Chen, A possible role of water in the protein folding process, The Journal of Physical Chemistry B 115 (2011) 14280-14294.
[6] J.A. Rupley, G. Careri, Protein hydration and function, Adv. Protein Chem. 41 (1991) 37-172.
[7] I.D. Kuntz, W. Kauzmann, Hydration of Proteins and Polypeptides, Adv. Protein Chem. 28 (1974) 239-345.
[8] R. Baron, P. Setny, J. Andrew McCammon, Water in cavity− ligand recognition, J. Am. Chem. Soc. 132 (2010) 12091-12097.
[9] G. Hummer, Molecular binding: Under water's influence, Nat. Chem. 2 (2010) 906-907. [10] G. Diakova, Y.A. Goddard, J.-P. Korb, R.G. Bryant, Changes in protein structure and dynamics as a function of hydration from 1 H second moments, J. Magn. Reson. 189 (2007) 166-172.
[11] H.-J. Wang, A. Kleinhammes, P. Tang, Y. Xu, Y. Wu, Temperature dependence of lysozyme hydration and the role of elastic energy, Phys. Rev. E 83 (2011) 031924.
[12] H.-J. Wang, A. Kleinhammes, P. Tang, Y. Xu, Y. Wu, Critical Role of Water in the Binding of Volatile Anesthetics to Proteins, The Journal of Physical Chemistry B 117 (2013) 12007-12012.
[13] K.A. Majorek, P.J. Porebski, A. Dayal, M.D. Zimmerman, K. Jablonska, A.J. Stewart, M. Chruszcz, W. Minor, Structural and immunologic characterization of bovine, horse, and rabbit serum albumins, Molecular Immunology 52 (2012) 174-182.
[15] G. Careri, E. Gratton, P.-H. Yang, J. Rupley, Correlation of IR spectroscopic, heat capacity, diamagnetic susceptibility and enzymatic measurements on lysozyme powder, Nature 284 (1980) 572-573
[16] Y. Chong, A. Kleinhammes, P. Tang, Y. Xu, Y. Wu, Dominant Alcohol–Protein Interaction via Hydration-Enabled Enthalpy-Driven Binding Mechanism, The Journal of Physical Chemistry B 119 (2015) 5367-5375.
[17] Y. Chong, A. Kleinhammes, Y. Wu, Protein dynamics and thermodynamics crossover at 10° C: Different roles of hydration at hydrophilic and hydrophobic groups, Chem. Phys. Lett. 664 (2016) 108-113.
[18] H. Saito, N. Matubayasi, K. Nishikawa, H. Nagao, Hydration property of globular proteins: An analysis of solvation free energy by energy representation method, Chem. Phys. Lett. 497 (2010) 218-222.
[19] J.H. de Boer, The dynamical character of adsorption, 2nd ed., Clarendon Press, Oxford, 1968.
[20] P.J. Flory, Thermodynamics of high polymer solutions, The Journal of chemical physics 10 (1942) 51.
[21] P.J. Flory, Principles of polymer chemistry, Cornell University Press, 1953.
[22] A. McLaren, J.W. Rowen, Sorption of water vapor by proteins and polymers: a review, Journal of Polymer Science 7 (1951) 289-324.
[23] S.L. Shamblin, B.C. Hancock, G. Zografi, Water vapor sorption by peptides, proteins and their formulations, Eur. J. Pharm. Biopharm. 45 (1998) 239-247.
[24] J. Leeder, I. Watt, The stoichiometry of water sorption by proteins, J. Colloid Interface Sci. 48 (1974) 339-344.
[25] H.R. Costantino, R. Langer, A.M. Klibanov, Moisture-induced aggregation of lyophilized insulin, Pharm. Res. 11 (1994) 21-29.
[26] A. Gorelov, V. Morozov, Mechanical denaturation of globular protein in the solid state, Biophys. Chem. 28 (1987) 199-205.
[27] K. Gekko, Y. Hasegawa, Effect of temperature on the compressibility of native globular proteins, The Journal of Physical Chemistry 93 (1989) 426-429.
[29] E.A.e. Permi︠a︡kov, V.N. Uversky, Methods in Protein Structure and Stability Analysis: Vibrational Spectroscopy, Nova Publishers, 2007.
[30] R.R. Sotelo-Mundo, A.A. Lopez-Zavala, K.D. Garcia-Orozco, A.A. Arvizu-Flores, E.F. Velazquez-Contreras, E.M. Valenzuela-Soto, A. Rojo-Dominguez, M.R. Kanost, The lysozyme from insect (Manduca sexta) is a cold-adapted enzyme, Protein and peptide letters 14 (2007) 774-778.
[31] S. Tsuda, A. Miura, S.M. Gagné, L. Spyracopoulos, B.D. Sykes, Low-Temperature-Induced Structural Changes in the Apo Regulatory Domain of Skeletal Muscle Troponin C†,
Biochemistry 38 (1999) 5693-5700.
[32] H. Kumeta, A. Miura, Y. Kobashigawa, K. Miura, C. Oka, N. Nemoto, K. Nitta, S. Tsuda, Low-temperature-induced structural changes in human lysozyme elucidated by
three-dimensional NMR spectroscopy, Biochemistry 42 (2003) 1209-1216.
[33] T.M. Blumenschein, T.E. Gillis, G.F. Tibbits, B.D. Sykes, Effect of temperature on the structure of trout troponin C, Biochemistry 43 (2004) 4955-4963.
CHAPTER 3
DYNAMICS AND THERMODYNAMICS OF PROTEIN HYDRATION
3.1 Introduction
In CHAPTER 2, I studied the protein-water interaction by measuring water isotherms in proteins at different temperatures. In this chapter, I further investigate the dynamics and
thermodynamics of the protein-water interaction. Extensive work has been done to investigate the mechanism of protein hydration in terms of dynamics [1-4] and thermodynamics [5-8]; however, there remain two problems in these previous studies.
First, the majority of previous work considers the protein hydration shell as a whole [2-4, 9, 10]. However, the surface of the protein is highly heterogeneous [11-15]. It is shown in CHAPTER 2 that water interacts differently with hydrophilic groups and hydrophobic groups on the protein [12, 13, 16, 17]. It is also found that water at hydrophilic and hydrophobic protein groups affect ligand binding in distinct ways [17]. Therefore, a key question is how differently water at hydrophilic and hydrophobic groups affect protein dynamics and thermodynamics.
enzymatic activation [13] and cold denaturation of proteins [18]. However, in many studies where the temperature of the hydrated proteins varied substantially, investigators only focused on the change of water structure with temperature, but ignored the dramatic change in the protein-water interfacial interaction [9, 10, 19-23]. It is sometimes assumed that the hydration effect on protein properties at low temperatures (≤150K) could persist up to room temperature [10, 24, 25]. So far, very few studies have explored the effect of hydration on the changes of protein dynamics and thermodynamics through the crossover region around 10C.
It has been recognized in CHAPTER 2 that water adsorbs on hydrophilic and
hydrophobic groups at different hydration stages [12, 13], hence it is possible to distinguish the effects of water at distinct groups via controlling the protein hydration level. A general procedure of controlling the hydration level in previous work is by weighing the protein with a certain amount of water around room temperature [9, 19-23]. However, although the total amount of hydration remains the same, the mechanism of the protein-water interaction changes as temperature varies. In contrast, here, the hydration level of the protein is controlled in-situ at each individual temperature.
Figure 3.1: Schematic illustration of hydration on the protein surface. Binding of water to hydrophilic groups (convex surface shadowed in red) is insensitive to temperature while water adsorption on hydrophobic groups (concave surface shadowed in gray) depends strongly on temperature. Below 10C, the coupling between water and hydrophobic groups is greatly suppressed.
3.2 Experiments
3.2.1 In-situ NMR Measurement
Two globular proteins, bovine serum albumin (BSA) and hen egg-white lysozyme (HEWL), are used in this chapter. BSA (lyophilized powder, ≥ 98%, pH ≈ 7, 1% in 0.15 M NaCl) and HEWL (catalog no. L-7561, 3x crystallized, dialyzed, and lyophilized) are purchased from Sigma-Aldrich and used without further purification.
protein hydration level h (g water/g protein) is determined by the spectrum intensity [16, 17, 26] and this method has been reported in CHAPTER 2 SECTION 2.2. Water isotherms are measured at 3C, 5C, 16C, and 27C in CHAPTER 2. In this chapter, changes in the Gibbs free energy ΔG, enthalpy ΔH, and entropy TΔS associated with protein hydration are determined from isotherms at 3C, 5C, 16C, and 27C. Protein dynamics on ns and μs timescales are investigated by
measuring the 1H spin-lattice relaxation time in the laboratory frame (T1) and the rotating frame (T1ρ) respectively [2, 27]. Protein dynamics and thermodynamics are studied as a function of hydration level h and temperature. The detailed procedures are discussed in the following sections [26].
Because the dynamic and thermodynamic properties of BSA and lysozyme are very similar in their hydration process, only partial results of BSA are shown in this chapter. The complete results of BSA and the results of lysozyme are shown in Appendix A.
3.2.2 Determination of ∆G, ∆H, and T∆S
The thermodynamic quantities, Gibbs free energy change ΔG, enthalpic change ΔH, and entropic change TΔS associated with the protein hydration process can be determined from the water isotherms at different temperatures [28-31]. ∆G is calculated from the following integral of the isotherms:
0
xn
G RT dx
x
(3.1)where 𝑛 (mol water/mol protein) is the amount of sorption as a function of the relative pressure 𝑥 = 𝑃/𝑃0, where P0 is the saturated vapor pressure. ∆𝐺 is expressed in units of kJ/mol. Values of ∆𝐺 at different temperatures and vapor pressures can be obtained from the measured isotherm
2
( G)x
H T
T T
(3.2) which is derived from the Gibbs–Helmholtz equation. If ∆𝐺(𝑇, 𝑥) at two different temperatures
Ti and Tf is known, then
(T , x) (T , x) 1 1
( )( )
f i
f i f i
G G
H x
T T T T
(3.3)
where ∆𝐺(𝑇𝑖, 𝑥) and ∆𝐺(𝑇𝑓, 𝑥) represent the Gibbs free energy change at a fixed relative pressure 𝑥 and at temperature Ti and Tf, respectively. Here, ∆𝐻(𝑥) is the enthalpy change at fixed relative pressure 𝑥 and at an average temperature T, which is given by
1 1 1 1
( )
2 i f
T T T (3.4)
Hence, water isotherms at 3C and 16C can be used to calculate ΔG at ~9 C; water isotherms at 16C and 27C can be used to calculate ΔG at ~21 C. Similarly, the entropy change is calculated from
( G)x
S
T
(3.5) Again, if ∆𝐺(𝑇, 𝑥) at two different temperatures Ti and Tf are known from isotherm
measurements, we can calculate ∆𝑆(𝑇, 𝑥) as
(T , x) (T , x)
( , ) i f
f i
G G
S T x
T T
(3.6)
This is the estimated entropy change at an average temperature T given by Equation (3.4). For comparison of ∆𝐺 with ∆𝐻 and 𝑇∆𝑆 at the same temperature, ∆𝐺 at the average temperature T
can be obtained by
(T , x) (T , x)
( , ) 1
( ) 2 f i i f G G
G T x
T T T
NMR signals are measured five times at each water vapor pressure and the standard deviations of NMR peak areas are used to calculate the error bars in water isotherms in CHAPTER 2. Here, those errors are further propagated to calculate the error bars in graphs of ΔG, ΔH, and TΔS. Details of the instrument and the procedure have been reported previously [16, 17, 26].
3.2.3 NMR T1 Relaxation Measurement
The conventional saturation recovery sequence introduced in CHAPTER 1 is used to measure T1. Proton T1 relaxation of a hydrated protein is governed by two mechanisms. One is the intrinsic motions of the protein and water molecules, and the other is the fast proton
exchange between the protein and water [32-39]. In order to separate these two mechanisms, we employ the two-pool proton exchange model [34-36, 39, 40]. To be specific, as shown in Figure 3.2 (B), the reduced magnetization of the protein mp(t) and water mw(t) are plotted versus the decay time t. mp(t) and mw(t) are defined as:
( )
( ) op p
p
op
M M t
m t
M
(3.8)
( )
( ) ow w
w
ow
M M t
m t
M
(3.9)
where Mp(t) and Mw(t) are the magnetization of the protein and water at time t, which can be represented by the area of the broad peak and the sharp peak in Figure 3.2 (A);
( )
op p


![Figure 2.4: Water isotherms on lysozyme measured 27 C (red triangles, this work), 35 C (magenta squares, from reference [23, 24]) , and 50 C (green circles, reference )](https://thumb-us.123doks.com/thumbv2/123dok_us/8272166.2190944/43.918.239.664.279.610/figure-isotherms-lysozyme-measured-triangles-magenta-reference-reference.webp)
![Figure 2.5: Elastic modulus of lysozyme versus temperature. Below 10 C, the elastic modulus of the protein significantly increases with decreasing temperature [11, 26]](https://thumb-us.123doks.com/thumbv2/123dok_us/8272166.2190944/45.918.262.661.413.735/figure-elastic-lysozyme-temperature-significantly-increases-decreasing-temperature.webp)

