BUREAU OF
PRISONS
Growing Inmate
Crowding Negatively
Affects Inmates, Staff,
and Infrastructure
Why GAO Did This Study
BOP operates 117 federal prisons to house approximately 178,000 federal offenders, and contracts with private companies and some stategovernments to house about another 40,000 inmates. BOP calculates the number of prisoners that each BOP-run institution can house safely and securely (i.e., rated capacity). GAO was asked to address (1) the growth in BOP’s population from fiscal years 2006 through 2011 and BOP’s projections for inmate population and capacity; (2) the effects of a growing federal prison population on operations within BOP facilities, and the extent to which BOP has taken actions to mitigate these effects; and (3) actions selected states have taken to reduce their prison populations, and the extent to which BOP has implemented similar initiatives.
GAO analyzed BOP’s inmate
population data from fiscal years 2006 through 2011, BOP’s 2020 long-range capacity plan, and BOP policies and statutory authority. GAO visited five federal prisons chosen on the basis of geographic dispersion and varying security levels. The results are not generalizable, but provide information on the effects of a growing prison population. GAO selected five states based on actions they took to mitigate the effects of their growing prison populations—and assessed the extent to which their actions would be possible for BOP. GAO makes no recommendations in this report. BOP provided technical clarifications, which GAO incorporated where appropriate.
What GAO Found
The Department of Justice’s Bureau of Prisons’ (BOP) 9.5 percent population growth from fiscal years 2006 through 2011 exceeded the 7 percent increase in its rated capacity, and BOP projects continued population growth. Growth was most concentrated among male inmates, and in 2011, 48 percent of the inmates BOP housed were sentenced for drugs. From fiscal years 2006 through 2011, BOP increased its rated capacity by about 8,300 beds as a result of opening 5 new facilities and closing 4 minimum security camps, but because of the population expansion, crowding (or population in excess of rated capacity) increased from 36 to 39 percent. In 2011 crowding was most severe (55 percent) in highest security facilities. BOP’s 2020 long-range capacity plan projects continued growth in the federal prison population from fiscal years 2012 through 2020, with systemwide crowding exceeding 45 percent through 2018.
According to BOP, the growth in the federal inmate population has negatively affected inmates, staff, and infrastructure, but BOP has acted within its authority to help mitigate the effects of this growth. BOP officials reported increased use of double and triple bunking, waiting lists for education and drug treatment
programs, limited meaningful work opportunities, and increased inmate-to-staff ratios. These factors, taken together, contribute to increased inmate misconduct, which negatively affects the safety and security of inmates and staff. BOP officials and union representatives voiced concerns about a serious incident occurring. To manage its growing population, BOP staggers meal times and segregates inmates involved in disciplinary infractions, among other things. The five states in GAO’s review have taken more actions than BOP to reduce their prison populations, because these states have legislative authority that BOP does not have. These states have modified criminal statutes and sentencing, relocated inmates to local facilities, and provided inmates with additional
opportunities for early release. BOP generally does not have similar authority.For example, BOP cannot shorten an inmate’s sentence or transfer inmates to local prisons. Efforts to address the crowding issue could include (1) reducing the inmate population by actions such as reforming sentencing laws, (2) increasing capacity by actions such as constructing new prisons, or (3) some combination of both.
A Triple-Bunked Cell in a BOP Facility
Letter 1
Background 6
BOP’s Population Grew More than Systemwide Capacity, and BOP
Projects Continued Population Growth through 2020 12 BOP’s Population Growth Has Negatively Affected Inmates, Staff,
and Infrastructure, but BOP Has Acted to Help Mitigate These
Effects 18
States Have Taken Broader Actions Intended to Reduce Prison
Populations than Those Taken at the Federal Level 32
Concluding Observations 39
Agency Comments 41
Appendix I Objectives, Scope, and Methodology 42
Appendix II BOP’s Population Growth 48
Appendix III Effects of a Growing Inmate Population 64
Appendix IV GAO Contact and Staff Acknowledgments 84
Related GAO Products 85
Tables
Table 1: Site Visits to BOP Facilities 44
Table 2: Site Visits to State Correctional Facilities 47 Table 3: Offense Composition of the Inmate Population in BOP
Facilities, by Year, from Fiscal Years 2006 through 2011 50 Table 4: Offense Composition of the Non-U.S. Citizen Inmate
Population in BOP Facilities from Fiscal Years 2006
through 2011 51
Table 5: BOP’s Rated Capacity and Crowding, by Facility Security
Table 6: BOP Population, Rated Capacity, and Percentage
Crowding from Fiscal Years 2006 through 2011 55 Table 7: BOP Projected Population, Rated Capacity, and
Percentage Crowding from Fiscal Years 2012 through 2020 60 Table 8: Rated Capacity and Temporary Bed Space by Institutional
Security Level From Fiscal Years 2006 through 2011 65 Table 9: Rated Capacity and Temporary Bed Space of Selected
BOP Facilities from Fiscal Years 2006 through 2011 66 Table 10: Systemwide Inmate Participation Rates in Selected BOP
Programs in September 2011 69
Table 11: BOP’s Drug Education Programs in Male Facilities: Inmate Participation Levels, Waiting List Numbers, and Average Waiting Time, by Institutional Security Level from
the End of Fiscal Years 2006 through 2011 71
Table 12: BOP’s Nonresidential Drug Treatment Programs in Male Facilities: Inmate Participation Levels, Waiting List Numbers, and Average Waiting Time, by Institutional Security Level from the End of Fiscal Years 2006
through 2011 72
Table 13: BOP’s Residential Drug Abuse Programs in Male Facilities: Inmate Participation Levels, Waiting List Numbers, and Average Waiting Time, by Institutional Security Level from the End of Fiscal Years 2006
through 2011 73
Table 14: BOP Inmate to Total BOP Staff Ratios from Fiscal Years
1997 through 2011 78
Table15: BOP’s Inmate to Total Institutional Staff Ratios from
Fiscal Years 2006 through 2011 79
Table 16: Snapshots of BOP’s Inmate to Correctional Officer Ratios, by BOP Region, from Fiscal Years 2006
through 2011 80
Table 17: Guilty Findings for Prohibited Acts by Severity Level,
Fiscal Years 2006 through 2011 83
Figures
Figure 1: Illustration of a 20-Cell Medium Security Facility with 45 Inmates and 50 Percent Crowding and a 20-Cell High Security Facility with 39 Inmates and 56 Percent
Figure 2: BOP Systemwide Population, Rated Capacity, and Percentage Crowding from Fiscal Years 2006 through
2011 15 Figure 3: Examples of BOP’s Use of Temporary Bed Space 19 Figure 4: Percentage Crowding in Male Long-Term Facilities from
Fiscal Years 2006 through 2011 by Institutional Security
Level 53 Figure 5: BOP’s Projections for Population, Rated Capacity, and
Percentage Crowding from Fiscal Years 2012 through
2020 57 Figure 6: Projected Percentage Crowding in Male Long-Term
Facilities from Fiscal Years 2012 through 2020 by
Abbreviations
ACA American Correctional Association ADP average daily population
ADX Administrative Maximum BOP Bureau of Prisons
DHO disciplinary hearing officer DOJ Department of Justice
ESL English as a Second Language GED General Educational Development
IG Inspector General
NIC National Institute of Corrections OMB Office of Management and Budget PHS Public Health Service
RDAP Residential Drug Abuse Program
RICO Racketeer Influenced and Corrupt Organizations Act RRC Residential Reentry Center
S&E Salaries and Expenses UDC Unit Discipline Committee
This is a work of the U.S. government and is not subject to copyright protection in the United States. The published product may be reproduced and distributed in its entirety without further permission from GAO. However, because this work may contain copyrighted images or other material, permission from the copyright holder may be necessary if you wish to reproduce this material separately.
September 12, 2012
The Honorable Elijah E. Cummings Ranking Member
Committee on Oversight and Government Reform House of Representatives The Honorable Robert C. Scott Ranking Member
Subcommittee on Crime, Terrorism, and Homeland Security
Committee on the Judiciary House of Representatives
As of December 2010, federal and state correctional facilities incarcerated more than 1.6 million persons (about 1 in 200 U.S. residents), according to the most recently available data from the U.S. Department of Justice (DOJ).1 At the federal level, DOJ’s Bureau of
Prisons (BOP) is responsible for approximately 218,000 of these inmates, with a fiscal year 2012 operating budget of about $6.6 billion—the second largest budget within DOJ.2 BOP’s population has increased by more
than 400 percent since the late 1980s, and by about 50 percent since 2000. According to BOP, this growth is primarily attributed to an increase in inmates’ sentence length over time.3
1See Department of Justice, Bureau of Justice Statistics, Prisoners in 2010 (Washington,
D.C.: December 2011). The Bureau of Justice Statistics is the statistical agency of DOJ. At the end of fiscal year 2011, BOP housed nearly 178,000 inmates in the 117 institutions that it owns
2The Federal Bureau of Investigation has the largest budget within DOJ at $8 billion.
BOP’s $6.6 billion includes $6.551 billion for salaries and expenses and $90 million for buildings and facilities.
3The Sentencing Reform Act of 1984, Pub. L. No 98-473, 98 Stat. 1987, changed the
federal sentencing structure. The act was effective for offenses committed on or after November 1, 1987. The act abolished parole, and subsequent legislation established mandatory minimum sentences for many federal offenses, which limits the authority that BOP has to affect the length of the sentence or the size of the inmate population.
and operates, and it contracted with other correctional facilities, such as those of states and private companies, to house nearly 40,000 inmates.4
BOP calculates the number of prisoners a given prison facility is built to house safely and securely and calls this its rated capacity.5 Crowding, as
defined by BOP, is the extent to which a facility’s inmate population level exceeds its rated capacity.6 Systemwide, BOP prisons exceed their rated
capacity by 39 percent, and crowding has been a significant ongoing concern. Assessments conducted through the Federal Managers’ Financial Integrity Act have identified prison crowding as a material weakness since 2006.7 Further, since that same year, DOJ’s Inspector
General (IG) has included detention and incarceration among DOJ’s top 10 management and performance challenges departmentwide. In its 2011 list of challenges, the IG noted its concerns regarding the impact of
federal prison crowding and the related stresses on BOP’s prison staffing regarding BOP’s ability to safely manage the increasing federal inmate population.8
While federal inmate population growth has been steady, the overall growth of the state inmate population began to decline in 2009. DOJ reports that the overall state prison population increased from calendar
The Attorney General has reported both of these findings annually in his performance and accountability report for the department.
4BOP has established performance-based contracts with four private corrections
companies. The private prisons in which BOP houses federal inmates operate in accordance with BOP policies.
5Rated capacity is the maximum population level at which an institution can make
available basic necessities, essential services (e.g., medical care), and programs (e.g., drug treatment, basic education, and vocational education). According to BOP officials, by contract with BOP, privately run prisons cannot exceed 15 percent overcapacity. BOP also has agreements with state and local governments and contracts with privately operated facilities for the detention of federally adjudicated juveniles and for the secure detention of some short-term federal inmates.
6Unless noted otherwise, the term “crowding” in this report refers to BOP’s definition. 7The Federal Managers’ Financial Integrity Act, Pub. L. No. 97-255, 96 Stat. 814 (1982),
assessment process evaluates the effectiveness of internal controls to support effective and efficient program operations, reliable financial reporting, compliance with applicable laws and regulations, and whether financial management systems conform to financial system requirements.
8Since 1998, the IG has prepared lists of top management challenges for the department.
By statute, the Attorney General is required to include each year’s list in the annual performance and accountability report.
years 1977 through 2008, with the first decline of 0.2 percent (2,857 prisoners) occurring in 2009. DOJ reported a second-year decline in 2010 of 0.8 percent (10,881 prisoners), with 25 states reporting decreases in their prison populations.9 While not all states experienced reductions in
their prison populations, in those states that did, changes in those states’ policies and practices are potential contributing factors to this decline. According to a 2008 study by the Pew Center on the States, a state may reduce its prison population growth while protecting public safety by (1) diverting a greater number of low-risk offenders from prison, (2) reducing the time that low-risk offenders are in prison, or (3) a combination of these approaches.10 In contrast to the prison populations of the states, the
federal prison population has continued to grow. BOP is required by statute to provide for suitable housing and the safekeeping, care, and subsistence of all persons charged with or convicted of offenses against the United States.11
We have previously reported on BOP’s population projections, the security and safety of inmates and staff, and inmate programs.
Thus, while the size of a prison population is, in part, a function of crime rates, sentencing laws, and law enforcement policies, these factors are all beyond BOP’s control. BOP’s population is expected to continually increase, given current incarceration rates, and safety and security concerns will remain paramount.
12 For
example, in November 2009, having assessed how BOP developed its population projections and compared its projections with its actual inmate population growth from fiscal years 1999 through August 20, 2009, we concluded that BOP’s projections were accurate, on average, to within 1 percent of the actual inmate population growth during this time period.13
9See Department of Justice, Bureau of Justice Statistics, Prisoners in 2010 (Washington,
D.C.: December 2011), and Prisoners in 2009 (Washington, D.C.: December 2010). In February 2012, we reported on BOP’s use of its discretionary authority
10The Pew Center on the States, One in 100: Behind Bars in America 2008 (Washington,
D.C.: February 2008). The Pew Center on the States provides nonpartisan reporting and research, advocacy, and technical assistance to help states deliver better results. Among the issues it addresses are heath, the economy, revenue and spending, and public safety.
1118 U.S.C. § 4042(a)(2).
12See Related GAO Products at the end of this report.
13GAO, Bureau of Prisons: Methods for Cost Estimation Largely Reflect Best Practices but
Quantifying Risks Would Enhance Decision Making Nov.10, 2009).
to reduce a prisoner’s period of incarceration.14
You asked us to review the impact of crowding in BOP facilities and any related lessons that BOP can learn from selected states. Specifically, this report addresses the following questions:
We recommended that BOP establish a plan, including time frames and milestones, for requiring contractors to submit separate prices of beds in residential reentry centers—also known as halfway houses—and home detention services. BOP concurred and has actions under way to address the
recommendation.
1. What was the growth in BOP’s population from fiscal years 2006 through 2011, and what are BOP’s projections for inmate population and capacity?
2. What is known about the effects of a growing federal prison
population on operations (i.e., inmates, staff, and infrastructure) within BOP facilities, and to what extent has BOP taken actions to mitigate these effects?
3. What actions have selected states taken to reduce their prison populations, and to what extent has BOP implemented similar initiatives?
To address the first question, we analyzed policies and procedures that may affect the increased federal prison population (e.g., BOP’s inmate classification policy) and BOP’s statutory authority affecting its capacity and conditions of confinement. We also analyzed BOP’s inmate
population data and crowding percentages by institutional security level from fiscal years 2006 through 2011 and BOP’s 2020 long-range capacity plan, which was issued in January 2012. We assessed the reliability of BOP’s inmate population and crowding data by reviewing relevant documentation, interviewing knowledgeable agency officials about how they maintain the integrity of their data, and updating previous
assessments that we did for previously issued reports. We found BOP’s inmate population and crowding data to be sufficiently reliable for the
14For GAO reports on federal prisons, see, for example: GAO, Bureau of Prisons:
Eligibility and Capacity Impact Use of Flexibilities to Reduce Inmates’ Time in Prison,
purposes of this report. We also interviewed BOP headquarters officials to discuss how BOP’s population has grown.
To address the second question, we analyzed BOP’s statutory authority, policies, and procedures pertinent to the effects of the growing population on operations in BOP facilities (i.e., effects on inmates, staff, and
infrastructure) and BOP’s ability to mitigate the effects of a growing population. We also analyzed BOP studies on the effects of population growth and prison crowding on BOP operations, as well as BOP data from fiscal years 2006 through 2011 on available bed space, inmate program participation and waiting lists, inmate-to-staff ratios, and
available infrastructure costs. We also present systemwide BOP staffing ratios from fiscal years 1997 through 2011 because officials believed that presenting the ratios for a longer period better illustrates the effect of BOP’s population growth relative to the number of staff.15 We assessed
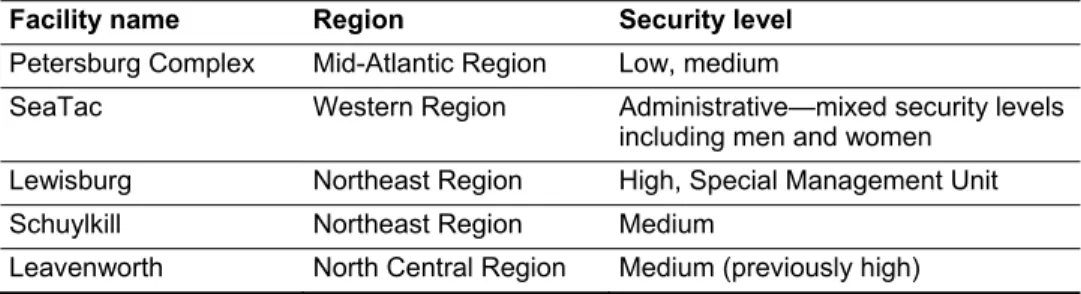
the reliability of BOP’s inmate, staff, and infrastructure data by interviewing knowledgeable agency officials to determine how BOP collects and maintains the integrity of these data. We found these data to be sufficiently reliable for the purposes of this report. We visited 5 of BOP’s 117 prisons that are located in four of BOP’s six regions, which we chose on the basis of varying security levels and to ensure geographic dispersion.16
To also address the second as well as the third question, we compared and contrasted BOP’s actions to mitigate the effects of its increased population and attempt to reduce its prison population with similar actions taken by five selected states––Kansas, Mississippi, New York, Ohio, and Wisconsin––that had experienced prison population growth and had
Because we did not randomly select the prisons we visited, our results are not generalizable to all BOP prisons; however, they provided important insights into BOP’s operations. We interviewed BOP headquarters officials and all six regional directors. Further, we discussed the effects of BOP’s population growth on correctional staff with officials from the Council of Prison Locals, the union that represents all
nonmanagement staff working in BOP facilities.
15According to BOP officials, BOP also includes this information in its annual
congressional budget request.
16We selected five federal prisons of different security levels, including one that was a
complex and on whose grounds there was a low and a medium security facility. Thus, our five selected sites included six BOP facilities––one low, three medium, one high, and one administrative. We describe the distinctions among security levels later in this report.
taken actions to mitigate its effects or reduce their prison populations. To select the states, among other things, we reviewed the Bureau of Justice Statistics’s (BJS) report on state prison inmate populations in 2010.17
We conducted this performance audit from September 2011 to September 2012 in accordance with generally accepted government auditing standards. Those standards require that we plan and perform the audit to obtain sufficient, appropriate evidence to provide a reasonable basis for our findings and conclusions based on our audit objectives. We believe that the evidence obtained provides a reasonable basis for our findings and conclusions based on our audit objectives.
We also reviewed relevant reports on actions that states have taken to
mitigate the effects of their prison population growth, published from 2006 through 2011 (e.g., those from the Pew Center on the States). Further, we assessed the extent to which actions in these selected states would be possible for BOP to undertake within its statutory authority. We also conducted site visits to three facilities in two of these five states. Dissimilarities between federal and state prison systems—legally, structurally, and in how crowding calculations are determined––limit the comparability between federal and state correctional systems, but we mitigated this limitation by the criteria we used to select the states in our sample (e.g., size of the prison population and diverse approaches to addressing increased prison populations). We are unable to generalize about the types of actions states have taken to mitigate the effects of state prison population growth or reduce their prison populations, but the information we obtained provides examples of state responses to prison population growth. Appendix I includes more details about our scope and methodology.
There are specific state and federal laws that define, prohibit, and penalize criminal behavior. Various factors, such as the nature and type of the crime committed and the relevant law, may determine whether the state or federal justice system is responsible for the prosecution,
sentencing, and incarceration of an individual accused and found guilty of a crime. State and federal laws also define the potential sentences for those crimes to be imposed by judges and methods for reducing the period of incarceration, such as parole, probation, or good conduct time
17See BJS, Prisoners in 2010 (Washington, D.C.: Dec. 2011).
credit. These laws and policies affect the growth of their respective prison populations and the level of crowding in state and federal prison
populations.
To carry out its responsibility for the custody and care of federal offenders, BOP currently houses inmates across six geographic regions in 117 federal institutions, 15 privately managed prisons, 185 residential reentry centers, and home detention.18 BOP’s central office consists of eight divisions that
provide oversight of major BOP program areas and operations, such as correctional programs and health services, as well as the National Institute of Corrections (NIC).19
BOP has six regional offices, each led by a regional
director, covering the
BOP generally houses sentenced inmates in its long-term institutions. Male long-term institutions include four security level designations–– minimum, low, medium, and high––and female institutions include three security designations––minimum, secure, and high.20 The security level
designation of a facility depends on the level of security and staff
supervision that the institution is able to provide, such as the presence of security towers; perimeter barriers; the type of inmate housing, including dormitory, cubicle, or cell-type housing; and inmate-to-staff ratio.
Additionally, BOP designates some of its institutions as administrative institutions, which specifically serve inmates awaiting trial, or those with intensive medical or mental health conditions, regardless of the level of supervision these inmates require.21
18According to BOP officials, privately managed contract facilities are low security and
primarily house non-U.S. citizens convicted of crimes while in this country legally or illegally. Home detention describes all circumstances under which an inmate is serving a portion of his or her sentence while residing in his or her home.
From fiscal years 2006 through
19NIC, a component of BOP, provides training, technical assistance, information services,
and policy/program development assistance to federal, state, and local corrections agencies.
20In this report, data presented by institutional security level include information for male
inmates by the four security levels and for females by the three security levels. Unless noted, these data do not include information on detention, medical, administrative, or Witness Security Program housing.
21The Administrative Maximum (ADX) facility in Florence, Colorado, houses offenders
requiring the tightest controls.
2011, the distribution of facilities by security designation remained
relatively constant. In fiscal year 2011, there were 7 stand-alone minimum security camps, 29 low security facilities, 46 medium security facilities, 16 high security facilities, and 19 administrative facilities.22
BOP establishes a rated capacity for each of the facilities that it owns and operates.23 A facility’s rated capacity reflects the number of prisoners that
it was designed to house safely and securely and in which BOP can provide inmates adequate access to services, necessities for daily living, and programs designed to support their crime-free return to the
community.24 In determining a facility’s rated capacity, BOP considers
American Correctional Association (ACA) occupancy and space requirements.25
22BOP has 7 stand-alone minimum security camps that are not colocated with higher
security level facilities. BOP also has 73 minimum security satellite camps that are colocated with a secure institution or complex. Stand-alone camps usually have a rated capacity of 256 inmates, and colocated camps usually have a rated capacity of 128 inmates. Female secure facilities are included in the low security level facility figure.
Since 1990, ACA has required 35 square feet of unencumbered space per inmate to ensure that each inmate has
sufficient movement or exercise space within the inmate’s personal living space, whether in a cell, room, or open dormitory. In essence, rated capacity is the measure of inmate housing space and, therefore, does not include housing used for medical and special housing purposes (e.g., disciplinary segregation and administrative detention space). BOP also does not include in its rated capacity additional beds placed in areas such as a facility’s halls, gyms, mezzanines, or television rooms to address crowding. BOP excludes this use of space from its rated capacity calculation because it considers these beds to be temporarily converted housing space that is to be restored to its original purpose when
circumstances permit. Further, for such temporary space to become permanent space and thus included in a facility’s rated capacity, the
23BOP does not include privately contracted beds as part of its systemwide rated capacity,
because the capacity of each of these facilities is based on its contract.
24Basic necessities include safety, living space, and access to toilets, showers, and food.
Essential services include medical care, visitation, and telephones to allow contact with family and other members of the community. Programs include drug treatment, work, education, vocational training, anger management, and parenting to prevent idleness and enable inmates to develop skills needed to return to the community following release.
25ACA’s mission includes the development and promotion of effective standards for the
care, custody, training, and treatment of offenders. Rated capacity reflects the number of
prisoners that the institution was built to house safely and securely.
Crowding in BOP’s facilities is the extent to which a prison’s inmate population exceeds the institution’s rated capacity.
facility would require infrastructure changes, such as additional toilet or shower facilities, to meet ACA standards.
According to BOP, rated capacity is the basis for measuring prison crowding and is essential to both managing the inmate population and BOP’s budget justifications for capital resources. BOP’s formula for calculating rated capacity has changed over time. Until 1991, the rated capacity of a facility was equivalent to the total number of cells, because the rated capacity was based on one inmate being housed in each cell. As a result of the growth in BOP’s population during the 1980s, BOP began to double-bunk (i.e., house two inmates in each cell) in many of its facilities, particularly those at the lower security levels. In 1991, BOP established a new rated capacity formula that allowed for stratified
bunking across all security levels. BOP’s current rated capacity guidelines account for
• 25 percent double bunking and 75 percent single bunking of cells
within high security facilities,
• 50 percent double bunking and 50 percent single bunking of cells
within medium security facilities, and
• 100 percent double bunking of cells in low and minimum security
facilities.
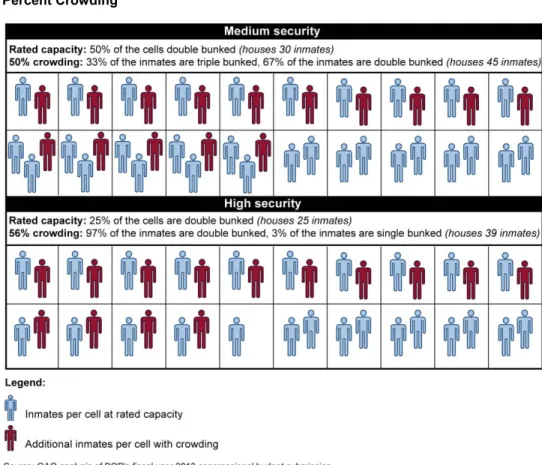
By way of illustration, figure 1 shows crowding in a medium security facility and a high security facility, each with 20 cells. The rated capacity of the medium security facility, which includes 50 percent double bunking, is 30 beds. With a population of 45 inmates, 67 percent of the inmates are double bunked, 33 percent are triple bunked, and the facility’s percentage crowding is 50 percent. The rated capacity of the high security facility, which includes 25 percent double bunking, is 25 beds. With a population of 39 inmates, 97 percent of the inmates are double bunked, 3 percent are single bunked, and the facility’s percentage crowding is 56 percent.
Figure 1: Illustration of a 20-Cell Medium Security Facility with 45 Inmates and 50 Percent Crowding and a 20-Cell High Security Facility with 39 Inmates and 56 Percent Crowding
BOP initially classifies an inmate to a particular institution based on
• the level of security and supervision the inmate requires;
• the level of security and staff supervision the institution is able to
• the inmate’s program needs, such as residential drug treatment or
intensive medical care;26
• where the inmate resides when sentenced; • the level of crowding in an institution; and
• any additional security measures to ensure the protection of victims,
witnesses, and the public.
In most cases, BOP’s Designation and Sentence Computation Center staff calculates a point score for the inmate and then matches the inmate with a commensurate security level institution.27
As of December 31, 2011, BOP had a total staff of about 38,000,
including correctional officers28 and administrative, program, and support
personnel responsible for all of BOP’s activities nationwide.29 BOP’s
philosophy is that all employees are correctional workers first, whether or not they serve as correctional officers. Accordingly, BOP trains all
employees in basic correctional duties to secure the facility in the event of a disturbance and to provide inmate supervision. BOP also requires them to participate in annual refresher training.30
26For prior work related to BOP’s implementation of Second Chance Act provisions, which
affect programming needs related to preparing inmates for eventual reentry into society, see GAO, Federal Bureau of Prisons: BOP Has Mechanisms in Place to Address Most Second Chance Act Requirements and Is Working to Implement an Initiative Designed to Reduce Recidivism
When circumstances warrant, a warden will require program and administrative staff members to serve in the capacity of a correctional officer––a practice that BOP calls
augmentation. For example, under augmentation, a vocational education teacher or a psychologist may provide escort services for an inmate
27S
28Correctional officers enforce the regulations governing the operation of a correctional
institution, serving as both supervisors and counselors of inmates.
29These staff included all staff on-board funded under BOP’s appropriation for Salaries
and Expenses (i.e., headquarters, regional, institutional, and Public Health Service staff), as well as Buildings and Facilities, Commissary, and Federal Prison Industries staff.
30See GAO, Bureau of Prisons: Evaluating the Impact of Protective Equipment Could Help
leaving the facility for specialized medical care or provide ancillary supervision in a recreational yard.
Selected state departments of corrections included in our review share similarities and exhibit differences with BOP. For example, both state departments of corrections and BOP are required to house, clothe, and feed inmates in a safe and secure setting, but selected states determine rated capacity and measure crowding differently. Several of the selected state departments of corrections’ methods are different from BOP’s methods. For example, New York calculates rated capacity using
standards set forth by the New York State Commission of Correction and by subtracting temporary beds from the number of general population beds. In contrast, Wisconsin does not calculate rated capacity but instead uses design capacity and operational capacity.31 Furthermore, differences
in state and federal authorities affect the types of actions that are taken to mitigate the effects of crowding. For example, state departments of corrections may have been granted certain state statutory authorities that are not currently available at the federal level (i.e., states may transfer inmates to county and local jails, but BOP does not have this option).
From fiscal years 2006 through 2011, the inmate population in BOP-run facilities grew 9.5 percent, while capacity grew less than 7 percent. As a result, BOP’s overall crowding increased during this period from 36 percent to 39 percent. BOP projects an additional 15 percent increase in its inmate population by 2020.
31Design capacity is the number of inmates that planners intended for a facility.
Operational capacity is the number of inmates that can be accommodated based on a facility’s staff, existing programs, and services.
State Prison Systems
BOP’s Population
Grew More than
Systemwide Capacity,
and BOP Projects
Continued Population
Growth through 2020
The inmate population housed in BOP-run facilities steadily increased from 162,514 to 177,934 inmates—or 9.5 percent—from fiscal years 2006 through 2011.32
• The number of male inmates housed in BOP institutions increased
about 10 percent (151,003 to 165,595).
A variety of factors contribute to the size of BOP’s
population. These include national crime levels, law enforcement policies, and federal sentencing laws, all of which are beyond BOP’s control. During the 6-year period, growth occurred in BOP’s male, female, and both its U.S. citizen and non-U.S. citizen populations. Specifically,
• The number of female inmates housed in BOP institutions increased
about 7 percent (11,511 to 12,339).
• The relative proportion of non-U.S. citizen to U.S. citizen inmates
housed in BOP facilities remained constant (about 26 percent), although the approximately 16 percent (46,369 to 53,733) growth in the noncitizen inmate population surpassed the approximate 13 percent growth in the U.S. citizen inmate population (135,074 to 152,581).33
• Non-U.S. citizen inmates are housed in BOP-run low, medium,
and high security level facilities, as well as in private contract facilities.34
• The largest number of these inmates are housed in low security
facilities.
32These data include only those U.S. inmates housed in BOP-run facilities, not privately
contracted facilities.
33These data include only those U.S. citizen or non-U.S. citizen inmates housed in
BOP-run facilities. The total number of non-U.S. citizen inmates, including those housed in BOP-run and private contract facilities, increased about 13 percent (50,275 to 56,933) from fiscal years 2006 through 2011, and constituted about 26 percent of the total BOP population during this time period.
34BOP does not send non-U.S. citizen inmates to minimum security facilities because of
their risk of flight.
BOP’s Population Grew
Steadily because of a
Variety of Factors
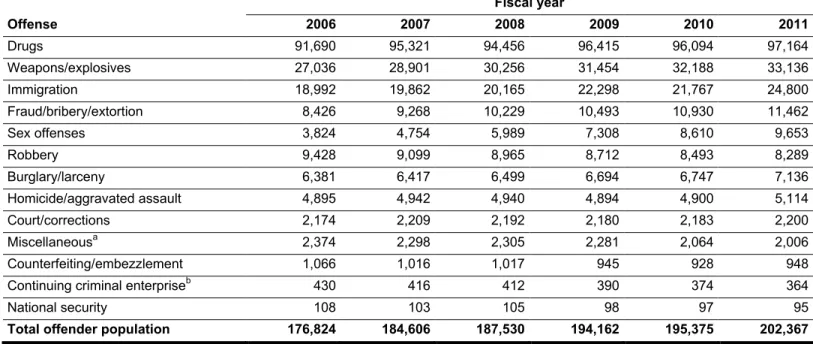
• Drug, weapons/explosives, and immigration offenses constituted the
largest number of offenses for which all BOP inmates were incarcerated in each year from fiscal years 2006 through 2011.35
• 48 percent of the inmates BOP housed were serving sentences
for drugs,
Specifically, in fiscal year 2011,
• 16 percent for weapons/explosives, and • 12 percent for immigration.
Appendix II provides additional information on the growth of the federal inmate population from fiscal years 2006 through 2011 and the other offense categories for which BOP inmates have been sentenced.
BOP’s 9.5 percent population growth from fiscal years 2006 through 2011 among inmates housed in BOP facilities exceeded the increase in its rated capacity, which grew less than 7 percent (from 119,510 beds to 127,795). BOP’s rated capacity during this 6-year period grew because it opened five new facilities and closed four stand-alone minimum security camps, which BOP officials told us were less efficient to operate. As shown in figure 2, however, because the inmate population in BOP-run facilities grew at a faster rate than the growth in rated capacity, crowding in BOP-run institutions increased from 36 to 39 percent systemwide.
35BOP officials explained that for reporting purposes, they categorize inmates according to
the offense for which an inmate is serving the longest sentence (dominant sentence offense). For example, an inmate may be serving sentences for both drug and immigration offenses, but BOP will categorize the inmate by the offense having the longer sentence (e.g., the drug offense).
Rated Capacity Grew Less
than 7 Percent,
Figure 2: BOP Systemwide Population, Rated Capacity, and Percentage Crowding from Fiscal Years 2006 through 2011
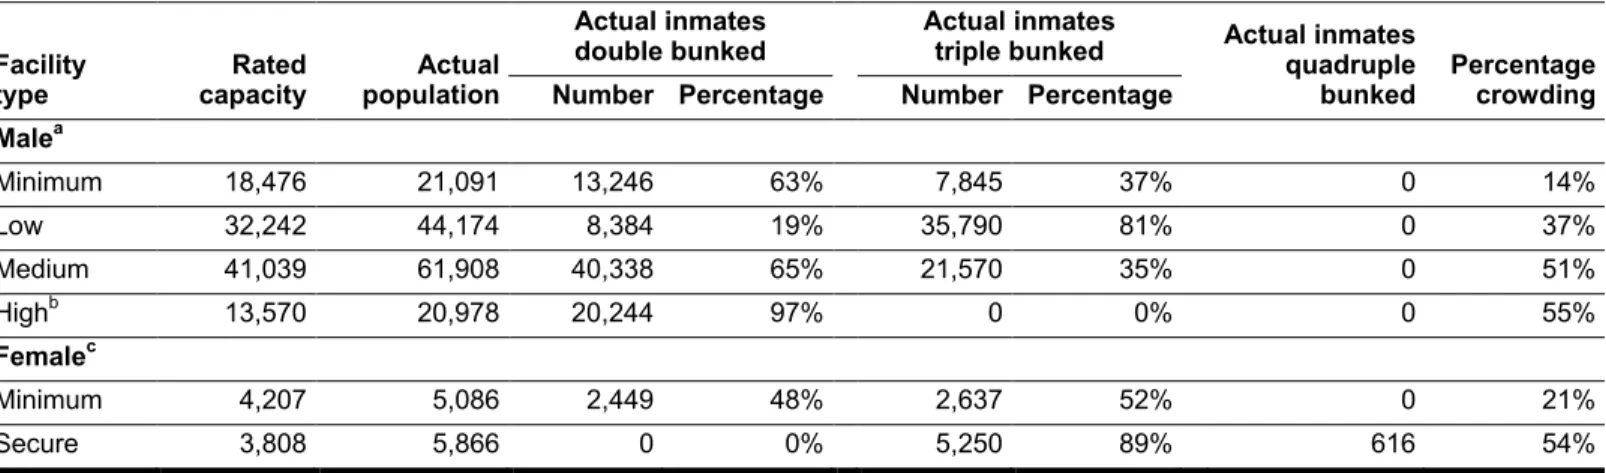
From fiscal years 2006 through 2011, the percentage crowding in male medium security facilities increased from 37 percent to 51 percent and from 53 percent to 55 percent in high security level facilities. Table 5 in appendix II illustrates the range of crowding across BOP institutions of different security levels as of December 2011, and the double, triple, and quadruple bunking that has resulted. For example, the population in BOP’s high security population was about 21,000 in December 2011—or about 7,000 more than its rated capacity—resulting in 97 percent double bunking and a 55 percentage crowding.
According to BOP, BOP’s ability to increase rated capacity is directly affected by funding appropriated for new prison construction and to support contracts with private prison providers for additional inmate bed space. In fiscal year 2005, the Office of Management and Budget (OMB) placed a moratorium on all new BOP prison construction. To address BOP’s bed space needs, OMB focused on contracting with private
prisons. BOP officials stated that, because of this moratorium, the yearly presidential budget submissions for BOP’s Buildings and Facilities account for each of fiscal years 2006 through 2011 did not include
requests to begin construction on any new facilities. Instead, the Buildings and Facilities requests included what BOP considers to be baseline funding36 for ongoing expenses, which were generally about $25 million
during each of the 6 fiscal years in this period.37 Congress, however,
provided about $1.1 billion specifically to aid in the site selection, design, and construction of new BOP facilities—in addition to funding the baseline that BOP requested. According to BOP officials, the time from receiving the funding appropriation to building and opening—or activating—a facility is generally 3 to 5 years.
In addition, according to BOP officials, funding was requested and provided to contract for private bed space during this period—with the exception of fiscal years 2008 and 2011. BOP officials explained that only low security inmates can be housed in privately managed facilities; thus, in years when BOP has received related funds, they have been able to move these lower security inmates to the contracted facilities. However, since they have not consistently received this money, BOP officials told us they designated some low security inmates to medium security
facilities. As a result, BOP is currently housing 4,500 low security inmates in medium security facilities, contributing to crowding at that security level. According to BOP data, 81 percent of male inmates housed in low
security facilities were triple bunked at the end of 2011. Officials noted that if they were able to add more contract beds they could reduce crowding in medium and low security facilities by moving (1) non-U.S.
36BOP’s Building and Facilities budgetary account includes two “decision units”—one for
“new construction” and one for “maintenance and repair.” Within the “new construction” decision unit, baseline funding includes about $10 million annually to support the lease payments on BOP’s federal inmate transfer center, as well as other costs associated with considering potential construction sites, studying environmental impact, and any facility expansion and conversion projects. These baseline funds also cover the salaries and administrative costs of architects, project managers, and procurement and other staff necessary to carry out the efforts.
37During this period, the fiscal year 2008 budget submission was the outlier, when the
request included $115 million to support construction that had already begun at the Mendota facility. Congress ultimately appropriated these funds, but did so as part of the fiscal year 2007 budget. Because of protracted budget negotiations in fiscal year 2007, the budget that year passed after the fiscal year 2008 budget had been submitted.
BOP officials said that housing low security inmates in medium security institutions is contributing to crowding in medium security institutions, but BOP’s low security facilities are “just plain full.”
citizen inmates from low security facilities to contract facilities and (2) low security inmates from medium security facilities to low security facilities. (See table 6 in app. II for additional data on BOP’s population growth, rated capacity, and percentage crowding data for fiscal years 2006 through 2011.)
BOP’s 2020 long-range capacity plan assumes continued growth in the federal prison population from fiscal years 2011 through 2020, with about 15 percent growth in the number of inmates BOP will house.38 To address
some of this growth, BOP expects to activate five newly constructed prisons by 2014, adding about 6,720 beds.39 In addition, BOP is
budgeting for additional contracted bed space—1,000 beds in 2013 and 1,500 the next year, but the addition of these contracted beds is subject to future appropriations. Despite its plans to add capacity through 2014, given the expected inmate population growth, BOP projects crowding will increase from the current rate of 39 percent to 44 percent by 2015. Beyond 2015, BOP projects it will be able to bring crowding in BOP facilities down to 35 percent by 2020. BOP’s projections assume that BOP will receive additional funding for constructing new facilities.
Specifically, BOP assumes an overall increase of over 17,500 beds from fiscal years 2016 through 2020, generally as a result of opening new high and medium security facilities, none of which is under construction. BOP has not requested funding for this additional bed space, and as a result, its plans are contingent on the budget development and appropriations processes and are subject to change. Appendix II provides additional information on BOP’s population growth from fiscal years 2006 through 2011 and projections from fiscal years 2012 through 2020.
38These projections are from BOP’s 2020 capacity plan dated January 10, 2012. In
November 2009, we concluded that BOP’s projections at the time were accurate, on average, to within 1 percent of the actual inmate population growth from fiscal year 1999
through August 20, 200
39According to BOP, these facilities include two medium security/camp facilities in
Mendota, California (1,152 beds) and Berlin, New Hampshire (1,280 beds), that will open from 2012 through 2013; one female secure/low security camp facility in Aliceville, Alabama (1,792 beds), opening from 2012 through 2014; and one medium security/camp facility in Hazelton, West Virginia (1,280 beds); and one high security facility in Yazoo City, Mississippi (1,216 beds), scheduled to open from 2013 through 2014.
BOP Projects Continued
Population Growth
According to BOP and our observations, the growth of the federal inmate population and related crowding have negatively affected inmates housed in BOP institutions, institutional staff, and the infrastructure of BOP
facilities, and have contributed to inmate misconduct, which affects staff and inmate security and safety. Nevertheless, BOP officials said that it is difficult to demonstrate or isolate the effects of crowding, per se, as distinguished from population growth or other factors such as staffing levels.
The growth in the inmate population affects inmates’ daily living conditions, program participation, meaningful work opportunities, and visitation. Appendix III describes each in greater detail, and we present some highlights here.
To increase available bed space, BOP reports double bunking in excess of the percentages included in a facility’s rated capacity; triple and quadruple bunking; or converting common space, such as a television room, temporarily to housing space. As a result of BOP actions to increase available bed space in its institutions to accommodate the growing federal inmate population, more inmates are sharing cells and other living units, which brings together for longer periods of time inmates with a higher risk of violence and more potential victims.40
40BOP. The Effects of Changing Crowding and Staffing Levels in Federal Prisons on
Inmate Violence Rates—Executive Summary (Washington, D.C.: October 2005). Table 8 in appendix III illustrates the use of temporary beds by institutional security level, and shows, for example, that temporary beds, not including those used for disciplinary purposes, composed about 29 percent of the bed space in male high security facilities in fiscal year 2011. According to BOP headquarters officials, wardens have discretion to provide temporary beds by adding a third bunk within cells, converting a television room to bed space, or using both approaches. The facility’s infrastructure also
BOP’s Population
Growth Has
Negatively Affected
Inmates, Staff, and
Infrastructure, but
BOP Has Acted to
Help Mitigate These
Effects
Impacts of Population
Growth
Inmates
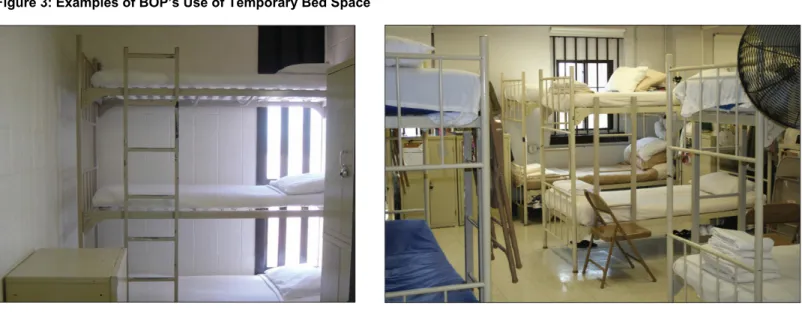
affects the approach the warden may implement. For example, the smaller cells in older BOP facilities make it more difficult to add a third bed, while the larger cells in newer facilities can be triple-bunked. The officials noted, however, that triple-bunking all cells in a unit presents a challenge to staff who have to manage the large number of inmates. Additionally, a regional director may have a preferred approach to providing temporary beds within his or her region. Figure 3 illustrates some of the options used.
Figure 3: Examples of BOP’s Use of Temporary Bed Space
All of the BOP facilities we visited reported using temporary beds from fiscal years 2006 through 2011 and continue to do so. At the time of our site visits in 2011 and 2012, these facilities continued to use temporary space. For example, we observed triple-bunked cells in a low security facility and a converted television room that housed 10 inmates in a medium security facility. In addition to experiencing crowding in a facility’s housing and common areas, inmates may experience crowded bathroom facilities, reductions in shower times, shortened meal times coupled with longer waits for food service, and more limited recreational activities because of the increased inmate population.
According to BOP officials, the growth in the inmate population affects the availability of program opportunities, resulting in waiting lists and inmate idleness. BOP provides programs including education, vocational training,
drug treatment, and faith-based reentry programs that help to rehabilitate inmates and support correctional management.41
According to BOP officials, facility staff provide a range of education programs, including mandatory General Educational Development (GED) courses; 8- to 10-week nonmandatory courses on topics such as
parenting, word processing, and conversational Spanish; occupational training; and computer-based self-paced courses such as English. BOP reported that overall inmate participation in one or more programs was 36 percent in September 2011 (see table 10 in app. III).
BOP officials said that two long-term benefits of inmate programming are (1) public safety, attributable to enhanced inmate skill sets that can reduce future crime and inmate rearrest rates, and (2) institutional safety and security because of reduced inmate idleness.
42 BOP also offers
residential drug abuse treatment in more than half of its facilities and nonresidential drug abuse and drug education programs in all of its facilities. The percentage of participation, number of inmates on waiting lists, and length of the average waiting time varied by program. As tables 11 through 13 in appendix III illustrate, all of the drug treatment and drug education programs had waiting lists from fiscal years 2006 through 2011. For example, as of the end of fiscal year 2011, about 2,400 inmates in male medium security institutions participated in residential drug treatment, almost 3,000 more inmates were on the waiting list to participate, and the average wait for enrollment exceeded 3 months. According to BOP officials, if BOP cannot meet the substance abuse treatment or education needs of inmates because it does not have the staff needed to meet program demand, some inmates will not receive programming benefits. As we reported in February 2012, long waiting lists for BOP’s Residential Drug Abuse Program (RDAP), which provides sentence reductions for eligible inmates who successfully complete the program,43
41S
constrained BOP’s ability to admit participants early enough to
42BOP’s Monthly Participation Reports provide a snapshot of program participation levels
of inmates within BOP facilities. Figures for overall inmate participation do not duplicate. That is, if an inmate is enrolled in more than one program area (for example GED and parenting), the inmate’s participation is counted only once.
4328 C.F.R. § 550.53(b) outlines the RDAP eligibility criteria. 28 C.F.R. § 550.55 outlines
earn their maximum allowable reductions in times served.44
According to BOP headquarters officials, the growth in the federal inmate population has also affected inmate work opportunities, as it is difficult to find meaningful work for all inmates, even though generally all inmates are required to have a job.
From fiscal years 2009 through 2011, BOP expanded RDAP capacity by 400 slots. Though wait times for enrollment have declined, the program continues to experience long waiting lists.
45
According to BOP headquarters officials, the quality of the interaction between an inmate and family can positively affect an inmate’s behavior in prison and aids an inmate’s success when returning to the community; however, crowded visiting rooms make it more difficult for inmates to visit with their families. Each BOP facility has visiting space to accommodate the number of inmates that the facility was designed to house and a visitor capacity to enable staff to manage the visitation process. The infrastructure of the facility may not support the increase in visitors as a result of the growth in the prison population. For example, at one older facility we visited, officials said that the number of visitors was so great and the visiting room was so small that visitors had to wait hours to get into the visiting room.
BOP inmates participate in a variety of jobs. For example, at facilities we visited, we observed inmate workers
preparing meals under the supervision of staff, sweeping the floors, and working in a factory that produced and printed a variety of government publications. BOP officials explained, however, that with the growth of the prison population, fewer opportunities exist to engage in meaningful work. This makes it difficult for staff to keep inmates busy, resulting in inmate idleness, which can lead to additional tension and fighting between inmates. For example, officials at one facility told us that more inmates than needed may be assigned to a task and paid the same wage, but consequently, not everyone is engaged and equally busy.
44For more on RDAP, s
45The Crime Control Act of 1990, Pub. L. No. 101-647, § 2905, 104 Stat. 4789, 4914
(codified at 18 U.S.C. § 4121 note) established a mandatory work requirement for all federal prisoners. A prisoner may be excused from this requirement only as necessitated by security considerations; disciplinary action; medical certification of disability; or a need to work less than a full schedule in order to participate in literacy training, drug
rehabilitation, or similar programs in addition to the work program.
Meaningful Work
Opportunities
BOP headquarters officials said that with the primary exception of hiring staff when a new facility opens, the number of staff positions generally has not increased as BOP’s population has grown, affecting staff stress and overtime hours worked. BOP officials explained that BOP is required to feed, clothe, and provide medical care for inmates. After these costs are met, BOP funds staffing levels to the extent possible. As a result, BOP headquarters officials confirmed that overall staffing in BOP facilities systemwide is on average less than 90 percent of authorized levels, varying by the facility’s location. For example, a warden may staff correctional programs at the 97 percent level and the business office at the 60 percent level. In addition to funding, BOP officials identified recruitment challenges that affected staffing levels. For example, one regional director said that finding qualified staff to hire was an ongoing issue in his region because generally applicants did not meet BOP’s requirements. At two facilities we visited, officials noted that hiring professional staff (e.g., psychologists or medical staff) was difficult
because BOP salaries were less than those paid in the community for the same position.
From fiscal years 1997 through 2011, BOP reported that the systemwide ratio of inmates to all BOP staff (i.e., at BOP headquarters, regional offices, institutions, and training centers) increased from 3.57:1 to 4.94:1.46 This is not the only staffing ratio BOP calculates however. In
addition, BOP calculates a ratio of inmates and institutional staff within its facilities.47
46BOP calculates the ratio for inmates and all BOP staff at the systemwide level; not by
security level. The inmate population is the actual population at each facility on the last day of the fiscal year. The staffing level is the total number of staff on board as of the last pay period of the fiscal year and includes all staff funded by BOP’s Salaries and Expenses appropriations and Public Health Service staff at BOP headquarters, regional offices, institutions, and, training centers.
From fiscal years 2006 through 2011, the inmate to total institutional staff ratio for all facilities systemwide and for all male facilities was generally 5.2:1. In fiscal year 2011, this ratio was lower in high security facilities (4.1:1) and higher in low and minimum security facilities
47In fiscal year 2005, BOP began calculating overall institutional staffing ratios on the
basis of (1) all staff under BOP’s Salaries and Expenses appropriations, including correctional officers, noncustody staff (e.g., teachers, psychologists, and administrative staff); and Public Health Service staff on board as of the last pay period of the fiscal year; and (2) the average inmate daily population at each BOP facility. These ratios exclude BOP Buildings and Facilities, Federal Prison Industries, Commissary, regional office, training center, and central office staff, as well as staff at facilities that were being activated.
Staff
The increased inmate-to-staff ratio can increase staff overtime and stress and reduce inmate and staff communication. This can affect the safety and security of the institution as a whole.
(6.1:1 and 8.0:1, respectively). Further, BOP calculates a ratio of inmates to correctional officers. According to BOP, this ratio is 10:1 systemwide, but it varies depending on security level and mission of the facility. For example, in one Special Management Unit we visited, officials told us that there were about 6 inmates to each correctional officer.48
According to an August 2010 DOJ study of BOP’s staffing,
This contrasted to a medium security facility where officials told us the ratio of inmates to correctional officers was 14:1.
49 nearly all
BOP facilities had fewer correctional staff on board than needed, with a BOP-wide staffing shortage in excess of 3,200.50
Nevertheless, the study stated that BOP’s use of a systemwide ratio had not been sufficiently effective in justifying additional annual budget requests, because the ratio did not convey operational realities at the institutional level. Specifically, the study found that there were variances in the number of daily correctional officer shifts based on the time of day and the day of the week that the overall ratio was not incorporating. Our observations illustrated this point. At one medium security facility we visited, officials reported a population of about 1,300 inmates, 56 percent crowding, an inmate to total staff ratio of 6.0:1. Facility officials explained, Moreover, even if BOP filled all authorized positions, the study reported that the shortage would exceed 1,800. The study team observed that the institutional staff was very lean, highly functional, and adept at managing large numbers of inmates at a time, but there was also anecdotal evidence that
understaffing was stressing the workforce. Thus, the study concluded that the systemwide inmate-to-staff ratio in BOP institutions—5.3:1 in 2009 when the study was prepared—must, at a minimum, be maintained.
48A Special Management Unit operates as a more controlled and restrictive environment
for inmates whose interaction requires greater management to ensure the safety, security, or orderly operation of BOP facilities, or protection of the public.
49Justice Management Division, DOJ, BOP Staffing Study (Washington, D.C.: August
2010).
50According to the study, BOP uses a staffing roster to determine the number of
correctional officers needed to fill custody posts at its facilities. The roster process identifies a clear need of correctional services personnel that is typically higher than the numbers of both funded and authorized positions. The study states that there appears to be a disconnect between (1) establishing authorized and funded staff positions and (2) determining the number of correctional officers needed to ensure institutional safety and security through BOP’s staffing roster process.
however, that about 17 correctional officers were on duty during nights and evenings to supervise the general population. Thus, in contrast to the reported ratio, the actual inmate-to-staff ratio during these occasions was about 76:1. The DOJ study goes on to state that an inmate-to-staff ratio can provide a valuable perspective when it is used to show how staffing varies during specific shifts at specific institutions. When ratios are used in this context, decision makers can more effectively determine the appropriate number of institution staff needed to safely manage an institution. Accordingly, for BOP to justify its staffing levels plus additional resources for increased staff—as the inmate population grows—the study recommended, among other things, that BOP set a minimum inmate-to-staff ratio that is required to run a safe, secure, and efficient prison system given operational realties. Partly in response to the DOJ report, BOP officials said that they had developed minimum staffing guidelines, and as of June 2012, BOP was in the process of applying these
guidelines at each facility. Tables 14-16 in appendix III illustrate the various inmate-to-staff ratios and trends over time.
BOP headquarters officials and the union representatives said that correctional staff worked more overtime hours to meet additional staff needs as a result of the larger inmate population.51
51For fiscal years 2009, 2010, and 2011, BOP reported a total of 1,480,713; 1,416,269.50;
and 1,381,129.50 overtime hours charged by correctional officers in all facilities, respectively. BOP also maintains data on overtime costs for all BOP staff. Institutional overtime costs for all BOP regions totaled $102,877,891; $102,352,434; and $89,035,146 for each respective year. BOP officials said that the decline in fiscal year 2011 was due, in part, to reduced appropriations that year.
Alternatively, in lieu of paying overtime, facility management may divert other professional or administration staff, as trained correctional officers, from their primary duties to supervise other aspects of inmate care and confinement, such as meal times or medical trips. According to BOP headquarters officials, this practice, known as augmentation, affects programming. For example, if a teacher has to fill a correctional post, then the class does not occur or another teacher may be required to supervise the course. Headquarters, regional, and facility officials said that they generally used augmentation during annual correctional officers’ refresher training. For example, during our site visit to a Special Management Unit, we observed an
administrative staff member serving as a correctional officer in the unit, replacing a correctional officer who was attending BOP-required annual
staff refresher training.52
The increased population taxes the infrastructure that was designed for a smaller inmate population, affecting use of toilets, showers, water, and electricity, and wear and tear on food service equipment (e.g., freezer units). According to BOP headquarters and regional officials, crowding affects the general usage and upkeep of the facility, which affects the facility itself, the environment, and the local community.
BOP facilities and regional offices have tracked the use of augmentation, but headquarters did not review or analyze this information centrally until February 2012, at the direction of the new BOP Director. Therefore, during the course of our audit work, BOP could not provide any trend analysis on the use of augmentation systemwide.
BOP has also experienced increased maintenance and repair costs, with 51 facilities over 30 years old and newer facilities also in need of
maintenance and repair.53
BOP officials said the increasing inmate population and staffing ratios negatively affect inmate conduct and the imposition of discipline, thereby affecting security and safety. A 2005 BOP report on the effects of
crowding and staffing levels in federal prisons on inmate violence rates concluded that population pressures on both staffing levels and inmate living space have an upward impact on serious prison violence.
Nevertheless, the study also found that systemwide violence rates remained stable, although measures of both percent rated capacity and
BOP reported systemwide maintenance and repair costs of about $228 million in fiscal year 2006 and $262 million in fiscal year 2011—approximately a 15 percent increase. BOP
headquarters officials stated that they are most concerned with “life safety issues,” such as ensuring that sprinkler systems work properly in the event of fire in the facility. These officials said that requests for repairs are often put off when BOP does not receive funding. (See app. III for
additional information on the effects of BOP’s population growth on infrastructure.)
52BOP established a Special Management Unit at Lewisburg Penitentiary in fiscal year
2008, and subsequently converted the entire facility to a Special Management Unit, with the exception of a unit housing general population high security inmates.
53In our previous work
in its annual budget requests largely reflect the four best practices outlined in GAO, Cost Estimating and Assessment Guide: Best Practices for Developing and Managing Capital Program Costs,
Infrastructure
inmate to correctional officers ratios rose in federal prisons during the latter part of the study.54 The study posits that this stability may stem from
prison managers employing some operational practices, such as augmentation, that in the short term countered the negative effect of increased crowding. BOP officials told us that a follow-up to the 2005 study is not necessary because they did not believe that the findings would change.
BOP generally reported increases in the number of guilty findings for inmate misconduct from fiscal years 2006 through 2009, but the number of findings for misconduct of the greatest severity (e.g., killing, serious assault, and possession of weapons) began to decline in fiscal year 2010. Additionally, from fiscal years 2006 through 2011, BOP systemwide imposed almost 4,000 lockdowns––a temporary situation in which all inmates are confined to their living quarters/cells until staff are able to assess the situation following a critical incident (e.g., a disturbance, assaults on staff by several inmates, or a food or work strike) and can safely return the institution to normal operations. Similar to the inmate misconduct data, the number of lockdowns increased from fiscal years 2006 through 2009, and then began to decline. Appendix III provides information on BOP’s disciplinary system and data on inmate misconduct and lockdowns.
BOP officials at all levels told us that they believe the establishment of Special Management Units beginning in fiscal year 2008 had contributed to the decrease in misconduct in the general population and the decline in the use of lockdowns, but that these facilities are too new to evaluate.55
Nevertheless, BOP officials stated that its Special Management Units are now crowded and experiencing waiting lists.56 Specifically, BOP reported
that from March 1, 2012, through April 20, 2012, 231 inmates were approved for Special Management Unit placement and were awaiting a
54The study used calendar quarter data for 73 federal low, medium, and high security all
male prisons from July 1996 through December 2004, a period of increased prison crowding and increased inmate to correctional officer ratios.
55 We have ongoing work that focuses on BOP’s Special Management Units and Special
Housing Units. We expect to publish our results in early 2013. As part of our review, we are analyzing their effects on inmate misconduct.
56As of January 31, 2012, BOP reported housing 1,664 male inmates in its Special
Management Units.
BOP places inmates in Special Housing Units for disciplinary or administrative reasons when their presence in the general inmate population would otherwise threaten the safety, security, or orderly operation of the facility or potentially cause harm to the public. BOP places inmates in
Special Management Units when inmates need an even more restrictive and controlled environment—for even longer terms—than can be offered in a Special Housing Unit or among the general inmate population.