Seventh National GP Worklife Survey
Mark Hann
1, James McDonald
2, Kath Checkland
3, Anna Coleman
3, Hugh
Gravelle
4, Bonnie Sibbald
5, Matt Sutton
21
Centre for Biostatistics, Institute of Population Health, University of Manchester
2
Manchester Centre for Health Economics, Institute of Population Health, University
of Manchester
3
Health Policy, Politics & Organisation (HiPPO) research group, Centre for Primary
Care, Institute of Population Health, University of Manchester
4
Centre for Health Economics, University of York.
5
Centre for Primary Care, Institute of Population Health, University of Manchester
Acknowledgements
This report is independent research commissioned and funded by the Department of Health Policy Research Programme (2012 National Survey of General Practitioner Job Satisfaction, 029/0125). The views expressed in this publication are those of the authors and not necessarily those of the Department of Health.
We are extremely grateful to: Rebecca Fenwick and Wendy Lamb for managing the project and organising the administration of the survey; Tommy Allen, Yiu-Shing Lau, Philippa Turner and Caroline Vass for preparing the questionnaire packages and their assistance with data entry; Annette Barber for her advice in the early stages of the survey administration; and the many GPs who participated in the research.
Correspondence
Correspondence about this report should be addressed to Matt Sutton, Room 1.304, Jean McFarlane Building, The University of Manchester, Oxford Road, Manchester, M13 9PL. Email: matt.sutton@manchester.ac.uk
Contents
Executive summary... 4 Background ... 6 Methods ... 7 Target sample ... 7 Response rate ... 8 Samples analysed ... 9 Questionnaire content ... 9 Clinical Commissioning ... 12Current commissioning involvement ... 12
Previous commissioning involvement ... 12
Opinions on clinical commissioning ... 13
Job Stressors, Job Attributes and Intentions to Quit ... 19
Job stressors ... 19
Levels of job stressors in 2012 ... 19
Changes in job stressors from 2010 ... 20
Job attributes ... 23
Levels of job attributes in 2012 ... 23
Changes in job attributes since 2010 ... 25
Intentions to quit ... 27
Likelihood of leaving direct patient care ... 27
Hours of Work ... 30
Sessions worked per week in 2012 ... 30
Average hours worked per week in 2012 ... 31
Trends in average hours worked per week ... 32
Extended opening hours ... 36
Percentage of time spent on various activities ... 37
Job Satisfaction ... 39
Job satisfaction levels in 2012 ... 39
Changes in satisfaction ratings from 2010 ... 40
Long-term trends in job satisfaction: 1987 – 2010 ... 43
Concluding remarks ... 45
Executive summary
National surveys of GPs’ working conditions and attitudes to primary care reforms were undertaken by the National Primary Care R&D Centre in 1998, 2001, 2004, 2005, 2008 and 2010. We undertook the seventh survey in this series in the autumn of 2012.
The surveys provide a consistent series over a long period on GPs’ job satisfaction, stressors, hours of work and intentions to quit. Each survey has a nationally-representative, cross-sectional element and a longitudinal element. In 2012, there were 1,189 respondents in the cross-sectional element and 2,015 respondents in the longitudinal element. This report provides key findings from the survey and makes comparisons with previous surveys.
Clinical commissioning
Thirteen percent of respondents had a formal role at Clinical Commissioning Group (CCG) level and a further fifteen percent stated that they were their practice’s commissioning lead. The majority of respondents agreed that GPs added value to pathway/service design, needs assessment, improving relationships with providers and contract negotiations/monitoring. However, respondents were divided on whether commissioning was part of their role as a GP. Respondents expressed concerns about the impact that CCG introduction had had on their personal workloads, the time that they could spend on direct patient care and continuity of care. Respondents also reported that the introduction of CCGs had led to decreases in referrals and practice prescribing, and increased integration between primary and secondary care. Seventy-seven percent of respondents stated that their practice was a member of the most appropriate CCG. Sixty-eight percent of respondents thought that practice income should not be related at all to CCG performance.
Job satisfaction
The level of overall job satisfaction reported by GPs in 2012 was lower than in all surveys undertaken since 2001. On a seven-point scale, average satisfaction had declined from 4.9 points in 2010 to 4.5 points in 2012 in both the cross-sectional and longitudinal samples. This change is robust to the changing age-sex composition of GPs, which has remained relatively stable in recent years. The largest decreases in job satisfaction between 2010 and 2012 were in the domains relating to ‘hours of work’ and ‘remuneration’. The changes were much smaller in the other specific domains of job satisfaction.
Hours of work
Respondents to the 2012 survey reported working an average of 41.7 hours per week. This is a small increase (0.3 hours) compared to the 2010 survey. The percentage of GPs who indicated that they worked at least one weekday evening session in a typical week had changed very little (58% in 2012; 57% in 2010), but the percentage who indicated that they worked at least one weekend session in a typical week had declined considerably (from 15% in 2010 to 10% in 2012). There was no change between 2010 and 2012 in the proportion of GPs reporting undertaking out-of-hours work: in 2012, 21% did so, for a median of 4 hours. Fewer GPs reported that their practice offered extended hours access at the weekend (32%) and on weekdays (76%) than in 2010. Respondents also reported devoting a similar percentage of their time to direct patient care (62%) as in 2010.
Stressors and job attributes
In 2012, as in 2010, GPs reported most stress due to ‘increasing workloads’ and ‘paperwork’ and least stress due to ‘finding a locum’ and ‘interruptions from emergency calls during surgery’. Reported levels of stress increased between 2010 and 2012 on all 14 stressors, generally by 0.2-0.4 points on a five-point scale. Reported levels of stress are now at their highest since the beginning of the National GP Worklife Survey series in 1998. Many attributes of GPs’ jobs had changed very little between 2010 and 2012. In 2012, the proportion of respondents reporting that they ‘have to work very intensively’ was 95% and 84% reported that they ‘have to work very fast’. Fewer than 10% thought that recent changes to their job had ‘led to better patient care’. However, 83% stated that their job ‘provides me with a variety of interesting things’.
Intentions to quit
The proportion of GPs expecting to quit direct patient care in the next five years had increased from 6.4% in 2010 to 8.9% in 2012 amongst GPs under 50 years-old and from 41.7% in 2010 to 54.1% in 2012 amongst GPs aged 50 years and over.
Conclusion
The 2012 survey reveals the lowest levels of job satisfaction amongst GPs since before the introduction of the new contract, the highest levels of stress since the start of the survey series, and a substantial increase over the last two years in the proportion of GPs intending to quit direct patient care within the next five years.
Background
The National Primary Care Research & Development Centre undertook postal surveys of General Practitioners’ working lives in 1998 (Sibbald et al., 2000), 2001 (Sibbald et al., 2003), 2004 (Whalley et al., 2005, 2006a), 2005 (Whalley et al., 2006b, 2008), 2008 (Hann et al., 2009) and 2010 (Hann et al., 2011). The seventh in this series was undertaken in the autumn of 2012.
This series of questionnaires spans over a decade and continues to provide a unique resource for tracking long-term trends, as well as identifying the key policy and environmental issues impacting on GPs’ working lives.
The 2012 survey performed a number of important functions:
to contribute to the ongoing tracking of GPs’ satisfaction and pressures at work through a series of primary care reforms;
to provide further evidence on trends in GPs’ hours, activities and intentions to quit general practice; and
to gauge GPs current involvement in, and opinions on, clinical commissioning, at the point where CCGs were being established in shadow form and prior to their role in commissioning coming into effect formally from April 2013.
Methods
The data were collected via a postal questionnaire survey administered to a sample of GPs between September and November 2012.
Target sample
The target sample consisted of GP providers, salaried GPs and GP retainers practising in England. Data were obtained from:
the annually collated General Medical Services (GMS) Statistics database maintained by The Information Centre for health and social care1 (containing GMC number, age, gender and contract status of all GPs in contract with the NHS in England as of 1st October each year); and
NHS Prescription Services data available from Connecting for Health (at http://www.connectingforhealth.nhs.uk/systemsandservices/data/ods/genmedpr acs), which records contact data for current (and historical) GP prescribers. Following the methodology employed in previous surveys, two samples of GPs were drawn from the subset present on both the 2011 GMS Statistics database and the prescriber list:
1. A cross-sectional sample – a random sample of 3,000 GPs, excluding GP registrars, representing approximately 1/12th of the GP population;
2. A longitudinal sample of 3,280 GPs who responded to: the 2010 survey (2,350 GPs); the 2008 survey but not the 2010 survey (855 GPs); or to all three of the surveys conducted in 2001, 2004 and 2005 (75 GPs).
The random sample of 3,000 GPs was drawn first. Those GPs eligible for the longitudinal sample but not already selected as part of the random sample (2,984 GPs) were added to form the overall study sample. After removing ‘duplicate records’ (e.g. individual GPs holding more than one contract for whom two had been selected), the final total target sample contained 5,973 GPs.
Response rate
Reminders were sent at three and six weeks after the initial mailing. Each mailing included a covering letter, the survey questionnaire and a reply-paid envelope. Respondents were asked to return the questionnaire blank if they did not wish to participate and wanted to avoid receiving reminders.
The response rate in the cross-sectional survey was 40% (1,189 of 2,995: up on the 36% achieved in the 2010 survey) and in the longitudinal sample was 62% (2,015 of 3,274: also up on the 59% achieved in the 2010 survey).
Some of the questionnaires were completed by a different GP to whom the invitation was addressed. Cross-referencing the age and gender reported by the respondent with that of the intended recipient recorded on the GMS Statistics database suggested that 251 of 1,1672 questionnaires in the cross-sectional sample (21.5%) were completed by a different GP than the GP to whom the letter was addressed. Proportionately, this happened more frequently in the cross-sectional element of the survey than the longitudinal element (15.2%; 301 of 1,9843).
The achieved samples in previous GP satisfaction surveys have been reasonably representative of the entire GP populations at those times. Adjustments for observed differences between the achieved samples and the populations have made little difference to key statistics. Furthermore, while previous surveys have shown an inverse relationship between average satisfaction and response rates, previous analysis has shown that this relationship does not lead to bias in the estimated changes in mean satisfaction or in the estimated effects of the determinants of satisfaction (Gravelle, Hole and Hussein, 2008). The age, gender and contract type compositions of the entire GMS database and the cross-sectional sample of respondents are summarised in Table 1. There is good representation of all groups. However, respondents aged between 50 and 59 are over-represented compared to the entire GP population, whilst other age groups are under-represented, especially the very youngest (under 35 years) and very oldest (60 years and over) groups. Respondents are more likely to be GP providers than in the GP population.
222 questionnaires had missing age and/or gender.
3
Table 1: Representativeness of the cross-sectional element of the survey All GPs
(2011 – excl. Registrars) 2012 Worklife Survey Respondents
N 34,245 1,189 Age (years) < 35 4,026 (11.8%) 89 ( 7.7%) 35 – 39 5,253 (15.3%) 161 (13.9%) 40 – 44 5,149 (15.0%) 147 (12.7%) 45 – 49 6,130 (17.9%) 190 (16.4%) 50 – 54 6,056 (17.7%) 285 (24.7%) 55 – 59 4,191 (12.2%) 209 (18.1%) 60 + 3,440 (10.0%) 75 ( 6.5%) Gender Male 18,621 (54.4%) 631 (54.6%) Female 15,624 (45.6%) 525 (45.4%) Contract type Provider 26,827 (78.3%) 996 (86.2%) Other + Locum 7,418 (21.7%) 160 (13.8%) Note: Information on age and/or gender and/or contract type was missing for 33 respondents.
Samples analysed
Depending on the focus of the analysis, we use different samples throughout this report: (i) the cross-section sample only; (ii) the longitudinal sample only and (iii) a pooled sample, representing all respondents to the 2012 survey. The sample used for each table is indicated in the table notes. In general, where a question has been asked in previous surveys, and the primary purpose is to compare a representative sample of GPs in 2012 with a representative sample in earlier years, we include only the 1,189 respondents in the cross-sectional sample in 2012. Where possible we complement this analysis with analysis of the same individuals over time, using the 2010-2012 longitudinal sample. This serves to assess the robustness of the findings from the comparison of two repeated cross-sections and provides more detailed consideration of how the distributions of the variables have changed over time. Where a question has not been asked in previous surveys, and the primary purpose is an accurate representation of the current situation, we present figures based on all available responses from the pooled sample (e.g. in the clinical commissioning section).
Questionnaire content
To permit tracking of long-term trends, many of the questions used in the 2012 survey were the same as those used in previous surveys. The questionnaire contained sub-sections covering: personal, practice, job and area characteristics; job stressors; job attributes;
intentions to quit or retire; job satisfaction; clinical commissioning; and the GPs’ role in patient health, work and wellbeing. The main content is outlined below.
Personal, practice, job and area characteristics
Questions included: age; sex; contract type; estimated hours of work (during surgery hours and out-of-hours); estimated allocation of time between direct and indirect patient care and administration; and practice size (numbers of doctors, nurses and patients).
Job stressors
Respondents were asked to rate the amount of pressure they experience from each of 14 potential sources of job stress on 5-point response scales.
Job attributes
GPs were asked to indicate the extent to which they agreed or disagreed (on a 5-point scale) with 15 statements relating to their job control, workload, job design and work pressures.
Intentions to quit or retire and other changes in work participation
GPs were asked about the likelihood (rated on a 5-point scale) that they would make certain changes in their work life within five years, including: increasing work hours; reducing work hours; leaving direct patient care; and leaving medical work entirely. Job satisfaction
Job satisfaction was measured with the reduced version of the Warr-Cook-Wall questionnaire that has been used in previous surveys. This asks about nine individual domains of job satisfaction as well as satisfaction overall. Each item in the measure is rated on a 7-point scale, ranging from ‘extremely dissatisfied’ (score=1) to ‘extremely satisfied’ (score=7).
Clinical commissioning
GPs were asked about their current involvement in clinical commissioning and any previous involvement in GP-led commissioning. They were also asked about the added value that GPs bring to commissioning and how the introduction of clinical commissioning groups had impacted on them and their patients locally.
GPs’ role in patient health, work and wellbeing
This section of the questionnaire was developed for the 2010 survey in conjunction with policy customers in the Health Work and Well-being Delivery Unit, led from the Department for Work and Pensions. The 19 items selected relate to GPs’ views on: the relationship of work to health; GPs’ role, training and confidence in supporting patients with health problems into work; their views on the fit note; and the availability of services to support patients into work. The findings from this section of the questionnaire are available in a separate report (Hann and Sibbald, 2013).
Clinical Commissioning
Current commissioning involvement
GPs were asked whether they currently had a role within the Clinical Commissioning Group (CCG) to which their practice belonged. Of 2,930 respondents, 383 (13%) reported having a formal role at CCG level (e.g. Office Holder; Committee Member; Workstream Lead). A further 441 GPs (15%) reported that they were commissioning lead for their practice (but did not have a formal role at CCG level).4 These 824 GPs were asked to report how many hours per week, on average, they spent on this role: the reported median was 3 hours [IQR = (2, 8) hours; based on 598 responses].
Of those with a formal role, 114 (29.8%) were female. Of those who were their practice’s commissioning lead, 136 (30.9%) were female. Overall, 34.4% of males have a CCG role versus 20.0% of females. GPs aged fifty years or over were the group most likely to have either a formal role (14.2%) or be their practices’ commissioning lead (16.0%), compared to both GPs aged under 40 years (10.9% and 10.4% respectively) and GPs aged 40 to 49 years (12.1% and 15.5% respectively).
Over half of respondents (51%; N = 1,460) reported that another GP in their practice had a formal role at CCG level. GPs aged under 40 years were most likely to do so (55.2%), whilst GPs aged fifty years or over were least likely (49.4%). Only 2% (N = 58) reported that they did not know whether another GP in their practice had a formal role at CCG level.
When asked about their future involvement in clinical commissioning, less than 1 in 10 of GPs (9%; N = 252) indicated that they would like a formal role at CCG level in the future. Eight-three percent (N = 2,298) said that they did not want a formal role in the future, and 8% (n = 231) reported being undecided. GPs aged under 40 years gave the most positive response: 14.3% expressed their desire for such a role, compared with 7.4% of GPs aged 40 to 49 years and 8.7% aged fifty years or over.
Previous commissioning involvement
GPs were asked about leadership roles that they had held in previous forms of GP-led commissioning (Table 2). Of 2,930 respondents, previous involvement with Practice Based
Commissioning (18.6%) and Primary Care Groups (16.0%) was most common. Only 46 GPs (1.6%) indicated that they had previously had a leadership role in Total Purchasing Pilots.
Table 2: Leadership Role in Previous Forms of GP Commissioning
Practice Based Commissioning 18.6%
Primary Care Groups 16.0%
Fundholding (inc. Community Fundholding) 13.9%
Primary Care Trusts 12.0%
Alternatives to Fundholding (e.g. Locality Commissioning) 7.0%
Total Purchasing Pilots 1.6%
Based on responses from the 2012 combined cross-sectional and longitudinal samples (N = 2,930).
Opinions on clinical commissioning
More than two-thirds of respondents (68%) thought that practice income should not be related to CCG performance at all. Twenty percent of GPs thought that up to 5% of practice income was an appropriate figure. Only 3% of respondents thought that in excess of 10% of practice income should be related to the performance of CCGs.
More than three-quarters of GPs (77.1%) agreed that their practice was a member of the most appropriate CCG: only 3.9% disagreed, whilst 5.8% were uncertain.
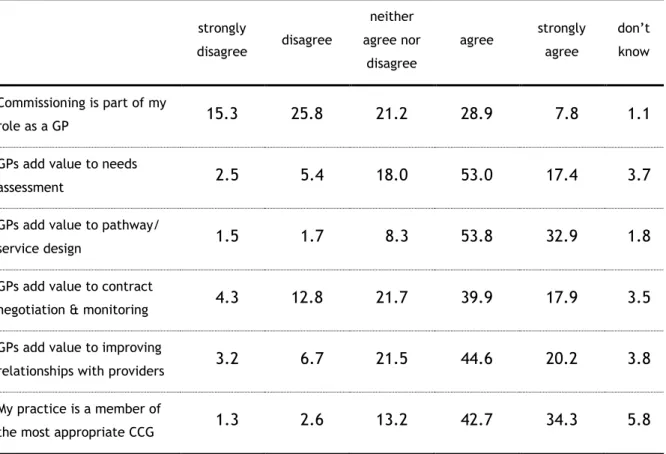
GPs were ‘split’ as to whether commissioning was part of their role; 36.6% agreed to some extent whilst 41.0% disagreed to some extent. The percentage in agreement varied by age with GPs aged fifty years and over most likely to disagree to some extent (under 40 years = 34.3%; 40 to 49 years = 40.7%; fifty years or over = 42.6%). GPs aged under 40 years were the most likely to neither agree nor disagree. Table 3 shows respondents’ views on the added value of GP involvement in clinical commissioning. The majority of respondents agreed to some extent that GPs added value to pathway and service design (86.7%), needs assessment (70.4%), improving relationships with providers (64.8%) and contract negotiation and monitoring (57.8%). Only a small minority of respondents disagreed with these statements or stated that they did not know if GPs added value.
Table 3: Views on the added value of GP involvement in clinical commissioning strongly disagree disagree neither agree nor disagree agree strongly agree don’t know Commissioning is part of my role as a GP 15.3 25.8 21.2 28.9 7.8 1.1
GPs add value to needs
assessment 2.5 5.4 18.0 53.0 17.4 3.7
GPs add value to pathway/
service design 1.5 1.7 8.3 53.8 32.9 1.8
GPs add value to contract
negotiation & monitoring 4.3 12.8 21.7 39.9 17.9 3.5 GPs add value to improving
relationships with providers 3.2 6.7 21.5 44.6 20.2 3.8 My practice is a member of
the most appropriate CCG 1.3 2.6 13.2 42.7 34.3 5.8 Cell figures represent within-row percentages, based on responses from the 2012 combined cross-sectional and longitudinal samples. Range of N = 2,903 – 2,918.
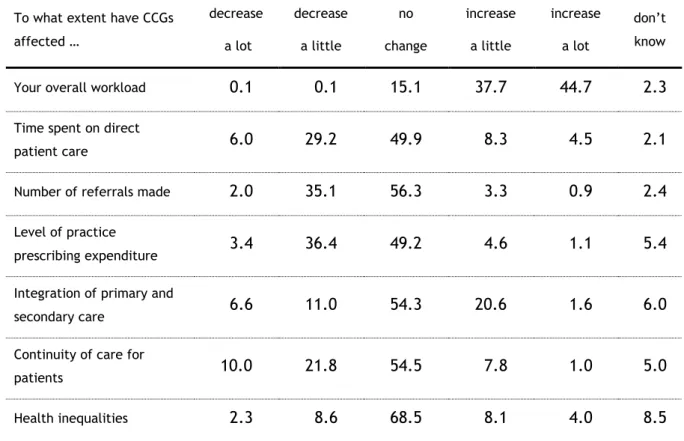
Table 4 shows respondents’ views on how the introduction of CCGs has affected aspects of their job, their patients and the local health economy. The vast majority of GPs (82.4%) indicated that their overall workload had increased to some extent following the introduction of CCGs. Only 6 respondents reported a decrease in their workload.
GPs were most likely to report that CCGs had not changed other aspects of their job, the care they provided, their patients and the local health economy. However, those who did report changes in these dimensions were likely to report a decrease rather than an increase in: the time they spent on direct patient care (35.2% decreased vs. 12.8% increased), the number of referrals they make (37.1% vs. 4.2%), practice prescribing expenditure (39.8% vs. 5.7%) and continuity of care for patients (31.8% vs. 8.8%). A greater percentage of GPs reported an increase rather than a decrease in the integration of primary and secondary care (22.2% vs. 17.6%).
Table 4: GPs views on the introduction of Clinical Commissioning Groups To what extent have CCGs
affected … decrease a lot decrease a little no change increase a little increase a lot don’t know
Your overall workload 0.1 0.1 15.1 37.7 44.7 2.3 Time spent on direct
patient care 6.0 29.2 49.9 8.3 4.5 2.1
Number of referrals made 2.0 35.1 56.3 3.3 0.9 2.4 Level of practice
prescribing expenditure 3.4 36.4 49.2 4.6 1.1 5.4 Integration of primary and
secondary care 6.6 11.0 54.3 20.6 1.6 6.0
Continuity of care for
patients 10.0 21.8 54.5 7.8 1.0 5.0
Health inequalities 2.3 8.6 68.5 8.1 4.0 8.5 Cell figures represent within-row percentages, based on responses from the 2012 combined cross-sectional and longitudinal samples. Range of N = 2,903 – 2,916.
Views on clinical commissioning by current CCG role
The views of the 383 GPs with a formal role at CCG level were compared with those of the 441 practice commissioning leads and, where applicable, the 2,106 respondents who reported having neither role.
Those GPs with a formal role reported spending a median of 6 hours per week on this role [IQR = (3, 12) hours; based on N = 364], whilst practice commissioning leads reported spending a median of 2 hours per week on this role [IQR = (1, 3) hours; based on N = 234]. GPs currently in a formal role were more likely to have had leadership roles in all previous forms of GP-led commissioning (Table 5). For example, 58% had such a role in Practice-Based Commissioning, compared to 29.3% of current practice commissioning leads and just 9.2% of GPs currently with neither role.
Table 5: Previous Leadership Roles in GP-led Commissioning by Current Role Formal Role at CCG level Practice Commissioning Lead Neither Formal nor Practice Lead
Practice Based Commissioning 58.0% 29.3% 9.2% Primary Care Groups 40.7% 19.7% 10.7% Fundholding (inc. Community
Fundholding) 25.6% 17.0% 11.1%
Primary Care Trusts 37.1% 14.1% 7.0% Alternatives to Fundholding
(e.g. Locality Commissioning) 19.6% 8.6% 4.4% Total Purchasing Pilots 5.5% 0.5% 1.1%
Percentages are based on “Yes” responses from the 2012 combined cross-sectional and longitudinal samples.
Over half of the GPs currently in a formal role at CCG level (51%) expressed a desire to continue with this role in the future. However, this sentiment was not so popular amongst current commissioning leads (9% wanted a future formal role) or GPs with neither role (3% wanted a future formal role).
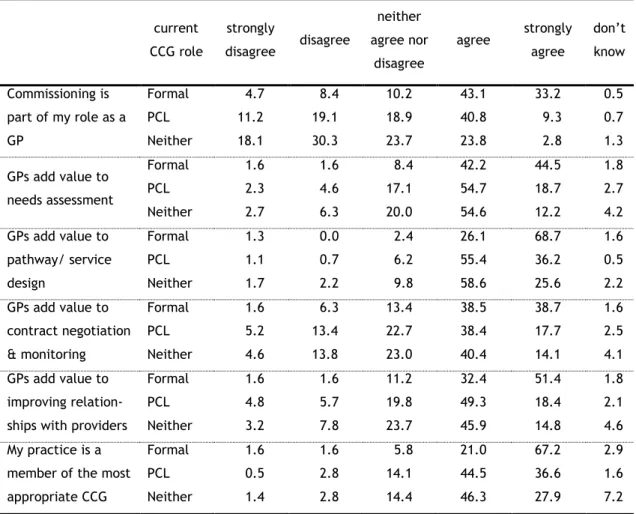
Table 6 shows respondents’ views on the added value of GP involvement in clinical commissioning by current CCG role. GPs with a formal role at CCG level were the most likely to agree to some extent (and, in particular, strongly so) that commissioning was part of their role as a GP; 76.3% responded in this way, compared to 50.1% of GPs who were practice commissioning leads and 26.6% of GPs who held neither position.
Respondents with a formal role were also most likely to agree to some extent and, in particular, strongly agree, that GPs added value to pathway and service design, needs assessment, improving relationships with providers and contract negotiation and monitoring. Again, practice commissioning leads were more likely to agree to some extent than GPs in neither role.
More than two-thirds of GPs with a formal role (67.2%) strongly agreed that their practice was a member of the most appropriate CCG. This figure was also considerably lower in the
other two groups (36.6% amongst practice commissioning leads; 27.9% amongst GPs with neither role).
Table 6: GPs views on the added value of their involvement in clinical commissioning by current CCG role current CCG role strongly disagree disagree neither agree nor disagree agree strongly agree don’t know Commissioning is part of my role as a GP Formal PCL Neither 4.7 11.2 18.1 8.4 19.1 30.3 10.2 18.9 23.7 43.1 40.8 23.8 33.2 9.3 2.8 0.5 0.7 1.3 GPs add value to needs assessment Formal PCL Neither 1.6 2.3 2.7 1.6 4.6 6.3 8.4 17.1 20.0 42.2 54.7 54.6 44.5 18.7 12.2 1.8 2.7 4.2 GPs add value to pathway/ service design Formal PCL Neither 1.3 1.1 1.7 0.0 0.7 2.2 2.4 6.2 9.8 26.1 55.4 58.6 68.7 36.2 25.6 1.6 0.5 2.2 GPs add value to contract negotiation & monitoring Formal PCL Neither 1.6 5.2 4.6 6.3 13.4 13.8 13.4 22.7 23.0 38.5 38.4 40.4 38.7 17.7 14.1 1.6 2.5 4.1 GPs add value to improving relation- ships with providers
Formal PCL Neither 1.6 4.8 3.2 1.6 5.7 7.8 11.2 19.8 23.7 32.4 49.3 45.9 51.4 18.4 14.8 1.8 2.1 4.6 My practice is a
member of the most appropriate CCG Formal PCL Neither 1.6 0.5 1.4 1.6 2.8 2.8 5.8 14.1 14.4 21.0 44.5 46.3 67.2 36.6 27.9 2.9 1.6 7.2
Cell figures represent within-row percentages, based on responses from the 2012 combined cross-sectional and longitudinal samples. Range of N for Formal Role at CCG level = 381 – 383; for PCL = 434 – 440; for neither role = 2,082 – 2,095. PCL = Practice Commissioning Lead.
Table 7 shows respondents’ views on how the introduction of CCGs has affected aspects of their jobs, their patients and the local health economy, by current CCG role. GPs that reported having a clinical commissioning role, regardless of this role, were more likely to indicate that their overall workload had increased to some extent than GPs reporting having neither role. The former group were also more likely to indicate, to some extent, a decrease in the time they spend on direct patient care (a considerable decrease for a significant minority with a formal role) and the number of referrals they make.
secondary care were now more integrated (47.5%). Their views on changes in continuity of care for patients and health inequalities were also more ‘favourable’ than practice commissioning leads and GPs with no CCG role, although these differences are much less pronounced than others.
Table 7: GPs views on the effect of the introduction of CCGs by current CCG role To what extent have CCGs
affected … current CCG role decrease a lot decrease a little no change increase a little increase a lot don’t know
Your overall workload
Formal PCL Neither 0.0 0.2 0.1 0.0 0.2 0.1 7.6 6.1 18.3 31.9 39.2 38.4 60.2 53.5 40.0 0.3 0.7 3.1
Time spent on direct patient care Formal PCL Neither 19.0 5.2 3.7 32.7 44.8 25.2 37.5 39.6 54.4 7.1 7.1 8.8 3.2 3.0 5.0 0.5 0.5 2.8
Number of referrals made
Formal PCL Neither 2.9 1.6 2.0 43.1 40.5 32.5 50.7 53.2 58.0 2.1 3.2 3.5 0.5 0.7 1.0 0.8 0.9 3.1 Level of practice prescribing expenditure Formal PCL Neither 6.0 3.6 2.9 45.0 36.1 34.8 43.5 53.5 49.4 3.9 3.4 4.9 0.5 1.4 1.2 1.1 2.0 6.8
Integration of primary and secondary care Formal PCL Neither 2.9 8.6 6.8 6.8 9.8 12.0 41.8 56.7 56.0 41.5 20.6 16.8 6.0 1.1 0.9 1.0 3.2 7.5
Continuity of care for patients Formal PCL Neither 5.2 11.4 10.6 19.9 20.5 22.4 50.3 57.1 54.7 19.4 7.7 5.6 3.1 0.9 0.6 2.1 2.5 6.1 Health inequalities Formal PCL Neither 2.1 2.1 2.4 19.6 6.6 7.0 66.3 73.0 68.0 6.3 8.4 8.4 2.1 4.8 4.2 3.7 5.2 10.1
Cell figures represent within-row percentages, based on responses from the 2012 combined cross-sectional and longitudinal samples. Range of N for Formal Role at CCG level = 379 – 383; for PCL = 440 – 441; for neither role = 2,084 – 2,093. PCL = Practice Commissioning Lead.
Job Stressors, Job Attributes and Intentions to Quit
Job stressors
Levels of job stressors in 2012
Respondents were asked to rate 14 factors according to how much pressure they experienced from each in their job on a five-point scale from ‘no pressure’ (=1) to ‘high pressure’ (=5). Summary statistics for the cross-sectional sample are provided for each stressor in Table 8.
The stressors are ranked in descending order of the mean score. GPs reported most stress with increasing workloads, paperwork, having insufficient time to do the job justice, increased demand from patients and changes imposed by their primary care organisation. They reported least stress with interruptions by emergency calls during surgery and finding a locum. More than 8 out of 10 GPs reported experiencing considerable or high pressure from increasing workloads and paperwork. Just 3 out of 10 GPs experienced the same levels of pressure from interruptions by emergency calls and finding a locum.
The ranking of stressors by mean scores and the percentages reporting high pressure (4 or more) is very similar (particularly for the items generating the greatest stress levels) and we therefore use mean scores throughout the remainder of this section.
Table 8: Levels of job stress in 2012 Job Stressor Cross-sectional sample Mean rating % reporting considerable/ high pressure Increasing workloads 4.40 86.20 Paperwork 4.22 80.85
Having insufficient time to do the job justice 4.18 77.65
Increased demand from patients 4.05 74.81
Changes imposed from the PCO 3.98 69.91
Dealing with problem patients 3.70 58.26
Long working hours 3.68 59.19
Dealing with earlier discharges from hospital 3.62 56.06 Unrealistically high expectation of role by others 3.44 50.80 Worrying about patient complaints/ litigation 3.32 43.53
Adverse publicity by the media 3.26 44.02
Insufficient resources within the practice 3.15 37.37 Interruptions by emergency calls during surgery 2.92 29.30
Finding a locum 2.74 31.19
% considerable/high pressure = % rating 4 or 5. Range of N for cross-sectional sample = 1,151 – 1,183.
Changes in job stressors from 2010
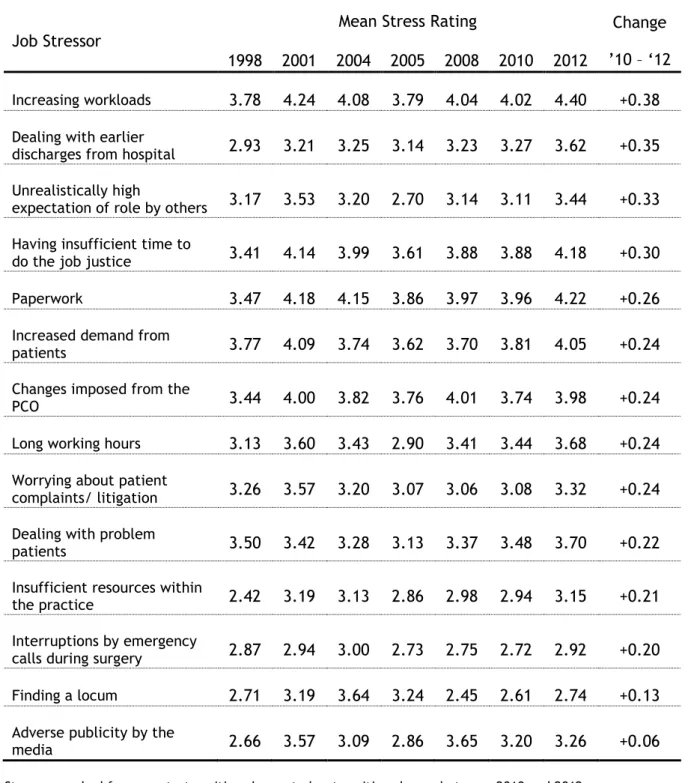
The changes in mean stress ratings between 2010 and 2012 in the cross-sectional sample are shown in Table 9. The stressors are ranked from the largest increase in rating to the smallest increase in rating. Average stress ratings reported on the same questions in the 1998, 2001, 2004, 2005 and 2008 surveys are also shown.
On all 14 factors, average stress ratings have increased between 2010 and 2012. The greatest increases were observed in relation to increasing workloads, dealing with earlier discharges from hospital, unrealistically high expectations of the role by others, having
insufficient time to do the job justice and paperwork: an increase in excess of one-quarter of a ‘point’ was observed in mean stress ratings on these five factors since 2010. Very modest increases were observed in relation to finding a locum and adverse publicity from the media; other stressors increased by between 0.20 and 0.24 ‘points’.
On 6 of the 14 factors (workloads, dealing with earlier discharges from hospital, having insufficient time to do the job justice, paperwork, long working hours and dealing with problem patients), mean stress ratings are at their highest level since the beginning of the National Worklife Survey series. On 4 more factors (high role expectations by others, increased demand from patients, worries about patient complaints and insufficient practice resources), mean stress ratings are at their highest level since 2001.
Table 9: Changes in mean job stressor ratings – cross-sectional samples
Job Stressor
Mean Stress Rating Change
’10 – ‘12 1998 2001 2004 2005 2008 2010 2012
Increasing workloads 3.78 4.24 4.08 3.79 4.04 4.02 4.40 +0.38
Dealing with earlier
discharges from hospital 2.93 3.21 3.25 3.14 3.23 3.27 3.62 +0.35 Unrealistically high
expectation of role by others 3.17 3.53 3.20 2.70 3.14 3.11 3.44 +0.33 Having insufficient time to
do the job justice 3.41 4.14 3.99 3.61 3.88 3.88 4.18 +0.30 Paperwork 3.47 4.18 4.15 3.86 3.97 3.96 4.22 +0.26
Increased demand from
patients 3.77 4.09 3.74 3.62 3.70 3.81 4.05 +0.24 Changes imposed from the
PCO 3.44 4.00 3.82 3.76 4.01 3.74 3.98 +0.24
Long working hours 3.13 3.60 3.43 2.90 3.41 3.44 3.68 +0.24
Worrying about patient
complaints/ litigation 3.26 3.57 3.20 3.07 3.06 3.08 3.32 +0.24 Dealing with problem
patients 3.50 3.42 3.28 3.13 3.37 3.48 3.70 +0.22 Insufficient resources within
the practice 2.42 3.19 3.13 2.86 2.98 2.94 3.15 +0.21 Interruptions by emergency
calls during surgery 2.87 2.94 3.00 2.73 2.75 2.72 2.92 +0.20 Finding a locum 2.71 3.19 3.64 3.24 2.45 2.61 2.74 +0.13
Adverse publicity by the
media 2.66 3.57 3.09 2.86 3.65 3.20 3.26 +0.06
Job attributes
Respondents were asked to indicate the extent to which they agreed or disagreed with a set of statements designed to measure the extent of job control, the nature of job design and work pressure. Responses were recorded on a five-point scale: strongly disagree, disagree, neither, agree, strongly agree.
Levels of job attributes in 2012
Table 10 shows that respondents were most likely to agree to some extent with the statements that they had to work very intensively (95%), that they had to work very fast (84.1%) and that their job provided a variety of interesting things (82.5%). In addition, approximately 7 out of 10 GPs agreed to some extent that they did not have time to carry out all their work, that they were required to do unimportant tasks, detracting from more important ones, but that they always knew what their responsibilities were. Respondents were least likely to agree with the statements that work relationships were strained (21.5%), clear feedback about their performance was received (21.4%) and that changes to the job in the last year had led to better patient care (10%). Sixty-two percent of GPs disagreed to some extent with this latter statement.
Table 10: Job attributes in 2012
Job Aspect % disagree/
strongly disagree
% agree/ strongly agree
(W) Have to work very intensively 1.02 95.01
(W) Have to work very fast 3.13 84.09
(C) Job provides variety of interesting things 4.41 82.54 (P) Do not have time to carry out all work 11.67 73.37 (P) Required to do unimportant tasks, preventing
completion of more important ones 11.75 71.17
(D) Always know what responsibilities are 11.82 70.19
(C) Choice in deciding how to do job 22.72 53.21
(D) Involved in deciding changes that affect work 32.46 46.32
(C) Working time can be flexible 33.08 41.71
(C) Choice in deciding what to do at work 32.83 38.66 (D) Consulted about changes that affect work 40.17 37.71 (C) I can decide on my own how to go about
doing my work 31.50 37.68
(P) Relationships at work are strained 54.54 21.54
(D) I get clear feedback about how well I am
doing my job 38.95 21.42
(D) Changes to job in last year have led to
better patient care 61.96 9.97
(C) = Job Control, (W) = Workload, (D) = Job Design, (P) = Work Pressures. Figures are based on the 2012 cross-sectional sample. Range of N = 1,179 – 1,184.
Changes in job attributes since 2010
The percentage of respondents to the 2012 survey agreeing to some extent with each of the 15 statements are compared to previous surveys in Table 11. The percentage of respondents agreeing with statements regarding workload (fast/ intensive) and work pressures (insufficient time; unimportant tasks; relationships) has shown the greatest increase between 2010 and 2012: these are generally aspects of the job with which GPs also most frequently agree (and have done so since 2005). A greater percentage of GPs (+3.0%) in 2012, compared to 2010, also agreed to some extent that they received clear feedback about how well they were doing. All other aspects of job control and design showed a decline in the percentage of GPs in agreement in 2012. This was particularly evident in relation to being able to decide what to do and how to do the job and being involved in deciding changes that affected the job. Since 2005, GPs’ responses imply that working speed and intensity have increased most (greatest positive change in agreement: +13%), but that changes to the job are not resulting in better patient care (greatest negative change in agreement: -20%).
Table 11: Trends in Job Design and Work Pressures, Workload and Job Control
Job Issue
% agree/ strongly agree
2005 2008 2010 2012 Change ’10 – ‘12
(P) Do not have time to carry out all work 66.7 68.7 67.1 73.4 +6.3%
(W) Have to work very fast 70.7 77.1 77.9 84.1 +6.2%
(P) Required to do unimportant tasks, preventing
completion of more important ones 69.7 71.7 67.2 71.2 +4.0% (P) Relationships at work are strained n/a n/a 18.7 21.4 +3.7%
(W) Have to work very intensively 81.6 91.0 91.5 95.0 +3.5%
(D) I get clear feedback about how well I am
doing my job 17.6 n/a 18.4 21.4 +3.0% (C) Working time can be flexible 46.8 44.8 42.6 41.7 -0.9%
(D) Consulted about changes that affect work 34.4 34.6 39.7 37.7 -2.0%
(C) Job provides variety of interesting things 81.5 83.2 84.7 82.5 -2.2%
(D) Changes to job in last year have led to
better patient care 30.1 13.6 13.2 10.0 -3.2% (D) Always know what responsibilities are 57.8 68.3 73.5 70.2 -3.3%
(C) I can decide on my own how to go about
doing my work n/a n/a 41.3 37.7 -3.6% (D) Involved in deciding changes that affect
work 48.7 48.8 50.5 46.3 -4.2%
(C) Choice in deciding how to do job 62.5 58.4 58.6 53.2 -5.4%
(C) Choice in deciding what to do at work 28.3 44.7 44.7 38.7 -6.0% Notes: Job attributes are classified into four groups: (C) = Job Control, (W) = Workload, (D) = Job Design, (P) = Work Pressures. n/a indicates that these questions were not included in the survey that year. All figures are based on the respective cross-sectional samples.
Intentions to quit
Likelihood of leaving direct patient care
Respondents were asked how likely they were to leave direct patient care within the next five years. This has been shown to be a valid predictor of intentions to quit and actual quitting behaviour (Hann, Reeves & Sibbald, 2011). For older GPs, intentions to leave direct patient care may be dominated by early retirement plans. Respondents were, therefore, asked at what age they planned to retire and how likely this was to happen. Using this information we can distinguish planned retirements from other reasons for leaving direct patient care.
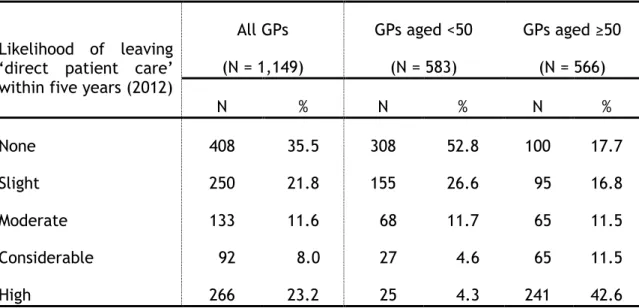
Table 12 shows the likelihood of leaving direct patient care stratified by whether or not the GP was currently aged less than 50 years. Approximately 3 out of every 10 (31.2%) respondents indicated that there was a considerable or high likelihood that they would quit direct patient care within five years. Amongst those aged 50 years or over the corresponding figure was over half (54.1%), with the vast majority of these (241 out of 306 = 78.8%) indicating that the likelihood was high. In contrast, fewer than 1 in 10 GPs aged under 50 years indicated that there was a considerable or high likelihood of leaving direct patient care within five years (8.9%): more than half (52.8%) stated that there was no likelihood.
Table 12: Likelihood of leaving ‘direct patient care’ within five years in 2012
Likelihood of leaving ‘direct patient care’ within five years (2012)
All GPs (N = 1,149) GPs aged <50 (N = 583) GPs aged ≥50 (N = 566) N % N % N % None 408 35.5 308 52.8 100 17.7 Slight 250 21.8 155 26.6 95 16.8 Moderate 133 11.6 68 11.7 65 11.5 Considerable 92 8.0 27 4.6 65 11.5 High 266 23.2 25 4.3 241 42.6
Figures are column percentages based on the cross-sectional sample in 2012. The GPs’ age was missing in 16 cases (where ‘likelihood of leaving’ had been expressed): these are excluded from the analysis.
Of the 566 GPs aged 50 or over (average current age = 55 years), 551 reported the age at which they planned to retire. The average reported age of planned retirement was 61 years, with a range of 52 to 76 years. When asked how likely it was that this would happen, 34.5% stated ‘definite’, with another 42.7% ‘very likely’ and 21.4% ‘quite likely’. Over half (55.2%, 304 of 551) of the respondents aged 50 or over planned to retire at an age within the next five years, and 87.2% of these said that it was either definite or very likely that this would happen. Only 11 of the 509 respondents aged under 50 (2.2%) who reported the age at which they were planning to retire reported an age that was within the next five years.
Table 13 shows that ‘intentions to quit’ are at their highest levels compared to previous surveys. The percentage of all respondents to the 2012 survey expressing considerable or high quitting intentions is considerably greater than in 2010. This is, in the main, due to the increase in quitting intentions expressed by GPs aged 50 or over.
Table 13: Trends in Intentions to Quit Considerable/high intention to
leave direct patient care within
five years All GPs GPs aged <50 GPs aged ≥50
1998 15.3% 5.6% n/a 2001 23.8% 11.4% n/a 2004 23.7% 13.1% n/a 2005 19.4% 6.1% 41.2% 2008 21.9% 7.1% 43.2% 2010 21.9% 6.4% 41.7% 2012 31.2% 8.9% 54.1%
n/a indicates that these figures were not presented in the corresponding reports/articles. All figures are based on the cross-sectional samples in the respective years.
Likelihood of changing working hours
Respondents were also asked to indicate whether the likelihood that they would either increase or (separately) reduce their working hours within the next five years. Possible responses to both questions were: none; slight; moderate; considerable; and high.
Table 14 shows that the majority (63%) of all respondents stated that there was no likelihood of them increasing their working hours over the next five years. Approximately 22% reported that there was a moderate, considerable or high likelihood. As with
intentions to quit, there were notable differences between GPs aged less than fifty and GPs aged fifty and over: in the former group, 29.4% stated that there was a moderate, considerable or high likelihood of working increasing hours, whereas in the latter group this figure was 13.7%. Five percent of GPs in each age stratum indicated a high likelihood of increasing their working hours. Over half of all respondents (55.7%) reported that there would be a moderate, considerable or high likelihood that they would be reducing their working hours within five years. However, nearly as many GPs reported that there would be no likelihood of working reduced hours as a high likelihood. Again, there were differences by age: a greater likelihood of reducing working hours was more prevalent amongst GPs aged fifty and over (74.2% moderate, considerable or high) than GPs aged less than fifty (37.8%). Almost half of the former group expressed a high likelihood of so doing.
Table 14: Likelihood of changing working hours within five years in 2012
Likelihood of changing working hours within five years (2012)
All GPs GPs aged <50 GPs aged ≥50 Increase Reduce Increase Reduce Increase Reduce
% % % % % % None 62.9 25.6 50.7 36.9 75.7 13.9 Slight 15.4 18.7 20.0 25.3 10.7 11.9 Moderate 8.4 12.5 12.3 14.5 4.3 10.3 Considerable 8.3 14.6 12.0 12.0 4.4 17.3 High 5.1 28.6 5.1 11.3 5.0 46.6
Figures are column percentages based on the cross-sectional sample in 2012. N = 1,149 for ‘increase hours’ (586 <50; 563 ≥50); N = 1,147 for ‘reduce hours’ (585 <50; 562 ≥50). GPs whose age was missing were excluded from the analysis.
Hours of Work
Sessions worked per week in 2012
We asked respondents how many sessions they worked in a typical week. Figure 1 shows that, in 2012, respondents most frequently reported working either 8 or 9 sessions per week, with a secondary peak at 6 sessions (corresponding to part-time working). The median number of sessions worked in a typical week was 8 (inter-quartile range = 6 to 9), whilst the mean number was 7.3 sessions per week (standard deviation = 2 sessions). The mean number of sessions worked in 2012 is lower than that observed in the 2010 survey (7.5 sessions; standard deviation = 2 sessions). Table 15 reveals that the reason for this is the substantial decline (approximately 6%) between 2010 and 2012 in the number of GPs working more than 8 sessions per week (in particular, 8.5 or 9 sessions per week), and the corresponding increase in the number of GPs working between 4 and 7 sessions per week (in particular, 5.5 or 6).
Figure 1: Distribution of sessions worked in a typical week in 2012
Data are based on the cross-sectional sample in 2012. N = 1,183 Mean = 7.3 sessions Std. Dev. = 2 sessions Median = 8 sessions IQR = (6, 9) sessions 0 5 10 15 20 25 30 Pe rce n ta g e o f G Ps 0 1 2 3 4 5 6 7 8 9 10 11 12 13 14 15 16 17 18 19 20
Sessions worked in a typical week
Table 15: Number of Sessions Worked in 2010 and 2012 Number of sessions worked in a typical week 2010 2012 % of GPs % of GPs #sessions ≤ 4 9.5 9.6 4 < #sessions ≤ 5 9.0 9.9 5 < #sessions ≤ 6 12.9 16.7 6 < #sessions ≤ 7 9.6 11.0 7 < #sessions ≤ 8 23.7 23.4 8 < #sessions ≤ 9 25.0 20.5 9 < #sessions ≤ 10 6.8 6.4 #sessions > 10 3.6 2.6
Figures for ‘% of GPs’ are column percentages based on the respective cross-sectional sample (N = 1,061 in 2010; N = 1,183 in 2012).
We also asked GPs to indicate when they worked their sessions. This was to identify those who were working ‘anti-social hours’. Of the 1,177 GPs who reported when they worked their sessions, 684 (58.1%) indicated that they worked at least one weekday evening session in a typical week, a slight increase from 2010 (57.2%), whilst 118 (10.0%) indicated that they worked at least one weekend session in a typical week, a decrease from 2010 (15.1%).
Average hours worked per week in 2012 GPs were asked:
How many hours do you spend, on average, per week, doing NHS GP-related work? (Please include ALL clinical and non-clinical NHS work but EXCLUDE OUT-OF-HOURS
WORK)
The mean number of weekly hours that the 1,112 respondents reported working was 41.7 (standard deviation = 13 hours) and the median number was 42 hours (Inter-Quartile Range
Nearly one-third of respondents (31.7%) reported working between 40 and 50 hours per week, whilst just over 20% reported working either 30 to 40 hours per week (20.4%) or 50 to 60 hours per week (21.6%). More than one in ten GPs (10.9%) reported that they worked 60 hours or more per week.
Figure 2: Distribution of ‘Average Weekly Hours Worked’ in 2012
Data are based on the cross-sectional sample in 2012.
Trends in average hours worked per week
The average number of hours worked per week increased slightly between 2010 and 2012 (Table 16), though the change is not statistically significant (t=0.53; p=0.594). An increase of a similar magnitude was also observed in the longitudinal sample. Average weekly hours spent on NHS GP-related work increased from 42.4 (standard deviation = 12.8 hours) in 2010 to 42.8 (standard deviation = 13.2 hours) in 2012 in this sample, though this too was not statistically significant (t=0.89; p=0.374).
0 5 10 15 20 Pe rce n ta g e o f G Ps 5 15 25 35 45 55 65 75 85 95 0 10 20 30 40 50 60 70 80 90 100
Table 16: Summary statistics for average weekly hours worked: 2008 – 2012
Year N Average Std. Dev. 95% C.I.
2008 634 42.1 13.0 41.1, 43.1
2010 1,054 41.4 12.9 40.6, 42.2
2012 1,112 41.7 13.0 40.9, 42.5
Figures are based on the cross-sectional samples in the respective years. In 2008, two different phrasings of the hours of work question were asked, with GPs randomly assigned to one or the other.
Prior to 2008, hours of work was elicited using a different phrasing of the question to that in 2010 and 2012:
How many hours per week do you typically work as a GP? (Please exclude any hours on call)
To enable comparison of the series over time, the two question formats were asked of random halves of the 2008 survey. Figure 3 illustrates these series graphically.
Figure 3: Trends in average weekly hours worked: 1998 – 2012
The figures for the longitudinal sample are based on data from GPs who responded in 2010 and 2012 (N = 1,498).
Association of Hours Worked to Sessions Worked
There was a substantial positive correlation between the number of sessions worked in a typical week and the number of hours spent doing NHS-related work in both years (0.65 in 2010; 0.58 in 2012). In 2012, GPs who indicated that they worked more than 8 sessions in a typical week also reported that they spent, on average, around 50 hours undertaking NHS-related work. Generally, the average number of hours worked per week was greater in 2012 than in 2010 for the corresponding number of reported sessions worked (Table 17).
42.1 41.4 41.7 44.4 45.7 44.4 38.9 40.1 42.4 42.8 36 38 40 42 44 46 48 1997 1998 1999 2000 2001 2002 2003 2004 2005 2006 2007 2008 2009 2010 2011 2012 2013 A v e rag e We e k ly Hours Wo rke d Survey Year
Table 17: Number of Sessions Worked and Average Hours Worked by GPs who work that number of sessions in 2010 and 2012
Number of sessions worked in a typical week 2010 2012 % of GPs Average Hours Worked % of GPs Average Hours Worked #sessions ≤ 4 9.5 23.7 9.6 26.0 4 < #sessions ≤ 5 9.0 30.5 9.9 31.3 5 < #sessions ≤ 6 12.9 35.0 16.7 35.4 6 < #sessions ≤ 7 9.6 39.4 11.0 41.4 7 < #sessions ≤ 8 23.7 46.3 23.4 46.0 8 < #sessions ≤ 9 25.0 47.3 20.5 50.1 9 < #sessions ≤ 10 6.8 49.6 6.4 50.0 #sessions > 10 3.6 55.1 2.6 53.5
Figures for ‘% of GPs’ are column percentages based on the respective cross-sectional sample (N = 1,061 in 2010; N = 1,183 in 2012). Figures for ‘hours worked’ are based on the average number for GPs who also report how many sessions they work in a typical week.
Out-of-Hours work
Respondents were asked if they undertook any out-of-hours work and, if so, on average, how many hours per week. Twenty-one percent (240/1,160) of respondents in the cross-sectional sample reported undertaking some out-of-hours work. This included 198 GP providers (19.6% of all providers who responded to the survey) and 42 non-provider GPs (25.6% of all such GPs in the survey). Overall, the proportion of GPs participating in out-of-hours work is unchanged from 2010 (where 218 out of 1,053 respondents reported doing so). This figure (218) consisted of 185 GP providers (20.4% of all such survey respondents) and 33 non-providers (22.8%). Compared to 2010, the proportion of GP providers participating in out-of-hours work has decreased slightly whilst the proportion of non-provider GPs participating has increased.
(inter-quartile range = 2 to 6), identical to that in 2010. The vast majority of GPs (84%) who reported working out of hours did so even though their practice had opted-out of out-of-hours working (Table 18).
Table 18: Practice opt-outs and out-of-hours work in 2012 Has your practice opted out
of ‘out-of-hours’ work?
N (%) [of 1,172 GPs]
Median weekly hours spent doing out-of-hours work (N)
Yes 1,059 (90.4%) 4.0 (192)
No 113 ( 9.6%) 3.0 ( 37)
Figures are based on the cross-sectional sample. Median weekly data on hours worked are calculated only for GPs stating that they undertook some out-of-hours work.
Data from the longitudinal sample broadly mirrors that of the cross-sectional sample, with one key difference. In 2010, 346 out of 1,545 respondents (22.4%) reported working out-of-hours (for a median of 4 hours); this percentage had declined to 16.9% (259 out of 1,536 respondents) in 2012 (median number of hours worked = 4). Two-hundred and nine GPs stated that they undertook some out-of-hours work in both years.
Extended opening hours
We asked GPs whether their practice offered extended hours access. Table 19 shows that 31.9% of respondents said that their practice offered access at weekends (372 of 1,165), 75.7% on weekdays (882 of 1,165) and 23.8% on both weekdays and at the weekend (277 of 1,165). All of these figures have decreased compared to the corresponding data from 2010, in particular that for weekend access (39.8%). Only 16.1% of respondents (188 of 1,165) replied that their practice did not offer any extended hours access; this is an increase compared to the corresponding figure in 2010 (10.2%).
Table 19: Extended Hours Access in 2010 and 2012
Does your practice have Extended Hours Access
2010 2012
N = 1,054 N = 1,165
On Weekdays 858 (81.4%) 882 (75.7%)
On Weekends 419 (39.8%) 372 (31.9%)
On Weekdays & Weekends 330 (31.3%) 277 (23.8%) No Extended Hours Access 107 (10.2%) 188 (16.1%) Data are based on ‘valid’ responses from the respective cross-sectional samples.
Percentage of time spent on various activities
In addition to asking GPs the number of hours worked on average per week, the questionnaire asked GPs to indicate how much time they spent on different aspects of their work, namely:
Direct patient care (e.g. surgeries; clinics; telephone consultations; home visits) Indirect patient care (e.g. referral letters; arranging admissions)
Administration (e.g. practice management; PCO meetings; etc)
Other (e.g. continuing education/ development; research; teaching; etc)
Table 20 shows the average percentages reported by respondents in the cross-sectional samples in 2005, 2008, 2010 and 2012 and in the longitudinal sample. In 2012, 62% of a GPs’ time was devoted to direct patient care, with 19% devoted to indirect patient care and 11% devoted to administration.
The respondents in the 2012 cross-sectional sample reported devoting a lower percentage of their time to direct patient care than respondents in the 2005, 2008 and 2010 cross-sectional samples. There has been a 0.7% increase in the percentage of time devoted to indirect patient care between 2010 and 2012. The changes in the longitudinal sample (in both 2010 and 2012) broadly mirror those for the cross-sectional sample. Respondents in the longitudinal sample reported small increases in the percentage of time devoted to
Table 20: Percentage of time devoted to different activities, 2005-2012 Type of activity Cross-sectional sample Longitudinal sample
2005 2008 2010 2012 2010 2012
Direct patient care 63.3 63.0 63.1 62.3 62.5 61.4 Indirect patient care 18.2 17.5 18.6 19.3 18.4 19.0 Administration 11.3 12.0 10.7 10.9 11.2 11.9 Other 7.1 7.5 7.6 7.5 7.9 7.7
Total 100.0 100.0 100.0 100.0 100.0 100.0
Figures are column percentages. Numbers may not sum to 100% due to rounding errors. N = 868 for the 2005 cross-sectional sample; 1,280 for the 2008 cross-sectional sample; 1,015 for the 2010 cross-sectional sample; 1,154 for the 2012 cross-sectional sample. N = 1,526 for the longitudinal sample.
Job Satisfaction
Questions on job satisfaction have been included in GP surveys since 1987. This section of this report provides summary statistics on these elements of the survey and analysis of recent trends. Respondents were asked to rate their satisfaction on nine specific domains and for their job ‘overall’ on a seven-point scale from ‘extremely dissatisfied’ (=1) to ‘extremely satisfied’ (=7).
Job satisfaction levels in 2012
Summary statistics for the cross-sectional sample are provided in Table 21. Mean overall job satisfaction is 4.54 points. Just over half of the respondents (56.7%) reported being satisfied with their job overall (scores of 5 or more), whilst less than one-quarter (22.5%) reported being dissatisfied (scores of 3 or less).
The nine individual aspects of the job are ranked in descending order of the mean score in Table 21. Respondents reported most satisfaction with their colleagues and fellow workers, physical working conditions and the amount of variety in the job. These domains had both the highest mean satisfaction scores and the greatest percentage of GPs indicating ‘satisfaction’: at least 3 out of every 4 respondents were satisfied with these aspects of the job and dissatisfaction was rare. Respondents displayed least satisfaction with their hours of work: fewer than half were satisfied (46.2%), whilst more than one-third (36.5%) were dissatisfied.
The ranking of job domains is almost identical whether we use the mean scores or the percentages reporting dissatisfaction or satisfaction. In the remainder of this section we summarise the job satisfaction responses using the mean scores.
Table 21: Summary statistics for job satisfaction in 2012
Job domain Mean %
dissatisfied
% satisfied
Colleagues and fellow workers 5.56 6.45 83.36
Physical working conditions 5.30 11.61 77.28
Amount of variety in job 5.28 9.67 77.01
Amount of responsibility given 5.16 11.56 71.68
Opportunity to use abilities 5.08 13.34 72.56
Freedom to choose own method of working 4.78 17.83 63.33
Remuneration 4.56 22.52 55.72
Recognition for good work 4.52 23.20 56.90
Hours of work 4.09 36.45 46.22
Overall Satisfaction 4.54 22.48 56.74
% dissatisfied = % rating 1, 2 or 3; % satisfied = % rating 5, 6 or 7. Figures are based on the 2012 cross-sectional sample. Range of N = 1,171 – 1,181.
Changes in satisfaction ratings from 2010
The changes in mean satisfaction ratings between 2010 and 2012 in the cross-sectional sample are shown in Table 22. The satisfaction domains are ranked from the largest change in ratings between 2010 and 2012 to the smallest change. Average satisfaction ratings for 1998, 2001, 2004, 2005 and 2008 are also shown.
The mean level of overall satisfaction of 4.54 in the cross-sectional sample in this survey is 0.33 points lower (t=-5.60; p<0.001) than the mean level reported in 2010 (Table 22). Mean levels of satisfaction have also decreased, to varying degrees, on seven of the nine individual domains. The most notable declines are in satisfaction with remuneration (0.31 points) and hours of work (0.30 points). Satisfaction with colleagues and fellow workers (by 0.02 points) and physical working conditions (by 0.07 points) have increased since 2010: these are the two highest ranked satisfaction domains in 2012.
Overall job satisfaction is at its lowest level since 2001. In terms of the overall series, satisfaction with particular aspects of the job such as remuneration, hours of work and amount of responsibility given are at a ‘mid-point’: that is, they are higher than in the surveys undertaken before the introduction of the new contract (1998, 2001 and 2004) but lower than in the surveys undertaken since. Levels of satisfaction with other aspects of the job are, in general, also higher in 2012 than in the years prior to the introduction of
the new contract. Levels of satisfaction with physical working conditions and (with the exception of 2010) variety in the job have never been so high.
A corresponding decrease of 0.38 points (t=-10.90; p<0.001) in overall satisfaction was observed in the longitudinal sample of 1,565 GPs who participated in both the 2010 and 2012 surveys (Table 23). Of the 1,541 respondents who reported their overall job satisfaction level in both years, 313 (20.3%) reported being more satisfied in 2012 than in 2010, 570 (37.0%) reported being equally as satisfied and 658 (42.7%) reported being less satisfied in 2012 than in 2010. Mean levels of satisfaction declined on all nine individual domains; remuneration and hours of work exhibiting the greatest changes, complementing the findings of the cross-sectional sample.
Table 22: Average satisfaction ratings over time
Satisfaction domain Mean Satisfaction Rating Change
’10 – ’12 1998 2001 2004 2005 2008 2010 2012
Remuneration 3.48 3.51 4.38 5.30 4.73 4.87 4.56 -0.31
Hours of work 3.70 3.32 3.94 4.86 4.21 4.39 4.09 -0.30
Amount of responsibility given 4.99 4.59 5.05 5.43 5.20 5.33 5.16 -0.17 Freedom to choose own method of working 4.87 4.35 4.66 5.00 4.65 4.91 4.78 -0.13
Recognition for good work 4.21 3.57 4.28 4.80 4.46 4.65 4.52 -0.13
Amount of variety in job 4.94 4.76 5.06 5.26 5.23 5.38 5.28 -0.10
Opportunity to use abilities 4.64 4.27 4.85 5.19 5.01 5.11 5.08 -0.03 Colleagues and fellow workers 5.31 5.37 5.60 5.65 5.49 5.54 5.56 +0.02 Physical working conditions 4.99 4.86 4.91 5.08 5.07 5.23 5.30 +0.07
Overall Satisfaction 4.65 3.96 4.62 5.21 4.68 4.87 4.54 -0.33
Domains ranked by greatest change from 2010 to least change. Figures are based on respective cross-sectional samples. Range of N for 2005 = 882 to 887; for 2008 = 1,275 to 1,289; for 2010 = 1,048 to 1,061; for 2012 = 1,171 to 1,181.
Table 23: Change in satisfaction ratings from 2010 – longitudinal sample Job Aspect Mean Satisfaction Rating Change ’08 – ’10 2010 2012 Remuneration 4.95 4.58 -0.37 Hours of work 4.28 3.96 -0.32
Amount of responsibility given 5.33 5.14 -0.19
Recognition for good work 4.67 4.48 -0.19
Freedom to choose own method of working 4.90 4.72 -0.18
Opportunity to use abilities 5.20 5.08 -0.12
Colleagues and fellow workers 5.61 5.54 -0.07
Amount of variety in job 5.42 5.37 -0.05
Physical working conditions 5.31 5.26 -0.05
Overall Satisfaction 4.92 4.54 -0.38
Domains ranked by greatest change from 2010 to least change. Range of N for 2010 = 1,547 to 1,553; for 2012 = 1,545 to 1,555.
Long-term trends in job satisfaction: 1987 – 2010
Changes in overall job satisfaction may, in part, reflect the changing composition of the GP workforce. In order to control for such potential changes, we directly-standardised the levels of overall job satisfaction observed in each survey to the age-sex composition of provider and salaried GPs in the 2011 GMS Statistics database. Mean levels of overall job satisfaction between 1987 and 2012 are shown in Figure 4.
Figure 4: Trends in mean overall job satisfaction: 1987 – 2012
Cross-sectional series has been standardised to the age-sex structure of the 2011 GMS Statistics database, with the exception of 1987 and 1990 for which the necessary figures are not available.
5.23 4.26 4.73 4.11 4.76 5.15 4.71 4.89 4.92 4.54 3.5 4 4.5 5 5.5 1986 1988 1990 1992 1994 1996 1998 2000 2002 2004 2006 2008 2010 2012 M e a n O v e ral l Sa tis fa c tio n Survey Year Cross-Section Longitudinal