A universal method to create complex reports in Excel
1
Introduction
All organizations have the need for creating reports and to analyze data. There are many suppliers, tools and ideas how to accomplish the need to help the organizations to create those reports. There is by all means no “best way” to do this and the purpose of this document is not to give a general overview but to concentrate on a specific method.
All organizations use spreadsheet programs and Excel is the far most used. This article describes a method how to create, produce and maintain reports in Excel format with data from one or many sources. The purpose is not to describe all possible functionalities but the main functions.
3
Reporting needs
There is a need for all kinds of reports. There is no simple way to classify those needs. A typical case is a financial report with data from just one system (the finance system). The report (for example with the purpose to be delivered to headquarter) can be very complex. Let’s assume an Excel file with many sheets. In each sheets there are many columns representing timeframes with values like actual/budget or prognoses. Each row can be a selection of account and/or cost centers. A column/row can also be a formula (with data from other sheets in the same workbook). But there should not be any links to other Excel files. Links may cause an instable solution if the net topology changes.
The content of the report can be much more complex with data from different source to be combined in key figures and built in functionality.
4
The problem and the challenge
A “good” solution to produce this complex report can be very hard to find. There are many pitch falls to avoid. At first everything changes. The layout and content of the report may change from one “day” to the next “day”. The organization changes (cost centers, structures), accounts are added etc. Sometimes there are luck of communications between those how decide upon changes and those how are responsible for reporting lets say a controller and between he/she and the programmer in the IT-department.
Very often the finance system doesn’t contain all information needed to fill the report. The figures are there but the rules (the combination of cost centers/accounts for a cell) is not find in the system. That might result in “hard soldered” questions built in the report generator used. When new accounts or cost centers are added the questions have to be modified. A lot of manual work is needed and there is a risk that the quality of the figures is not 100 % true.
5
Rules to fill an Excel file with data
In this case the result will be one Excel workbook (file). The workbook can consist of many worksheets with values and graphs etc. The workbook doesn’t contain any links to other workbooks. The first task is to find a method to describe how to map the data which are to be pasted into the specified cells in the worksheets. The workbook to start with is a template. The template it self is a complete design of the report but is empty.
A worksheet is a grid with columns and rows. Most common a column represents a time expression like Actual Month Actual (AMA), Year To Date Actual (YTDA), YTD budget YTDB etc or a formula like deviation between actual and budget values.
The time expression in a column can be separated in two parts: timestamp and Type Of Value (TOV). The timestamp is for example “Actual Month” AM and type of value “actual” A in short AMA. The timestamp can be the same for many columns and the TOV varies. AMB (Actual month budget). AMP1 (Actual month prognoses 1 ) etc.
The time resolution in an operating financial system is “each time a transaction can be completed” compared to aggregated time expected in a report. The important is to set the smallest resolution needed in the report like day or month etc . YTD then means the sum of all months up to actual month. You have two options one is to use a formula in Excel to sum the months or to sum the months into one YTD value and paste the value to the column. You can hide columns and rows. But
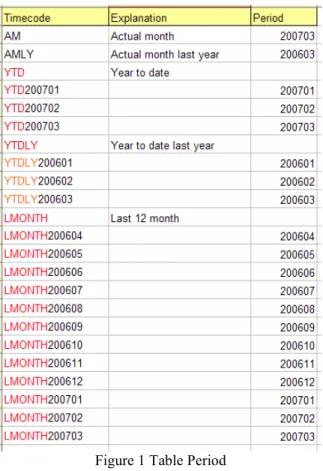
Copyright Gösta Munktell Munktell IT-Konsult AB 2007-04-10 Page 2 if the report is complex with many sheets and columns its much better to use neutral codes like AMA and let AM depend on the calendar. (Month 200703 AM is 200703 and YTD is 200701 +200702+ 200703). A running average like the mean value of the last 12 month can be expressed like (200604+200605+200606+200607+200608+200609+200610+200611+200612+200701+ 200702+ 200703) LMONTH . The sum is divided by 12. AMLY (Actual month last year) etc. Those rules are described in an Excel workbook with 3 columns and stored in a table as a rule, figure 1.
Figure 1 Table Period
AM and AMLY are single periods. YTD in red is “parent” to 200701, 200702 etc. The period is the calendar period in the host system. This way to describe what is included in a timeframe is very powerful as it is easy to maintain. For April 2007 AM is change to 200704 etc. LMONTH200604 is deleted and LMONTH200704 is added. It is also easy to use the query language SQL to extract the periods belonging to a parent.
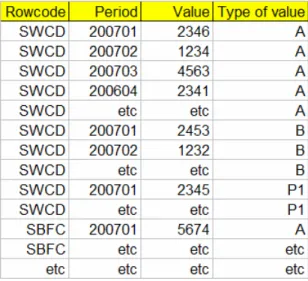
A row represents an aggregated sum of values for example a combination of accounts and or cost centers or a formula (sum of rows). Other figures like number of employee etc can also be included in the report). Each row to be pasted with data is coded with a unique code. If the rows are mapped exactly as found in the system e.g. accounting groups those codes of course can be used but otherwise you can invent a set of (non descriptive) codes like SWCD Salary white color sales department(s) , SBCF Salary blue color factories. Etc. The rules are stored in a table figure 2.
Figure 2 Table Rowcode A part of worksheet in the report template can look like figure 2.
Figure 2 Part of a sheet The red first row contains the codes how to fill the columns. The red first column contains the codes how to fill the rows.
The red column and row can be hided as they have no relevance for presentation purpose in the report.
The yellow cells are pasted with data. The “coordinate” for a cell is relative like (SWCD,AMA) row, column index. You can change the layout adding rows and columns without changing a line of code.
The data needed to fill the template (yellow cells) are stored in just one table. An example of table Data may look like:
Figure 3 Table Data
Copyright Gösta Munktell Munktell IT-Konsult AB 2007-04-10 Page 4
6
The Data warehouse and dataflow
Figure 4 Data warehouse and dataflow
There are one or more source systems. Each system has its own routines to fill the table Data in the Data warehouse DWH. The table Data is so to say the heart of the DWH as all data to be extracted is stored in just one table. In the example we have a finance system and there are rules for example table Rowcode about what information to be extracted to table Data. There is one routine which will create the report with data from table Data and rules in table Period. The technical specifications and routines are described in part 7.
7
Technical specifications and routines
The solution is based on Excel 2000 and up. A database like Access or SQL-server is used as a “data warehouse”. The programming language is VB (Visual Basic version VB6 or VB2005 or VBA Visual Basic for application and SQL. The routines to fill the data warehouse with data can vary depending on the capability of the source system. If the source system is ODBC (Open Database Connectivity) compliant (use a database like SQL-server, ORACLE, AS400 etc the technique to derive the data is strait forward. The data needed is aggregated over time. Very often the financial system has aggregated data in a table updated at least every day which can be used. If the system is not ODBC compliant or if it’s not possible for other reason to use ODBC a file output which read by a DTS (Data Transformation Services) package in SQL-server 2000 or SSIS (Microsoft SQL Server 2005 Integration Services) is an alternative. A controlling routine can be added. For example In table Rowcode figure 2 a combination of single accounts and intervals of accounts etc for cost centers define the code. If a new account or cost center is added in the financial system that probably will effect the report. A routine can test that. If the account etc already is within an interval no action needs to take place but if not the responsible person has to decide upon where to update the rules. The routine which will create the report will do something like:
- Open the template.xls file
- For each worksheet loop throw the columns in row one and store each column code e.g. AMA, AMLYA with the column number in a temporary table with two fields columncode and columnumber. Loop throw the rows in column one and store the rowcode in a temporary table with two fields rowcode and rownumber. Then the routine has knowledge about where
- to put the data cell(row, column) coordinates and the columncode and rowcode associated with each cell in the sheet.
The next step is to use a single SQL-statement involving tables Data, Period and the two temporary tables to create an output with just three fields column number, row number and value to be inserted into the cell. This output is stored in an internal VB array which is looped across the sheet to paste the values into the cells. Nothing else in the sheet will be affected. This routine is very fast because only one SQL-statement is used per sheet and the looping is performed with fast VB-code in a “none visible” Excel sheet. When all the sheets are updated the result is saved as an Excel file and distributed.
8
The multi source solution
The key issue in this solution is to put a code on all information (piece of data) which is to be included in the report and store that information in just one table Data. How the data is extracted from a source and loaded into Data is a separate issue for each source. Of course the codes used in the report have to be agreed upon. A row in the report can have code NUEMP which means number of employees. That make sense for a column code like AMA (Actual Month Actual in this case number) but not for YTDA (Year to date actual) in this case number as number of employees don’t aggregate over time. Presumably there are separate sheets for personality etc information in the report but links to perform key figures like income per head or cost per computer etc. can presented.