Charting the Course for
Energy Efficiency in New York
Lessons from Existing Programs
John Bowie
David Gahl
Nick Martin
Sam Swanson
Thomas Bourgeois, Jordan Gerow, Franz Litz and Nicholas Martin
Smarter, Cleaner, Greener
Contents
Introduction
A New Approach to Promoting Energy Efficiency
• EEPS Program Performance• Utility Programs
• High Performing EEPS Programs
• EEPS Program Delivered Significant Benefits
A Three-part Framework for Decision Making
• EEPS Program Performance• Geographic Equity • Income Equity
Recommendations
• An Empirical Review of EEPS Should Inform the Transition Plan
• Maintain NYSERDA Programs Until New Initiatives Demonstrate Results • Ensure Financing Programs and Direct Efficiency Incentive Programs
Work Together
Conclusion
Appendix A: Detailed Performance Data
1 2 11 12 13 14
Charting the Course for
Energy Efficiency in New York
Lessons from Existing Programs
Energy efficiency
must be deployed
at a greater scale
to meet what is arguably
the greatest environmental
challenge of our time
Introduction
ince its launch in 2008, the new York Public service commission’s (“Psc”) energy efficiency Portfolio standard (“eePs”) has resulted in significant energy savings in new York state. Based on data from the new York state Department of Public service (“DPs”), as of the third quarter 2014, eePs has reached 79.4 percent of its cumulative energy savings goals, or nearly 6.7 million
of its 8.4 million first-year megawatt hour saved (“MWh”) goal.1
eePs will expire at the end of 2015, and in an effort to reach new York Governor andrew cuomo’s goal to reduce climate-changing pollution by 80 percent by the year 20502, new York is revisiting the mechanisms it
has used to promote energy efficiency. Despite the success of the current programs, energy efficiency must be deployed at a greater scale to meet what is arguably the greatest environmental challenge of our time.
1 EEPS program reporting procedures disclose the energy savings expected during the first year of the particular energy efficiency measure’s implementation. EEPS programs will save significantly more energy than what is saved in the first year only. Life-cycle energy savings can be determined at the program level by multiplying the first year savings estimate by the expected effective useful life of the measure. The data reported in this report are presented to date. This includes prorated EEPS saving goals and budgets linearly scaled to reflect these metrics as of Q3 2014. They do not indicate the total saving goal and budget set for the program’s conclusion at the end of 2015.
2 N.Y. State Energy Planning Bd., 2014 Draft State Energy Plan Impacts & Considerations vol. II, at 8 (2014), http://energy-plan.ny.gov/Plans/2014.aspx (last visited Mar. 3, 2015).
Governor cuomo and the Psc are currently working to replace eePs with a new way of delivering incentives for energy efficiency through the Reforming the energy Vision (“ReV”) proceeding.3 the cuomo administration
now seeks to rely primarily on markets to achieve its energy policy objectives, including acquiring the economic and environmental benefits offered by end-use energy efficiency.
the move toward greater reliance on markets to achieve energy efficiency goals raises many short-term and long-term transition questions. how will new York avoid backsliding on progress toward its energy efficiency goals? how exactly will new York state meet or exceed current efficiency savings goals currently addressed by the new York state energy Research and Development authority (“nYseRDa”)? how quickly can nYseRDa reinstate resource acquisition efforts in the event that market approaches fail to produce results? how will electric and gas utilities incorporate energy efficiency into future rate case filings before the Psc? and how will all this happen while simultaneously animating a robust competitive market for energy efficiency services and technologies?
Documents released to date by the Psc and nYseRDa shed some light on these complicated questions but have not yet mapped out a clear transition strategy, nor a fully fleshed out vision of functioning, efficient, and competitive markets.
Regardless of whether one agrees that markets are the best tools to deliver energy efficiency, it will clearly take time for these new markets to mature. therefore, an effective transition strategy is critically important. Failing to deploy careful transition strategy could undermine new York’s impressive efficiency gains, squander ratepayer resources, and set back progress toward reducing carbon pollution.
the Pace energy and climate center (“Pace”) advances the following report to assist in creating that strategy. We start by reviewing eePs program performance. We believe that an effective transition strategy should be built upon lessons offered by existing program models. this report 1) describes the proposed changes to
energy efficiency delivery currently under consideration by the cuomo administration, 2) reviews overall 3 N.Y. State Pub. Serv. Comm’n, Order Adopting Regulatory Policy and Implementation
Plan14-M-0101 (February 2015) [hereinafter REV Order].
eePs performance through the third quarter of 2014, 3) recommends a framework to serve as the basis for future decision-making, and 4) makes additional recommendations for the future of energy efficiency efforts in new York state.
A New Approach
to Promoting Energy Efficinecy
For several decades, new York state public policy has recognized the important contribution energy efficiency makes in providing electricity consumers with high quality, low cost service, and achieving environmental goals. energy efficiency remains the lowest cost electricity supply option available to consumers, in many cases offers the lowest cost pathway to achieving grid capacity needs, and provides a low cost way to reduce carbon pollution. energy efficiency remains the focus of public policy for two important reasons. First, many well documented market barriers exist that impede consumer purchases of energy efficiency. second, many of the important benefits offered by energy efficiency benefit society more than they benefit the individual consumer.
Much of the progress new York state has achieved in tapping the bill reducing, grid strengthening, and pollution reducing benefits of energy efficiency may be attributed to the eePs program established by the Psc in 2008.4
Despite the success of the current approach, new York state is considering major changes to the way it promotes energy efficiency. the scale of the 80 by 2050 challenge requires greater deployment of energy efficiency resources. Further, although eePs has achieved tremendous amounts of energy savings, a significant amount of cost effective energy efficiency potential remains unrealized per studies conducted for nYseRDa as part of the Draft 2014 state energy Plan.5
While the previous approach for promoting energy efficiency relied on collecting surcharges from ratepayers and redistributing these funds as direct incentives to consumers, the cuomo administration 4 N.Y. State Pub. Serv. Comm’n, Order Establishing Energy Efficiency Portfolio Standard
and Approving Programs Case 07-M-0548 (June 2008).
5 N.Y. State Energy Research & Dev. Auth., Energy Efficiency and Renewable Energy Potential Study of New York State Final Report, vol. I, 18 (Apr. 2014) [hereinafter Energy Efficiency Report], http://www.nyserda.ny.gov/Cleantech-and-Innovation/ EA-Reports-and-Studies/EERE-Potential-Studies (last visited Mar. 3, 2015).
aims to create a new market-based system to catalyze investment in energy efficiency firms.6
in an effort to implement this major policy shift, in February 2015 the Psc issued an Order outlining the mechanics and structure of new York’s ReV.7 through
regulatory changes, electric utility rate design changes, and requiring electric utilities to take on new functions, new York’s ReV intends to create new markets for distributed energy resources including energy efficiency. the ReV track 1 Order (“ReV Order”), as well as earlier
documents released in the ReV case, recognizes that the new markets for energy efficiency will not appear overnight and that transition strategies would be needed.8
in response, the ReV Order proposes interim steps for maintaining utility investment in energy efficiency. specifically, the ReV Order holds each utility to their existing performance targets required under eePs. the ReV Order, however, stops short of requiring utilities to take on more responsibility for achieving energy efficiency savings. and it states that the combination of new utility targets and nYseRDa “metrics” developed for the transition would “equal or exceed the current aggregate of utility and nYseRDa energy savings.”9
to smooth the transition to new markets for energy efficiency, nYseRDa has put forward a draft proposal to establish a $5 billion, multi-year clean energy Fund (“ceF”)10. as described in nYseRDa’s september
2014 proposal, three new major market transformation initiatives fall under the ceF umbrella, and they look much different from the programs of the past. First, as proposed, the ceF replaces the existing suite of clean energy direct incentive programs with two new program portfolios: the Market Development Portfolio and the technology & Business innovation Portfolio. these portfolios intend to create a more favorable
environment for clean energy investment and market growth largely by reducing soft costs for clean energy
6 N.Y. State Dep’t Pub. Serv., Developing the REV Market in New York: DPS Straw Proposal on Track One Issues Case 14-M-0101 (Aug. 22, 2014) [hereinafter DPS Straw Proposal]. 7 REV Order, supra note 3.
8 N.Y. Dep’t Pub. Serv., Reforming the Energy Vision New York State Department of Public Service Staff Report & Proposal Case 14-M-0101, (Apr. 24, 2014), http://www3.dps. ny.gov/W/PSCWeb.nsf/96f0fec0b45a3c6485257688006a701a/26be8a93967e6 04785257cc40066b91a/$FILE/ATTK0J3L.pdf/Reforming%20The%20Energy%20 Vision%20%28REV%29%20REPORT%204.25.%2014.pdf
9 REV Order, supra note 3 at 81.
10 N.Y. State Energy Research & Dev. Auth., Clean Energy Fund Proposal Case 14-M-0094,
6 (Sept. 23, 2014) [hereinafter Clean Energy Fund Proposal].
firms. these new initiatives envision a much different role for the use of ratepayer dollars than the programs currently funded by ratepayers through eePs today. second, the ceF plan commits a major share of ratepayer funds to the new York Green Bank —a tool intended to mobilize private sector capital to build a
clean energy system.11
in late 2013, the Psc reallocated more than $200 million in uncommitted eePs, Renewable Portfolio standard (“RPs”), and systems Benefit charge (“sBc”) funds as well as auction allowance proceeds from the Regional Greenhouse Gas initiative (“RGGi”) to provide the initial capitalization of the Green Bank.12
the Green Bank has also petitioned the Psc for nearly $800 million more to complete its capitalization. third, the ceF proposal provides major funding for nY
sun—a $1 billion initiative that further promotes the development of distributed solar energy across new York. nY sun is intended to encourage the deployment of distributed solar while slowly phasing out subsidies for new York’s solar industry over several years. While nYseRDa’s current ceF proposal creates new initiatives, it also reduces the total amount of funding available for all public policy programs. Ratepayer collections to support clean energy initiatives will decrease from the current level of $925 million per year in 2015 to $350 million per year in 2025.13 under
the plan, most existing nYseRDa efficiency resource acquisition programs are halted in 2016 even though new initiatives promise little with respect to achieving near-term results.
this transition from resource acquisition to market transformation strategies raises many complicated questions for state regulators. how will new York avoid backsliding on progress toward its energy efficiency goals? how exactly will new York state meet or surpass energy efficiency savings goals currently addressed by nYseRDa? how quickly can nYseRDa reinstate 11 N.Y. Green Bank, Welcome to NY Green Bank, http://greenbank.ny.gov/About/Overview
(last visited Mar. 3, 2015).
12 N.Y. State Pub. Serv. Comm’n, Order Establishing New York Green Bank and Providing Initial Capitalization, 23 (Dec. 19, 2013).
13 N.Y. State Energy Research & Dev. Auth., Clean Energy Fund Forum Presentation Case 14-M-0094, 77.
How will New York
avoid backsliding
on progress
toward its energy
efficiency goals?
resource acquisition efforts in the event that market approaches fail to produce results? how will electric and gas utilities incorporate energy efficiency into future rate case filings before the Psc? and how will all this happen while simultaneously animating a robust competitive market for energy efficiency services and technologies? Pace recommends that the transition to ReV preserve the long established commitment to performance-based evaluations of benefits and costs that have provided a cornerstone for the design and evaluation of electric system planning. Pace advocates that the development of new strategies and the associated plans for changing existing efficiency market programs be guided by:
• a comprehensive integrated resource planning analysis of the potential contributions that energy efficiency may play in achieving grid service planning objectives, i.e., achieving optimal system efficiencies, securing universal, affordable service, and enabling the development of a resilient, climate-friendly energy system.
• Objective measurement and valuation based information to guide the conduct of the integrated resource planning based assessment of the
contributions energy efficiency should make and the pathways for using energy efficiency effectively.
• a commitment to ensuring the benefits of energy efficiency are allocated equitably among geographic regions of the state and populations targeted by current programs.
a key place to starting transition planning is by reviewing what actually worked and what did not under the current suite of programs. so we set about answering this question: how did the current eePs electricity programs actually perform?
EEPS Program Performance
established in June 2008 and reauthorized in 2011, eePs set out aggressive energy savings targets for energy efficiency and created a core objective of reducing forecasted statewide electricity usage by 15 percent by 2015, or ‘15 by ‘15.14 in its establishing
14 N.Y. State Pub. Serv. Comm’n, Order Establishing Energy Efficiency Portfolio Standard and Approving Programs Case 07-M-0548 (June 2008).
Order, the Psc adopted overall energy efficiency targets and a process for approving programs run by nYseRDa and investor owned utilities.15 in total,
utilities and nYseRDa administer 60 different energy efficiency programs for electricity.
While eePs is likely to fall short of reaching the overall ‘15 by ‘15 goal by the end of this calendar year, program
administrators have made significant progress toward reaching energy savings goals through the third quarter of 2014. With less than a year left in the effort, eePs has substantially achieved its to-date electricity savings targets. as shown in Figure 1, eePs has achieved 79.4 percent of the cumulative first-year energy savings
goals, or 6.7 million of its overall 8.4 million MWh goal, as of the third quarter of 2014.16
With respect to spending, the cumulative actual eePs program spending to date was $1.4 billion of the total amount budgeted to date of 1.6 billion, or 83.9 percent of the overall goal as shown in Figure 2. the electricity savings achieved by all the programs in the portfolio are running only slightly behind total spending to date in percentage terms.
15 In setting its targets, the PSC considered the contributions to the overall ‘15 by ‘15 goal that would be made by New York Power Authority and Long Island Power Authority, but then established savings targets for the entities under its jurisdiction. 16 All data on program performance was published by the New York State Department of
Public Service and analyzed through the third quarter of 2014.
F IGU R E 1 : EEPS MWh Goal Achievement
To Date (2014 Q3)
Figure 1. Acquired or Committed EEPS Electricity Savings To Date (2014 Q3)
21%
79%
�MWh Goal Not Yet Acquired or Committed
Utility Programs
together, the six investor-owned utilities are responsible for acquiring approximately 32 percent of the overall eePs savings goals with nYseRDa responsible for the rest.
new York’s utilities have been largely successful in achieving their energy savings targets. Figure 3 shows the actual first-year electric savings under eePs versus the savings targets to date by program administrator. as the figure shows, central hudson
is slightly ahead of its savings targets, achieving 173,740 MWh, or 101
percent, of its target of 171,249 MWh. every other
utility except Orange and Rockland is within 90 percent of their targets to date with consolidated edison achieving the highest amount of first-year MWh savings in total, at nearly 852,366 MWh. Orange and Rockland has achieved only 73 percent of its savings target to date. appendix a provides more detailed information on utility program performance.
EEPS Program Administrator Number of EE Programsa
Central Hudson 6
Consolidated Edison 9
National Grid 8
New York State Electric & Gas 8 New York State Energy
Research & Development Authority 17
Orange & Rockland 4
Rochester Gas & Electric 8
Total 60
F IGU R E 2 : EEPS Electric Programs Budget
Progress To Date (2014 Q3)
TA BL E 1 : Electricity Energy Efficiency
Programs Under PSC Jurisdiction
Figure 2. EEPS Electricity Spending to Date (2014 Q3)
16%
84%
�Budget Not Yet Spent
�Budget Expended or Encumbered
New York’s
utilities have been
largely successful
in achieving
their energy
savings targets.
a. Number of EE programs include programs that have been closed and/or consolidated but at one point were active.
F IGU R E 3 : Utility First-Year Savings to Date vs. Target to Date First-year MWh Saved 0 400,000 600,000 1,000,000 1,200,000 800,000 200,000
Central Hudson Con Edison NYSEG National Grid Orange & Rockland RG&E
Figure 3. Utility First-Year Savings to Date vs. Target to Date
�First-year Savings to Date
�Target to Date
NYSERDA Programs
nYseRDa is responsible for achieving more than two-thirds of the total eePs energy savings goals. through september 2014, nYseRDa’s efforts
accounted for more than 4.1 million MWh of acquired or committed first-year savings. nYseRDa initiatives have delivered nearly twice as much as all the utility programs combined with more than 62 percent of the total amount of energy saved. Further, nYseRDa’s energy efficiency efforts are also targeted at historically harder to reach sectors such as multi-family housing, where split incentives and complicated landlord tenant relationships have posed significant barriers to making energy efficiency improvements.
High Performing EEPS Programs
Drilling down into program performance, Pace analyzed the eePs electricity portfolio using key metrics
including a program’s percent of actual savings versus its targeted savings and dollars spent per kWh saved. We also calculated the program’s contribution toward the overall energy efficiency savings objective. to summarize the cost efficiency of the programs
reviewed, we made a conservative, simplifying
First-year MWh Saved
First-year Savings to Date Target to Date 0 3,000,000 4,000,000 6,000,000 7,000,000 5,000,000 2,000,000 1,000,000
Figure 4. NYSERDA First-Year Savings to Date vs. Target to Date
F IGU R E 4 : NYSERDA First-Year Savings
to Date vs. Target to Date
assumption that the average electricity savings life of efficiency measures is ten years, a savings production life that is shorter than most measures (e.g., hVac improvements) and longer than some (e.g., lighting upgrades). We report costs in terms of cost per saved kWhs.
F IGU R E 5 : EEPS Savings Targets to Date
by Program Administrator
Figure 5. First-Year Savings Targets to Date by Program Administrator
2% 68% 11% 3% 13% 1% 2% � Central Hudson �Con Edison �NYSEG �National Grid �Orange & Rockland �RG&E
�NYSERDA
Figure 5. First-Year Savings Targets to Date by Program Administrator
2% 68% 11% 3% 13% 1% 2% � Central Hudson �Con Edison �NYSEG �National Grid �Orange & Rockland �RG&E
�NYSERDA
Figure 5. First-Year Savings Targets to Date by Program Administrator
2% 68% 11% 3% 13% 1% 2% � Central Hudson �Con Edison �NYSEG �National Grid �Orange & Rockland �RG&E
�NYSERDA
Figure 5. First-Year Savings Targets to Date by Program Administrator
2% 68% 11% 3% 13% 1% 2% � Central Hudson �Con Edison �NYSEG �National Grid �Orange & Rockland �RG&E
�NYSERDA
Program
Administrator Program Name Sector Cost per kWh Acquired & Committed Assuming 10-year Lifecycle
Percent of Overall Total MWh Acquired & Committed to Date NYSERDA Industrial & Process Efficiency Program Commercial $0.0149 19.6%
NYSERDA CFL Expansion Program Residential $0.0027 15.5%
NYSERDA FlexTech Expansion Program Commercial $0.0086 8.7%
NYSERDA Existing Facilities Program Commercial $0.0232 8.1%
National Grid Small Business Direct Install Program Commercial $0.0275 7.6%
NYSERDA New Construction Program Commercial $0.0337 7.3%
Con Edison Small Business Direct Install Program Commercial $0.0349 5.7%
National Grid Energy Initiative - Commercial
& Industrial Electric Program Commercial $0.0209 3.8%
Con Edison C&I Equipment Rebate Program Commercial $0.0256 3.3%
Con Edison C&I Custom Efficiency Program Commercial $0.0210 2.1%
TA BL E 2 : Top 10 Programs in % of Total Overall MWh Acquired and Committed to Date (2014 Q3)
Our analysis does not include the costs paid by others, such as the ultimate owner of the efficiency improvement. in other words, we are looking only at the program cost of providing the incentive that moves the end use consumer to invest in efficiency, not the total cost of achieving the savings.
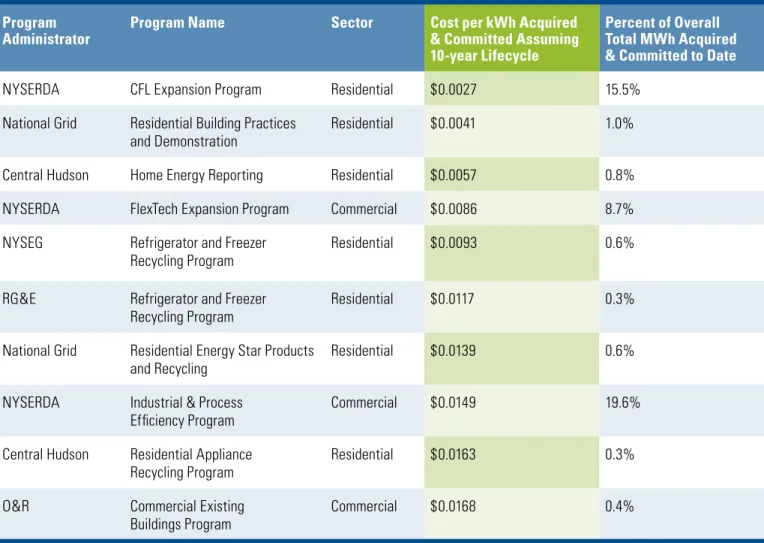
Based on this analysis, Pace identified the following high performing eePs programs and presents the results in tables 2 and 3.
NYSERDA RUNS MANY TOP PERFORMING PROGRAMS
• Of the 60 programs, three appear in the top ten of both program size and cost efficiency categories, all administered by nYseRDa. not only do these efforts make up a huge portion of the acquired eePs overall savings, they are also top performers on a dollar spent per kWh basis.
• Five nYseRDa programs are among the top ten efforts with respect to their contribution to the total energy savings listed in table 2, accounting
energy savings. consolidated edison and national Grid run the remaining five.
• as shown in Figure 6, of all of the programs run by the utilities and nYseRDa, ten programs are responsible for more than 80 percent of the acquired or committed energy savings to date. and nine out of the ten efforts responsible for the bulk of energy efficiency savings were in the commercial and industrial sector, although nYseRDa’s residential cFl expansion Program resulted in significant energy savings as well.
• as shown in Figure 7, the majority of savings are acquired from the commercial sector at 76 percent of all savings. the residential sector consists of 21 percent of all savings and multi-family only accounts for three percent.
Program
Administrator Program Name Sector Cost per kWh Acquired & Committed Assuming 10-year Lifecycle
Percent of Overall Total MWh Acquired & Committed to Date
NYSERDA CFL Expansion Program Residential $0.0027 15.5%
National Grid Residential Building Practices
and Demonstration Residential $0.0041 1.0%
Central Hudson Home Energy Reporting Residential $0.0057 0.8%
NYSERDA FlexTech Expansion Program Commercial $0.0086 8.7%
NYSEG Refrigerator and Freezer
Recycling Program Residential $0.0093 0.6%
RG&E Refrigerator and Freezer
Recycling Program Residential $0.0117 0.3%
National Grid Residential Energy Star Products
and Recycling Residential $0.0139 0.6%
NYSERDA Industrial & Process
Efficiency Program Commercial $0.0149 19.6%
Central Hudson Residential Appliance
Recycling Program Residential $0.0163 0.3%
O&R Commercial Existing
Buildings Program Commercial $0.0168 0.4%
TA BL E 3 : Top 10 Cost Efficient Programs to Date (2014 Q3)
F IGU R E 6 : Ten Programs Run by NYSERDA, Con
Edison, and National Grid Compose Over 80% of EEPS First-Year Savings
Figure 6. Ten Programs Run by NYSERDA, Con Edison, and National Grid Compose Over 80% of EEPS First-Year Savings
12% 11% 18% 59% �NYSERDA � National Grid �Con Edison � All Other Programs
Program
Administrator Program Name Sector Cost per kWh Acquired & Committed Assuming 10-year Lifecycle
Percent of Overall Total MWh Acquired & Committed to Date
NYSERDA CFL Expansion Program Residential $0.0027 15.5%
National Grid Residential Building Practices
and Demonstration Residential $0.0041 1.0%
Central Hudson Home Energy Reporting Residential $0.0057 0.8%
NYSERDA FlexTech Expansion Program Commercial $0.0086 8.7%
NYSEG Refrigerator and Freezer
Recycling Program Residential $0.0093 0.6%
RG&E Refrigerator and Freezer
Recycling Program Residential $0.0117 0.3%
National Grid Residential Energy Star Products
and Recycling Residential $0.0139 0.6%
NYSERDA Industrial & Process
Efficiency Program Commercial $0.0149 19.6%
Central Hudson Residential Appliance
Recycling Program Residential $0.0163 0.3%
O&R Commercial Existing
Buildings Program Commercial $0.0168 0.4%
F IGU R E 7 : EEPS MWh Savings by Sector
Figure 7. Ten Programs Run by NYSERDA, Con Edison, and National Grid Compose Over 80% of EEPS First-Year Savings
76% 3% 21% �Residential � Commercial �Multi-family
MANY EEPS PROGRAMS DElIvERED RESUlTS AT VERY LOW COST
• For many eePs programs the program delivery cost is very small. Five out of ten eePs program resulted in costs less than one cent per kWh.
• these five efforts resulted in nearly 25 percent of eePs overall acquired energy savings.
• the remaining eePs programs resulted in costs less than two cents per kWh to acquire savings.
• seven residential programs make the list of the top ten eePs programs with the lowest program cost/ kWh. utilities run seven out of ten programs with nYseRDa running the three remaining programs.
EEPS Program Delivered Significant Benefits
By a number of different measures, the eePs program has delivered significant benefits. For the first two full years of the program, 2010 and 2011, the combined investment of the utilities and nYseRDa is estimated to have created more the 1,000 jobs.17 the stream of energy
savings produced by eePs has significantly reduced pollution. the total energy savings realized by eePs electricity programs is equivalent to reducing more than 17 DPS Straw Proposal, supra note 4, at 26.
4.6 million metric tons of carbon dioxide equivalent, or the emissions from nearly 1 million automobiles every year.18
Further, Pace estimates the monetary benefits from avoided energy generation and capacity expansion resulting from acquired energy savings to date is approximately $4 billion dollars, providing a nearly 3:1 ratio of benefit to cost. While a detailed study was outside the scope of this report, Pace derived this estimate using similar simplifying assumptions as DPs staff in their 2007 analysis of eePs program benefits estimation19 and a 2009 Psc order that
documents forecasted energy and capacity prices for benefit estimation.20 table 4 presents the annual
18 Clean Energy, Greenhouse Gas Equivalency Calculator, http://www.epa.gov/cleanen-ergy/energy-resources/calculator.html#results (last updated Apr. 16, 2014). 19 N.Y. State Dept. of Pub. Serv., Preliminary Staff Analysis Case 07-M-0548, Benefits
and Costs and Bill Impacts of Energy Efficiency Program for 15 Percent Reduction in Electricity Usage by 2015 (June 1, 2007).
20 N.Y. State Pub. Serv. Comm’n, Order Approving “Fast Track” Utility-Administered Electric Energy Efficiency Programs with Modifications Cases 08-E-1003, 08-E-1007, 08-E-1014, and 08-E-1019 (January 2009).
Year Accumulated Net Energy Savings (MWh) Cost of Energy* ($2015/MWh) Energy
Cost Savings Marginal Generation Capacity Costs ($2015/kW-year) Marginal Distribution Capacity Costs ($2015/kW-year) Capacity Cost Savings ($2015/kW-year) 2010 137,542 $68.90 $9,476,004.29 $92.20 $74.15 $2,611,878.74 2011 865,241 $64.13 $55,490,005.30 $95.61 $74.15 $16,767,459.82 2012 2,125,454 $51.78 $110,045,496.16 $98.78 $74.15 $41,957,305.06 2013 2,944,859 $65.42 $192,642,800.69 $105.29 $74.15 $60,321,225.68 2014 3,814,379 $65.18 $248,634,328.72 $106.11 $74.15 $78,487,656.53 2015 4,678,292 $64.95 $303,856,084.15 $104.72 $74.15 $95,522,568.37 2016 4,678,292 $65.10 $304,569,459.84 $112.39 $74.15 $99,619,359.26 2017 4,678,292 $65.26 $305,324,798.82 $122.59 $74.15 $105,068,892.12 2018 4,678,292 $65.43 $306,080,137.79 $125.58 $74.15 $106,664,890.32 2019 4,678,292 $65.59 $306,835,476.77 $128.37 $74.15 $108,151,126.55 2020 4,540,749 $65.75 $298,547,599.15 $130.96 $74.15 $106,316,110.73 2021 3,813,051 $65.91 $251,318,156.03 $133.38 $74.15 $90,329,725.38 2022 2,552,838 $66.07 $168,669,682.08 $133.38 $74.15 $60,475,753.03 2023 1,733,433 $66.23 $114,810,289.36 $133.38 $74.15 $41,064,363.58 2024 863,913 $66.39 $57,358,930.80 $133.38 $74.15 $20,465,762.95 Total: $3,033,659,249.95 $1,033,824,078.11
TA BL E 4 : Estimated Generation & Capacity Benefits from EEPS Energy Savings
estimated energy and capacity savings emanating from eePs programs.
Our analysis conservatively assumes eePs programs will provide energy savings for only ten years after implementation, and we only include benefits for actual energy savings acquired through Q3 of 2014. energy generation savings were calculated using average annual energy costs for new York as reported as the average locational based marginal price by the new York independent system Operator
for years 2009 through 2014. For future years, our analysis assumes the same annual energy cost growth rate as in the 2009 Psc order. this method incorporates the significant energy cost decrease caused by the price drop of natural gas in which the original
Pace estimates the
monetary benefits
resulting from
acquired energy
savings to date
is approximately
$4 billion dollars.
eePs estimates did not anticipate. Finally, marginal generation and distribution costs were assumed to be the same as estimated in the 2009 Psc order. all monetary values were normalized to 2015 dollars.
A Three-part Framework
for Decision Making
Pace believes empirical analysis should inform the long-term transition planning included in the ceF. We recommend state regulators use a three-part framework that considers 1) eePs actual program performance, 2) equity in terms of geographic regions of the state, and 3) equity in terms of populations targeted by current efforts.
this three part framework should also be supported with a sustained commitment to performance
measurement and evaluation—a commitment that the Psc has made repeatedly as it has developed effective policies and programs to capture the benefits offered by improvements in end use energy efficiency.
EEPS Program Peformance
the analysis of eePs performance presented above is a starting point for the kind of comprehensive review that will help decision makers, but we recognize its limitations. For example, the analysis does not take into account the maturity of programs. some assessment should be made of which
programs are getting up and running and which ones are well established.
this analysis also does not consider the extent to which current programs have captured the cost effective potential in their sectors. We remain convinced, however, that the efficiency well runs deep. Macro economic analysis prepared for the Draft 2014 new York state energy Plan shows that cost effective electric energy efficiency measures could save 36 percent of the forecasted energy consumption in 2020 (approximately 66,000 GWh saved) and 45 percent of forecasted energy consumption in 2030 (approximately 92,000 GWh saved).21
21 Energy Efficiency Report, supra note 5, at 21.
in the end, however, Pace believes its analysis presents several important findings. eePs has demonstrated considerable success. Many nYseRDa run programs and utility run efforts have resulted in significant energy savings at low cost. these efforts have also resulted in significant grid benefits and helped reduce carbon pollution emissions.
Geographic Equity
Performance alone however is not the only screen for making judgments about the future of new York’s energy efficiency measures. another important consideration is geographic distribution. During the transition, state regulators must ensure there is equal access to energy efficiency services and incentives across the state. commercial and industrial customers in utica should have the same access to energy efficiency services and incentives as customers in new York city. state regulators should strive for fair access to energy efficiency services for all new Yorkers and that all new Yorker’s have the opportunity to benefit from the bill saving opportunities provided by energy efficiency. While benefits should be available to all, future
incentives should also recognize that energy efficiency can also play a strategic role in avoiding long-term infrastructure costs. energy efficiency, demand management and demand response programs more generally, may also be implemented to address overloaded areas of the distribution system.
Income Equity
an additional consideration for policy makers involves the customer segments targeted by current efforts. and the good news is both the ReV Order and the Draft ceF plan, emphasize that much of nYseRDa’s remaining energy efficiency work will be focused on low to moderate- income consumers.22 state
regulators should ensure that energy efficiency services and short-term incentives enable lower-income consumers to reap the benefits of using energy more efficiently. Based on a variety of barriers, including perceived barriers such as potential financial
22 N.Y. State Pub. Serv. Comm’n, Order Commencing Clean Energy Fund Proceeding
risk, these consumers may not be targeted by utility programs. they may also not be served by to-be-created distributed energy resource markets under consideration by policymakers.
Failure to target and reach these sectors could result in unintended load pockets and strain on the grid itself. We strongly support this approach. Without a special focus on lower-income and middle-income populations in future program designs, some consumers may be quite literally left in the cold.
Recommendations
An Empirical Review of EEPS Should Inform
the Transition Plan
to chart a course of the future of energy efficiency delivery in new York, a thorough analysis of eePs program results should be conducted. empirical data on current program performance, by all program administrators, should guide the transition toward market-based policies. this performance based
assessment will inform an integrated resource planning assessment of the opportunities energy efficiency may play in meeting electricity system goals.
the periodic eePs program reporting, the extensive eePs program impact and process evaluation work completed to date, and the eePs technical Manual provide a solid foundation for such analyses. the information should be provided to the public and interested parties in an easy to understand format. such analysis would not be ponderous. We encourage regulators to engage in a nimble evaluation and planning process, but one that is based on observations of program performance, changes in market dynamics, and evolving technology. upon completion of the analysis, all energy stakeholders would be in a better position to assess the energy
efficiency portfolio of programs as well as make informed recommendations about which programs should continue for several years under the auspices of the ceF. state regulators should strive to better understand what worked under eePs, what did not, and how those lessons inform future program designs.
Maintain NYSERDA Programs
Until New Initiatives Demonstrate Results
the summary review of many high-performing nYseRDa energy efficiency programs offered here suggests that many nYseRDa programs should be maintained during the transition. the record of performance shows nYseRDa programs, such as the nYseRDa’s industrial and Process efficiency Program, deliver significant energy savings in a cost effective manner. these efforts should remain funded at considerable levels until new efforts demonstrate significant progress toward achieving energy savings goals. all new energy efficiency efforts should also be subjected to a performance assessment based on evidence and verifiable reporting of energy savings
These efforts should
remain funded
at considerable
levels until new
efforts demonstrate
significant progress
toward achieving
energy savings goals.
Ensure Financing Programs
and Direct Efficiency Incentive Programs
Work Together
as eePs comes to its end and new tools become the predominate mechanism for encouraging clean energy resources, the new York Green Bank may become a key effort to mobilize investment in energy efficiency firms. however, financing strategies by themselves are unlikely to be a silver bullet for meeting new York’s energy efficiency needs.
a recent on-the-ground review of energy financing efforts supports this view. the energy Futures Group analyzed the role of financing in energy efficiency market transformation by reviewing pilot programs in four jurisdictions. they conclude that a combination of “financing and other strategies is likely needed to achieve long-term energy efficiency goals.”23 new
financing options by themselves are not likely to stimulate significant consumer interest in energy
23 Chris Kramer, Energy Futures Group, ACEEE Summer Study on Energy Efficiency in Buildings. Residential Financing on the Ground: Lessons Learned from Programmatic Examples (2014), at 6-175.
efficiency.24 instead, the effort that generated the
most participation included a combination of financing options and direct incentives.25
Given the importance of using direct incentives and financing to achieve long-term energy outcomes, the commission should have a clear picture of the efforts that will complement Green Bank financing to achieve its goals. the framework advanced in this paper will help establish high performing programs and help clarify the future of energy efficiency delivery.
Conclusion
the cuomo administration’s interest in increasingly relying on markets to deliver clean energy outcomes may be exactly on target. the magnitude of the 80 by 2050 goal requires innovation and maximizing the use of ratepayer contributions for public policy goals. new tools such as the new York Green Bank may be successful in encouraging greater energy efficiency gains than have been delivered to date. and given the enormous energy efficiency potential that has yet to be acquired, innovative approaches should be tested at significant scale.
these efforts must succeed. at the same time, new York should not take steps backward during the transition to new approaches for promoting clean energy. efficiency program planning and deployment must remain dynamic, responding to changing technology and market conditions, but also must be based on evidence of the capacity of existing and new program designs to achieve results.
as new York maps out a path to new policy designs and establishes transition strategies, regulators must take the time to learn the lessons from the past. the current period of transition should be informed
by empirical analysis of energy efficiency program performance. in the final analysis, Pace recommends new York takes a more gradual transition and assess how the nYseRDa’s new efforts perform in delivering efficiency outcomes before phasing out proven programs that have delivered cost effective results.
24 Id. at 6-179. 25 Id. at 6-175.
Program
Administer Program Name Sector MWh Target to Date Net First-Year MWh Acquired & Committed Percent of MWh Target Acquired Percent of MWh Target Acquired & Committed Budget to Date Total Expenditures & Encumbrances Percent of Budget Expended Percent of Budget Expended & Encumbered Expended & Encumbered Cost per MWh Acquired & Committed Expended & Encumbered Cost per kWh Acquired & Committed Assuming 10-year Lifecycle Percent of Overall Total MWh Acquired & Committed to Date Central Hudson Mid-Size Commercial Business Program Commercial 25,154. 26,133.879 100.58% 103.90% $8,281,441.75 $7,267,188.58 84.19% 87.75% $278.08 $0.03 0.39%
Central Hudson Small Business Direct Install Program Commercial 93,073.5 69,949.424 73.63% 75.16% $24,217,531.55 $18,772,125.50 75.71% 77.51% $268.37 $0.03 1.05% Central Hudson Expanded Residential HVAC Program Residential 0.00 0.00 N/A N/A $23,800.00 $23,800.00 100.00% 100.00% N/A N/A 0.00% Central Hudson Residential HVAC Program Residential 4,839. 6,318.198 130.37% 130.57% $4,790,111.75 $5,294,649.00 110.43% 110.53% $838.00 $0.08 0.10% Central Hudson Residential Appliance Recycling Program Residential 9,182.5 16,941.551 182.25% 184.50% $3,983,688.25 $2,758,297.00 69.03% 69.24% $162.81 $0.02 0.25% Central Hudson Home Energy Reporting Residential 39,000. 54,397.282 139.48% 139.48% $2,941,232.77 $3,100,213.00 105.41% 105.41% $56.99 $0.01 0.82% Con Edison Small Business Direct Install Program Commercial 437,281.5 376,431.338 84.68% 86.08% $145,735,109.33 $131,271,525.40 89.25% 90.08% $348.73 $0.03 5.67% Con Edison C&I Equipment Rebate Program Commercial 263,123.5 217,402.158 57.47% 82.62% $144,642,473.72 $55,563,337.76 34.10% 38.41% $255.58 $0.03 3.27% Con Edison C&I Custom Efficiency Program Commercial 57,664.25 140,793.884 164.11% 244.16% $30,780,858.71 $29,564,703.90 71.62% 96.05% $209.99 $0.02 2.12% Con Edison Multifamily Energy Efficiency Program Multi-Family 39,569.5 48,937.196 117.12% 123.67% $35,023,194.00 $26,090,543.75 71.85% 74.50% $533.14 $0.05 0.74% Con Edison Residential Direct Installation Program Residential 14,700.5 2,663.099 18.12% 18.12% $7,933,991.90 $5,599,496.88 70.58% 70.58% $2,102.62 $0.21 0.04% Con Edison Residential HVAC Program Residential 7,367. 6,443.578 87.47% 87.47% $15,600,528.85 $12,025,276.09 77.08% 77.08% $1,866.24 $0.19 0.10% Con Edison Residential Room Air Conditioning Program Residential 8,053. 3,213.459 39.90% 39.90% $5,095,817.00 $4,333,570.63 85.04% 85.04% $1,348.57 $0.13 0.05% Con Edison Residential Electric Program Residential 18,925.5 23,854.616 119.89% 126.04% $8,136,727.50 $12,109,529.62 143.21% 148.83% $507.64 $0.05 0.36% Con Edison Appliance Bounty Program Residential 32,696. 17,402.2 53.22% 53.22% $10,663,197.60 $4,023,280.67 37.73% 37.73% $231.19 $0.02 0.26% National Grid Small Business Direct Install Program Commercial 547,248.75 505,166.454 92.31% 92.31% $139,040,842.42 $139,005,678.30 99.97% 99.97% $275.17 $0.03 7.60% National Grid Energy Initiative - Commercial & Industrial Electric Program Commercial 326,345.25 251,467.817 58.61% 77.06% $60,722,329.25 $52,650,105.74 71.03% 86.71% $209.37 $0.02 3.78% National Grid Energy Initiative Program - Large Industrial Commercial 43,865. 41,481.007 94.57% 94.57% $12,498,792.80 $8,204,811.11 65.64% 65.64% $197.80 $0.02 0.62% National Grid Energy Initiative Program - Mid-Size C&I Commercial 113,707. 107,170.506 94.25% 94.25% $21,212,899.60 $19,214,825.33 90.58% 90.58% $179.29 $0.02 1.61% National Grid Enhanced Home Sealing Incentives Program Residential 7,458. 108.326 1.45% 1.45% $4,215,150.00 $638,755.57 15.15% 15.15% $5,896.60 $0.59 0.00% National Grid Residential HVAC Program Residential 197.25 1,345.246 682.00% 682.00% $730,170.00 $2,276,838.36 311.82% 311.82% $1,692.51 $0.17 0.02% National Grid Residential Energy Star Products and Recycling Residential 34,157.5 42,859.944 125.48% 125.48% $13,575,968.00 $5,940,246.47 43.76% 43.76% $138.60 $0.01 0.65% National Grid Residential Building Practices and Demonstration Residential 49,815. 66,021.33 132.53% 132.53% $2,575,789.15 $2,690,825.59 104.47% 104.47% $40.76 $0.00 0.99% NYSEG C&I Custom Rebate Program Commercial 11,281. 8,003.14 70.94% 70.94% $4,387,517.05 $3,071,210.70 70.00% 70.00% $383.75 $0.04 0.12% NYSEG C&I Prescriptive Rebate Program Commercial 4,995. 2,953.316 59.13% 59.13% $2,328,890.80 $1,115,762.18 47.91% 47.91% $377.80 $0.04 0.04% NYSEG Block Bidding Program Commercial 9,584. 6,958.389 72.60% 72.60% $3,189,131.00 $2,353,627.10 73.80% 73.80% $338.24 $0.03 0.10% NYSEG C&I Electric Program Commercial 43,994.5 49,260.166 79.97% 111.97% $16,333,817.50 $14,873,029.02 68.26% 91.06% $301.93 $0.03 0.74% NYSEG Small Business Direct Install Program Commercial 145,483.5 116,281.818 75.39% 79.93% $37,202,883.26 $33,315,918.14 84.28% 89.55% $286.51 $0.03 1.75% NYSEG Multifamily Program Multi-Family 5,142. 11,956.876 202.84% 232.53% $3,576,458.35 $2,641,980.57 65.58% 73.87% $220.96 $0.02 0.18% NYSEG Energy Saver Program Residential 14,446. 731.7 5.07% 5.07% $664,382.00 $417,563.43 62.85% 62.85% $570.68 $0.06 0.01% NYSEG Refrigerator and Freezer Recycling Program Residential 16,353.75 42,548.075 252.09% 260.17% $4,898,749.81 $3,962,028.18 79.09% 80.88% $93.12 $0.01 0.64% NYSERDA Agricultural Disaster Program Commercial 2,500. 1,551.195 61.26% 62.05% $5,568,580.80 $4,766,794.41 77.82% 85.60% $3,072.98 $0.31 0.02% NYSERDA Agricultural Energy Efficiency Commercial 14,130.75 28,443.084 104.85% 201.29% $12,112,500.00 $20,532,986.77 86.84% 169.52% $721.90 $0.07 0.43% NYSERDA New Construction Program Commercial 547,916.75 485,876.388 21.47% 88.68% $169,089,626.44 $163,862,871.51 34.71% 96.91% $337.25 $0.03 7.31% NYSERDA Existing Facilities Program Commercial 748,426.5 539,653.465 46.41% 72.11% $129,243,574.36 $124,991,730.47 66.21% 96.71% $231.61 $0.02 8.12% NYSERDA Benchmarking and Operations Efficiency Program Commercial 26,457. 22,972.266 0.00% 86.83% $4,986,972.75 $4,775,341.02 95.76% 95.76% $207.87 $0.02 0.35% NYSERDA Industrial & Process Efficiency Program Commercial 1,390,000. 1,300,272.715 37.81% 93.54% $192,902,818.45 $193,718,610.73 47.82% 100.42% $148.98 $0.01 19.57% NYSERDA FlexTech Expansion Program Commercial 642,358.5 581,221.1 51.45% 90.48% $54,143,421.26 $50,219,433.78 59.25% 92.75% $86.40 $0.01 8.75% NYSERDA Geothermal Heat Pump Systems Program Multi-Family 6,241. 0.00 0.00% 0.00% $2,210,084.75 $369,970.00 16.74% 16.74% N/A N/A 0.00% NYSERDA Elec. Reduction in Master-Metered Multifamily Bldgs Multi-Family 34,852.75 2,685.587 3.50% 7.71% $16,647,642.50 $4,496,211.21 23.20% 27.01% $1,674.20 $0.17 0.04% NYSERDA Low-Income Multifamily Performance Program Multi-Family 118,286.5 70,761.137 9.17% 59.82% $30,554,915.53 $24,223,910.25 23.40% 79.28% $342.33 $0.03 1.06% NYSERDA Multifamily Performance Program Multi-Family 92,132.25 37,151.841 6.96% 40.32% $15,670,961.45 $10,269,579.03 23.75% 65.53% $276.42 $0.03 0.56% NYSERDA Assisted Home Performance with Energy Star Residential 6,537.5 1,291.963 18.64% 19.76% $6,604,784.90 $1,971,086.44 28.98% 29.84% $1,525.65 $0.15 0.02% NYSERDA Home Performance with Energy Star Residential 26,043. 2,664.123 9.13% 10.23% $14,533,069.56 $3,566,209.40 23.07% 24.54% $1,338.61 $0.13 0.04% NYSERDA EmPower New York Program Residential 73,378.25 52,628.138 64.01% 71.72% $75,064,150.75 $54,217,934.20 63.73% 72.23% $1,030.21 $0.10 0.79% NYSERDA Assisted NY Energy Star Homes Residential 2,755.5 2,826.654 102.58% 102.58% $2,839,875.20 $1,193,766.04 42.04% 42.04% $422.32 $0.04 0.04% NYSERDA NY Energy Star Homes Residential 18,729. 13,826.37 44.01% 73.82% $6,020,225.85 $4,147,776.85 42.53% 68.90% $299.99 $0.03 0.21% NYSERDA CFL Expansion Program Residential 1,986,310.75 1,029,364.676 49.37% 51.82% $37,068,852.58 $27,910,865.99 71.37% 75.29% $27.11 $0.00 15.49% O&R Small Business Direct Install Program Commercial 53,514.25 28,727.254 53.68% 53.68% $17,266,859.42 $11,437,618.89 66.24% 66.24% $398.15 $0.04 0.43% O&R Commercial Existing Buildings Program Commercial 27,311. 28,929.519 56.76% 105.93% $9,316,562.36 $4,846,946.88 33.36% 52.03% $167.54 $0.02 0.44% O&R Residential HVAC Residential 229. 51.193 22.36% 22.36% $341,588.65 $138,922.66 40.67% 40.67% $2,713.70 $0.27 0.00% O&R Residential Efficient Products Program Residential 7,795.25 7,135.417 91.54% 91.54% $2,802,728.71 $1,351,436.24 48.22% 48.22% $189.40 $0.02 0.11% RG&E C&I Prescriptive Rebate Program Commercial 2,929. 871.54 29.76% 29.76% $1,466,185.35 $628,899.09 42.89% 42.89% $721.60 $0.07 0.01% RG&E C&I Custom Rebate Program Commercial 3,965. 2,459.027 62.02% 62.02% $2,011,946.86 $1,275,720.52 63.41% 63.41% $518.79 $0.05 0.04% RG&E Small Business Direct Install Program Commercial 66,430.75 50,681.51 72.60% 76.29% $16,950,375.00 $15,118,282.61 85.02% 89.19% $298.30 $0.03 0.76% RG&E C&I Electric Program Commercial 32,584.75 37,383.619 73.21% 114.73% $11,809,250.75 $10,796,358.08 63.07% 91.42% $288.80 $0.03 0.56% RG&E Block Bidding Program Commercial 9,285. 11,595.369 124.88% 124.88% $3,196,486.85 $2,795,046.06 87.44% 87.44% $241.05 $0.02 0.17% RG&E Multifamily Program Multi-Family 6,439.75 14,783.405 213.53% 229.56% $3,630,592.67 $3,227,666.67 82.09% 88.90% $218.33 $0.02 0.22% RG&E Energy Saver Program Residential 12,554. 527.004 4.20% 4.20% $588,344.00 $370,269.61 62.93% 62.93% $702.59 $0.07 0.01% RG&E Refrigerator and Freezer Recycling Program Residential 16,353.75 22,925.329 135.19% 140.18% $4,898,749.81 $2,693,338.18 53.63% 54.98% $117.48 $0.01 0.35%
Appendix A: Detailed Performance Data
Program
Administer Program Name Sector MWh Target to Date Net First-Year MWh Acquired & Committed Percent of MWh Target Acquired Percent of MWh Target Acquired & Committed Budget to Date Total Expenditures & Encumbrances Percent of Budget Expended Percent of Budget Expended & Encumbered Expended & Encumbered Cost per MWh Acquired & Committed Expended & Encumbered Cost per kWh Acquired & Committed Assuming 10-year Lifecycle Percent of Overall Total MWh Acquired & Committed to Date Central Hudson Mid-Size Commercial Business Program Commercial 25,154. 26,133.879 100.58% 103.90% $8,281,441.75 $7,267,188.58 84.19% 87.75% $278.08 $0.03 0.39%
Central Hudson Small Business Direct Install Program Commercial 93,073.5 69,949.424 73.63% 75.16% $24,217,531.55 $18,772,125.50 75.71% 77.51% $268.37 $0.03 1.05% Central Hudson Expanded Residential HVAC Program Residential 0.00 0.00 N/A N/A $23,800.00 $23,800.00 100.00% 100.00% N/A N/A 0.00% Central Hudson Residential HVAC Program Residential 4,839. 6,318.198 130.37% 130.57% $4,790,111.75 $5,294,649.00 110.43% 110.53% $838.00 $0.08 0.10% Central Hudson Residential Appliance Recycling Program Residential 9,182.5 16,941.551 182.25% 184.50% $3,983,688.25 $2,758,297.00 69.03% 69.24% $162.81 $0.02 0.25% Central Hudson Home Energy Reporting Residential 39,000. 54,397.282 139.48% 139.48% $2,941,232.77 $3,100,213.00 105.41% 105.41% $56.99 $0.01 0.82% Con Edison Small Business Direct Install Program Commercial 437,281.5 376,431.338 84.68% 86.08% $145,735,109.33 $131,271,525.40 89.25% 90.08% $348.73 $0.03 5.67% Con Edison C&I Equipment Rebate Program Commercial 263,123.5 217,402.158 57.47% 82.62% $144,642,473.72 $55,563,337.76 34.10% 38.41% $255.58 $0.03 3.27% Con Edison C&I Custom Efficiency Program Commercial 57,664.25 140,793.884 164.11% 244.16% $30,780,858.71 $29,564,703.90 71.62% 96.05% $209.99 $0.02 2.12% Con Edison Multifamily Energy Efficiency Program Multi-Family 39,569.5 48,937.196 117.12% 123.67% $35,023,194.00 $26,090,543.75 71.85% 74.50% $533.14 $0.05 0.74% Con Edison Residential Direct Installation Program Residential 14,700.5 2,663.099 18.12% 18.12% $7,933,991.90 $5,599,496.88 70.58% 70.58% $2,102.62 $0.21 0.04% Con Edison Residential HVAC Program Residential 7,367. 6,443.578 87.47% 87.47% $15,600,528.85 $12,025,276.09 77.08% 77.08% $1,866.24 $0.19 0.10% Con Edison Residential Room Air Conditioning Program Residential 8,053. 3,213.459 39.90% 39.90% $5,095,817.00 $4,333,570.63 85.04% 85.04% $1,348.57 $0.13 0.05% Con Edison Residential Electric Program Residential 18,925.5 23,854.616 119.89% 126.04% $8,136,727.50 $12,109,529.62 143.21% 148.83% $507.64 $0.05 0.36% Con Edison Appliance Bounty Program Residential 32,696. 17,402.2 53.22% 53.22% $10,663,197.60 $4,023,280.67 37.73% 37.73% $231.19 $0.02 0.26% National Grid Small Business Direct Install Program Commercial 547,248.75 505,166.454 92.31% 92.31% $139,040,842.42 $139,005,678.30 99.97% 99.97% $275.17 $0.03 7.60% National Grid Energy Initiative - Commercial & Industrial Electric Program Commercial 326,345.25 251,467.817 58.61% 77.06% $60,722,329.25 $52,650,105.74 71.03% 86.71% $209.37 $0.02 3.78% National Grid Energy Initiative Program - Large Industrial Commercial 43,865. 41,481.007 94.57% 94.57% $12,498,792.80 $8,204,811.11 65.64% 65.64% $197.80 $0.02 0.62% National Grid Energy Initiative Program - Mid-Size C&I Commercial 113,707. 107,170.506 94.25% 94.25% $21,212,899.60 $19,214,825.33 90.58% 90.58% $179.29 $0.02 1.61% National Grid Enhanced Home Sealing Incentives Program Residential 7,458. 108.326 1.45% 1.45% $4,215,150.00 $638,755.57 15.15% 15.15% $5,896.60 $0.59 0.00% National Grid Residential HVAC Program Residential 197.25 1,345.246 682.00% 682.00% $730,170.00 $2,276,838.36 311.82% 311.82% $1,692.51 $0.17 0.02% National Grid Residential Energy Star Products and Recycling Residential 34,157.5 42,859.944 125.48% 125.48% $13,575,968.00 $5,940,246.47 43.76% 43.76% $138.60 $0.01 0.65% National Grid Residential Building Practices and Demonstration Residential 49,815. 66,021.33 132.53% 132.53% $2,575,789.15 $2,690,825.59 104.47% 104.47% $40.76 $0.00 0.99% NYSEG C&I Custom Rebate Program Commercial 11,281. 8,003.14 70.94% 70.94% $4,387,517.05 $3,071,210.70 70.00% 70.00% $383.75 $0.04 0.12% NYSEG C&I Prescriptive Rebate Program Commercial 4,995. 2,953.316 59.13% 59.13% $2,328,890.80 $1,115,762.18 47.91% 47.91% $377.80 $0.04 0.04% NYSEG Block Bidding Program Commercial 9,584. 6,958.389 72.60% 72.60% $3,189,131.00 $2,353,627.10 73.80% 73.80% $338.24 $0.03 0.10% NYSEG C&I Electric Program Commercial 43,994.5 49,260.166 79.97% 111.97% $16,333,817.50 $14,873,029.02 68.26% 91.06% $301.93 $0.03 0.74% NYSEG Small Business Direct Install Program Commercial 145,483.5 116,281.818 75.39% 79.93% $37,202,883.26 $33,315,918.14 84.28% 89.55% $286.51 $0.03 1.75% NYSEG Multifamily Program Multi-Family 5,142. 11,956.876 202.84% 232.53% $3,576,458.35 $2,641,980.57 65.58% 73.87% $220.96 $0.02 0.18% NYSEG Energy Saver Program Residential 14,446. 731.7 5.07% 5.07% $664,382.00 $417,563.43 62.85% 62.85% $570.68 $0.06 0.01% NYSEG Refrigerator and Freezer Recycling Program Residential 16,353.75 42,548.075 252.09% 260.17% $4,898,749.81 $3,962,028.18 79.09% 80.88% $93.12 $0.01 0.64% NYSERDA Agricultural Disaster Program Commercial 2,500. 1,551.195 61.26% 62.05% $5,568,580.80 $4,766,794.41 77.82% 85.60% $3,072.98 $0.31 0.02% NYSERDA Agricultural Energy Efficiency Commercial 14,130.75 28,443.084 104.85% 201.29% $12,112,500.00 $20,532,986.77 86.84% 169.52% $721.90 $0.07 0.43% NYSERDA New Construction Program Commercial 547,916.75 485,876.388 21.47% 88.68% $169,089,626.44 $163,862,871.51 34.71% 96.91% $337.25 $0.03 7.31% NYSERDA Existing Facilities Program Commercial 748,426.5 539,653.465 46.41% 72.11% $129,243,574.36 $124,991,730.47 66.21% 96.71% $231.61 $0.02 8.12% NYSERDA Benchmarking and Operations Efficiency Program Commercial 26,457. 22,972.266 0.00% 86.83% $4,986,972.75 $4,775,341.02 95.76% 95.76% $207.87 $0.02 0.35% NYSERDA Industrial & Process Efficiency Program Commercial 1,390,000. 1,300,272.715 37.81% 93.54% $192,902,818.45 $193,718,610.73 47.82% 100.42% $148.98 $0.01 19.57% NYSERDA FlexTech Expansion Program Commercial 642,358.5 581,221.1 51.45% 90.48% $54,143,421.26 $50,219,433.78 59.25% 92.75% $86.40 $0.01 8.75% NYSERDA Geothermal Heat Pump Systems Program Multi-Family 6,241. 0.00 0.00% 0.00% $2,210,084.75 $369,970.00 16.74% 16.74% N/A N/A 0.00% NYSERDA Elec. Reduction in Master-Metered Multifamily Bldgs Multi-Family 34,852.75 2,685.587 3.50% 7.71% $16,647,642.50 $4,496,211.21 23.20% 27.01% $1,674.20 $0.17 0.04% NYSERDA Low-Income Multifamily Performance Program Multi-Family 118,286.5 70,761.137 9.17% 59.82% $30,554,915.53 $24,223,910.25 23.40% 79.28% $342.33 $0.03 1.06% NYSERDA Multifamily Performance Program Multi-Family 92,132.25 37,151.841 6.96% 40.32% $15,670,961.45 $10,269,579.03 23.75% 65.53% $276.42 $0.03 0.56% NYSERDA Assisted Home Performance with Energy Star Residential 6,537.5 1,291.963 18.64% 19.76% $6,604,784.90 $1,971,086.44 28.98% 29.84% $1,525.65 $0.15 0.02% NYSERDA Home Performance with Energy Star Residential 26,043. 2,664.123 9.13% 10.23% $14,533,069.56 $3,566,209.40 23.07% 24.54% $1,338.61 $0.13 0.04% NYSERDA EmPower New York Program Residential 73,378.25 52,628.138 64.01% 71.72% $75,064,150.75 $54,217,934.20 63.73% 72.23% $1,030.21 $0.10 0.79% NYSERDA Assisted NY Energy Star Homes Residential 2,755.5 2,826.654 102.58% 102.58% $2,839,875.20 $1,193,766.04 42.04% 42.04% $422.32 $0.04 0.04% NYSERDA NY Energy Star Homes Residential 18,729. 13,826.37 44.01% 73.82% $6,020,225.85 $4,147,776.85 42.53% 68.90% $299.99 $0.03 0.21% NYSERDA CFL Expansion Program Residential 1,986,310.75 1,029,364.676 49.37% 51.82% $37,068,852.58 $27,910,865.99 71.37% 75.29% $27.11 $0.00 15.49% O&R Small Business Direct Install Program Commercial 53,514.25 28,727.254 53.68% 53.68% $17,266,859.42 $11,437,618.89 66.24% 66.24% $398.15 $0.04 0.43% O&R Commercial Existing Buildings Program Commercial 27,311. 28,929.519 56.76% 105.93% $9,316,562.36 $4,846,946.88 33.36% 52.03% $167.54 $0.02 0.44% O&R Residential HVAC Residential 229. 51.193 22.36% 22.36% $341,588.65 $138,922.66 40.67% 40.67% $2,713.70 $0.27 0.00% O&R Residential Efficient Products Program Residential 7,795.25 7,135.417 91.54% 91.54% $2,802,728.71 $1,351,436.24 48.22% 48.22% $189.40 $0.02 0.11% RG&E C&I Prescriptive Rebate Program Commercial 2,929. 871.54 29.76% 29.76% $1,466,185.35 $628,899.09 42.89% 42.89% $721.60 $0.07 0.01% RG&E C&I Custom Rebate Program Commercial 3,965. 2,459.027 62.02% 62.02% $2,011,946.86 $1,275,720.52 63.41% 63.41% $518.79 $0.05 0.04% RG&E Small Business Direct Install Program Commercial 66,430.75 50,681.51 72.60% 76.29% $16,950,375.00 $15,118,282.61 85.02% 89.19% $298.30 $0.03 0.76% RG&E C&I Electric Program Commercial 32,584.75 37,383.619 73.21% 114.73% $11,809,250.75 $10,796,358.08 63.07% 91.42% $288.80 $0.03 0.56% RG&E Block Bidding Program Commercial 9,285. 11,595.369 124.88% 124.88% $3,196,486.85 $2,795,046.06 87.44% 87.44% $241.05 $0.02 0.17% RG&E Multifamily Program Multi-Family 6,439.75 14,783.405 213.53% 229.56% $3,630,592.67 $3,227,666.67 82.09% 88.90% $218.33 $0.02 0.22% RG&E Energy Saver Program Residential 12,554. 527.004 4.20% 4.20% $588,344.00 $370,269.61 62.93% 62.93% $702.59 $0.07 0.01% RG&E Refrigerator and Freezer Recycling Program Residential 16,353.75 22,925.329 135.19% 140.18% $4,898,749.81 $2,693,338.18 53.63% 54.98% $117.48 $0.01 0.35%
Acknowledgements
the Pace energy and climate center thanks the energy Foundation and the new York community trust for their support of this report. the Pace energy
and climate center is solely responsible for its content. We also thank the reviewers who provided suggestions and comments.
About Pace Energy
and Climate Center
More than a think tank, the Pace energy & climate center turns ideas into action. We believe thoughtful engagement of government and key stakeholders leads to better public policy. We conduct research and analysis on legal, regulatory and policy matters because thorough, objective analyses are essential to finding solutions to today’s complex energy and climate change challenges. We are lawyers, economists, scientists, and energy analysts, committed to achieving real-world progress.
About the Authors
John Bowie, energy law and climate advisor, focuses on electric utilities, energy efficiency, and greenhouse gas emissions law. John has prepared materials in the 2013 con edison utility rate case, and conducted analysis and provided support related to ePa’s proposed greenhouse gas emissions rules for power plants. John has also provided analysis and support in the Reforming the energy Vision proceeding underway at the new York state Public service commission. John attended hobart and William smith colleges, where he attained a B.s. in Biochemistry. Following his undergraduate degree, John worked as a leeD aP sustainable design coordinator at an architecture firm in toronto, Ontario. he later attained an M.a. in Depth Psychology from Pacifica Graduate institute. John graduated from Pace law school in 2014.
David Gahl, Director of strategic engagement, represents Pace in the new York state capital and at the new York state Public service commission. Prior to joining the center, David held various positions at environmental advocates of new York, new York state’s leading environmental advocacy organization. there he oversaw all aspects of the organization’s policy analysis, advocacy and communications work. he also ran the organization’s clean energy campaign. Prior to joining environmental advocates, David worked as a senior Budget analyst for the new York state assembly Ways and Means committee, as well as for the nelson a. Rockefeller institute of Government. David earned a B.a. in history from Miami university in Ohio and an M.a. in Public Policy from the nelson a. Rockefeller college of Public affairs, sunY albany.
Nicholas Martin, energy Policy associate, focuses on community energy issues including combined heat and power (chP) systems and microgrids. he received a M.s. in climate science and Policy degree from the Bard center for environmental Policy and a B.s. in environmental health from the university of Georgia. While pursuing his master’s degree, nick spent time in india working on climate adaptation and communication projects in rural farming communities with the new Delhi based nGO Development alternatives. he also investigated the characteristics and quality of public policy research at the World Resources institute in Washington, D.c.
Saw Swanson, senior Policy advisor, covers a wide range of electricity market policy and regulation subjects, including renewable and demand-side resource assessment, planning, evaluation and market development, the environmental impacts of electricity production, and electricity price regulation. sam has appeared as an expert witness before regulatory commissions in arizona, colorado, Michigan, nevada, new York and Vermont. he served on the new York Psc energy efficiency evaluation advisory Group and the Vermont clean energy Development Board. he previously served as a senior policy advisor and Deputy Director of the new York Psc Office of energy efficiency and the environment. he holds a Ba in economics from stony Brook university, a MPia in economic and social Development from the university of Pittsburgh, and a certificate in Regulatory economics from the state university of new York at albany.
Pace Energy and Climate Center
Pace law school
78 north Broadway, e-house White Plains, new York 10603