The handle
http://hdl.handle.net/1887/80956
ho
lds various files of this Leiden University
dissertation.
Author
:
Gaag, K.J. van der
Title
:
Development of forensic genomics research toolkits by the use of Massively
Parallel Sequencing
velopment of f
or
ensic genomics r
esear
ch toolkits b
y the use of MPS
Kristiaan van der Gaag
Kristiaan van der Gaag
Development of forensic genomics
research toolkits by the use of
Massively Parallel Sequencing
velopment of f
or
ensic genomics r
esear
ch toolkits b
y the use of MPS
Kristiaan van der Gaag
Kristiaan van der Gaag
Development of forensic genomics
research toolkits by the use of
Massively Parallel Sequencing
velopment of f
or
ensic genomics r
esear
ch toolkits b
y the use of MPS
Kristiaan van der Gaag
Kristiaan van der Gaag
Development of forensic genomics
research toolkits by the use of
Massively Parallel Sequencing
De
velopment of f
or
ensic genomics r
esear
ch toolkits b
y the use of MPS
Kristiaan van der Gaag
Uitnodiging
voor het bijwonen van de openbare verdediging
van het proefschrift
Development of forensic genomics research toolkits by the use of
Massively Parallel Sequencing
door
Kristiaan van der Gaag
op donderdag 27 november 2019 om 11.15 uur
in de senaatskamer van het Academiegebouw,
Rapenburg 73 te Leiden Receptie na afloop
Aanwezig?
Geef het me door i.v.m. beperkt aantal plekken in de zaal
Paranimfen Eveline Altena
Jerry Hoogenboom
Kris van der Gaag
by the use of Massively Parallel Sequencing
The research described in this thesis was financially supported by the Leiden University Medical Center and by a grant from the Netherlands Genomics Initiative / Netherlands Organization for Scientific Research (NWO) within the framework of the Forensic Genomics Consortium Netherlands
Author Kristiaan J. van der Gaag
ISBN / EAN: 978-94-6332-585-1
Cover FDSTools visualisation (samplevis) of sequencing variation from 14 STR loci in a set of 300 dutch inidividuals
Back cover FDSTools samplestats table
Layout & cover design Kristiaan van der Gaag and Jerry Hoogenboom © K.J. van der Gaag, 2019
by the use of Massively Parallel Sequencing
Proefschrift
Ter verkrijging van
de graad van Doctor aan de Universiteit Leiden,
op gezag van Rector Magnificus prof.mr. C.J.J.M. Stolker,
volgens besluit van het College voor Promoties
te verdedigen op woensdag 27 november 2019
klokke 11:15 uur
door
Kristiaan Johannes van der Gaag
Promotores
Prof. dr. P. de Knijff
Prof. dr. J.T. den Dunnen
Copromotor
Dr. T. Sijen –
Nederlands Forensisch Instituut
(NFI)
Leden promotiecomissie Prof. dr. D.J.M. Peters
Chapter 1:
9
Introduction / Outline
Chapter 2
21
TSSV: a tool for characterization of complex allelic variants in pure and
mixed genomes
Chapter 3
65
Forensic Nomenclature for Short Tandem Repeats updated for
sequencing
Chapter 4
73
Massively Parallel Sequencing of Short Tandem Repeats – Population
data and mixture analysis results for the PowerSeq™ system
Chapter 5
129
FDSTools: A software package for analysis of massively parallel
sequencing data with the ability to recognise and correct STR stutter
and other PCR or sequencing noise
Chapter 6:
181
Short hypervariable microhaplotypes: A novel set of very short high
discriminating power loci without stutter artefacts
Chapter 7:
221
General Discussion
Epilogue
245
List of publications
247
Summary thesis
251
Nederlandse samenvatting
257
Dankwoord
263
Chapter 1
Introduction / Outline
11
pter 1
Introduction / Outline
Since the discovery of hypervariable DNA ‘fingerprints’ by Jeffreys et al. [12] in 1985, development and application of forensic DNA research has evolved rapidly. Over the past two decades, investigation of Short Tandem Repeat (STR) loci has played a major role in human identification. The implementation of short tandem repeat (STR) analysis by capillary electrophoresis in forensic casework [15] and the establishments of large STR databases [30] have provided crucial investigative leads or evidence in numerous cases.
Short Tandem Repeats and Capillary Electrophoresis
STRs are DNA loci containing repeated sequence motifs of 2-6 bp in length. An important feature of STRs is the high mutation rate caused by polymerase slippage [5] which results in a high degree of variability between individuals. By analysing a relatively small number of STRs, DNA profiles can be obtained with very high discriminatory power. Unfortunately, STR slippage also occurs in the PCR amplification step resulting in PCR artefacts known as stutter (discussed in more detail later in this thesis).
Routine analysis of STRs is a relatively straightforward process performed by size separation of fluorescently labelled PCR fragments using Capillary Electrophoresis (CE) [18]. Multiplexing of sufficient loci in one reaction for CE is achieved by labelling loci with several fluorescent labels and PCR design of different loci for separated fragment length ranges.
In addition to autosomal STR analysis, targets such as mitochondrial DNA [20], Y chromosomal markers [16], biogeographical informative markers [23] or tissue informative RNA markers [3] have also been investigated. However, until recently, application of DNA analyses in casework was performed almost exclusively by capillary electrophoresis (CE) based methods such as fragment length analysis, Sanger Sequencing [20] and SNaPshot single base extension [27].
Molecular genetics developments (non-forensic)
12
Cha
pter 1
[31]).Introduction of a new technique in the forensic field commonly happens in a later stage than developments in the medical field since methods need to be optimised for minute amounts of (often degraded) DNA. In addition, software needs to be optimised to handle mixed DNA samples and answer specific forensically relevant questions.
Why use MPS in forensics?
MPS has some features which make these techniques interesting for application in forensics.
• A sequence is generated separately for each DNA molecule, instead of a consensus sequence as is generated by Sanger sequencing.
• MPS can generate millions of sequence reads (hence, the name ‘massively’). • Many different targets can be analysed simultaneously without the need of
separate sequence reactions, thereby expanding multiplex possibilities, even allowing complete genome sequencing
• MPS data can be quantified by simply counting reads for every sequence variant, thereby creating ‘discrete data’ in contrast to CE where interpretation of the shape of peaks is an entity that is difficult to define using straightforward parameters.
• The number of reads for a single sample can be increased almost indefinitely, resulting in an unprecedented dynamic detection range.
• Small and overlapping fragment sizes can be used for all loci since, during the analysis, targets are recognised by sequence rather than by fragment size / label as for CE which will benefit the analysis of degraded DNA samples.
Several commercial companies have developed an MPS platform [28], which illustrates the large current and future market expected for these techniques, for instance in the field of medical research. The early versions of MPS platforms (2005 – 2010) were undergoing constant improvements in sequence data quality and read output but since 2011 several platforms (such as MiSeq and Ion Torrent) started to focus on a more diagnostic application where data quality is relatively stable [11,31], also opening opportunities for the forensic field.
13
pter 1
MPS data and data analysis
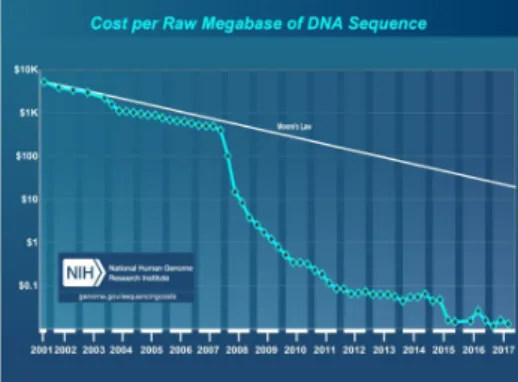
Since 2004, the read-output and sequence read length increased steadily (with marked increases around 2007-2008 due to introduction and further expansion of the capacity of the Illumina HiSeq systems) which resulted in a notable decrease of cost per sequence. In the same time, more computer power is required to analyse the data. Gordon Moore predicted in 1965 that the speed of computer chips doubles each year while retaining the same costs. Figure 1 shows that MPS costs per megabase dropped substantially faster than the costs for increasing computation power. As a result of this increase of data, new approaches and tools needed to be developed to analyse the data fast, efficiently and accurately.
MPS platforms with forensic potential
Several Massively Parallel Sequencing platforms are (or have been) available. Since forensic DNA analysis is different from that in medical genetic research (where mostly SNP genotyping is used) the forensic context has specific demands for MPS platforms. Current forensic reference databases exist of STR-profiles and the ability to sequence short tandem repeat is a prerequisite for the forensic community. To span the entire repeat region for the majority of STRs, read lengths of at least 200 nt are required which limits the choice to a few platforms. Current proven high quality MPS platforms with the ability to sequence such read lengths are the 454 pyrosequencers (454 / Roche, discontinued in 2017), Ion Torrent semiconductor sequencers (Ion Torrent / Life Technologies), Solexa / Illumina sequencers and Pacific Biosystems / Roche SMRT sequencers.
14
Cha
pter 1
Figure 1 – cost per raw megabase of DNA sequence in combination with Moore’s Law
This graph (source: National Human Genome Research Institute) displays the decrease of cost / Mbase of DNA sequence since 2001 in combi-nation with Moore’s law (development in increased computer power). It is apparent that the sequencing costs dropped substantially faster than the cost for the computer power required to perform the analysis.
Data analysis in forensics
15
pter 1
Sequencing quality
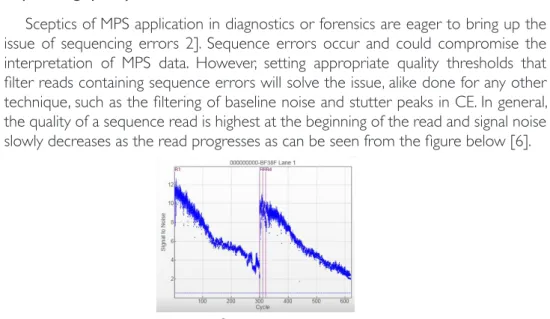
Sceptics of MPS application in diagnostics or forensics are eager to bring up the issue of sequencing errors 2]. Sequence errors occur and could compromise the interpretation of MPS data. However, setting appropriate quality thresholds that filter reads containing sequence errors will solve the issue, alike done for any other technique, such as the filtering of baseline noise and stutter peaks in CE. In general, the quality of a sequence read is highest at the beginning of the read and signal noise slowly decreases as the read progresses as can be seen from the figure below [6].
Figure 2 – Signal to noise ratio of an Illumina MiSeq® run.
The graph shows the signal to noise ratio over all data points in an Illumina MiSeq® run for nucleotide incorporation (1nt / cycle). As can be observed, the signal quality decreases as the read progresses for both, read 1 (cycle 1-300) and read 2 (cycle 321-620).
To compensate for a reducing quality in a progressing read, Paired End sequencing can be applied which refers to sequencing a molecule from both the 5’and 3’ end; the low quality base calls at the end of one strand will be the high quality base calls in the beginning of the read of the opposite strand.
16
Cha
pter 1
Public genome databases
The decrease in sequencing cost per nucleotide resulted first; in the (affordable) possibility to generate an (almost) complete individual genome sequence and later; by impressive collaboration efforts, to the generation of databases of complete genomes [9, 8,33]. One of these projects, the 1000 genomes project, provides a public database of variation observed in individuals of globally dispersed populations and is a powerful tool for the selection of new (globally) informative forensic markers. Since different genome projects are started for different goals and budgets for these projects are not unlimited, there is a trade-off between quality in terms of per base sequence coverage and the number of individuals included in the project. While publicly available databases can drastically decrease the amount of wet lab work that is needed to reliably select new markers, it should be taken into account that genome databases are not free of errors.
Microhaplotypes
While STRs and SNPs are well-known loci in molecular genetics, the use of microhaplotypes [14,17] is not common although they are potential forensic loci without some of the disadvantages of STRs (discussed in more detail in the discussion). Microhaplotypes are fragments that contain more than one SNP within a span of ≤200 bp. The combinations of the different alleles of the SNPs form multiple haplotypes resulting in a higher number of alleles than the SNPs separately. In particular, the fragments that contain more than two SNPs within a short sequence span can be informative for forensic identification purposes, but might also serve as markers for prediction of biogeographic origin. These loci are discussed in more detail later on in this thesis.
Goal of this thesis
17
pter 1
Outline
The obvious application of MPS in forensics would be the sequencing of STRs as forensic DNA databases are filled with data from this marker type and MPS can have added value for the profiling of severely degraded DNA (all amplicons can be small-sized) or discrimination of mixed samples (by adding sequence variants). However, when this project started, tools for analysis of MPS STR data were absent since MPS analysis outside the forensic field focussed almost exclusively on analysis of SNPs. In
Chapter 2: ‘TSSV: a tool for characterization of complex allelic variants in pure and mixed genomes’, the development of the software TSSV is described, which represents one of the first tools for analysis of MPS STR data. Since mapping of STRs to a reference is complex and error-prone due to the repetitive nature of these loci, we chose not to map the actual repeat region but instead map short parts of both flanking regions (usually covering part of the primer binding sites). Any variation observed in the sequence in between is reported as strings without comparison to a reference thereby avoiding any mapping bias that may occur depending on the resemblance of sequences to the reference. Repeated elements were abbreviated as a first step towards a universal nomenclature.
Since CE allele calling for STRs does not provide information about the exact sequence of an allele, nomenclature needed to be developed for describing the additional variation typed by sequencing. In Chapter 3: ‘Forensic nomenclature for short tandem repeats updated for sequencing’; we provided the first recommendations for a nomenclature system for forensic STR sequencing data. These recommendations were largely incorporated in the ISFG recommendations for STR sequencing nomenclature which were published later that year [22].
After collaborating with Promega® in the optimisation of an STR sequencing assay
for the commercial market, we performed a detailed in-house validation of a prototype version of the PowerseqTM assay in preparation of ISO17025 accreditation. The study
of the performance of this assay included analysis of STR stutters, sequence variation in three distinct globally dispersed populations and analysis of mixtures is described in
Chapter 4: ‘Massively parallel sequencing of short tandem repeats - Population data and mixture analysis results for the PowerSeq™ system’.
18
Cha
pter 1
Chapter 2 was able to catalogue the variation observed in a sample, FDSTools can use a set of training data to characterise structural PCR and sequencing noise including STR stutter and use this information to correct noise in case samples. In this way, noise can be reduced substantially to facilitate analysis of much lower contributions in mixtures. This software was designed for application in forensic casework and includes many features for visualisation, validation and quality filtering of all types of MPS data.Although correction of noise improved the analysis of mixtures it can be debated whether STRs are the ideal loci for the purpose of analysing complex mixtures since the remaining levels of stutter after correction will still complicate analysis of highly in unbalanced mixtures. In Chapter 6: ‘Short hypervariable microhaplotypes: A novel set of very short high discriminating power loci without stutter artefacts.’ we describe an alternative set of loci for the analysis of mixtures namely microhaplotypes which are small fragments containing several SNPs. Although these loci cannot be used for comparison with the established databases (unless it is decided to type these loci routinely), they can still be used for comparison with known references in a case. The concluding Chapter 7 discusses the potential of MPS in comparison with the currently used method CE and the future steps needed to use the full potential of this new technique. Software development is discussed including additional options to improve MPS data analysis in order to deal with remaining PCR noise. Novel targets and applications are presented that could provide new possibilities for forensic investigations concluded by suggestions for implementation of MPS in a casework setting.
References
1. Arenas M, Pereira F, Oliveira M, Pinto N, Lopes AM, Gomes V, Carracedo A, Amorim A. Forensic genetics and genomics: Much more than just a human affair. PLoS Genet. 2017 Sep 21;13(9):e1006960.
2. Bandelt HJ, Salas A. Current next generation sequencing technology may not meet forensic standards. Forensic Sci Int Genet. 2012 Jan;6(1):143-5.
3. van den Berge M, Bhoelai B, Harteveld J, Matai A, Sijen T. Advancing forensic RNA typing: On non-target secretions, a nasal mucosa marker, a differential co-extraction protocol and the sensitivity of DNA and RNA profiling. Forensic Sci Int Genet. 2016 Jan;20:119-129.
4. Biesecker LG, Biesecker BB. An approach to pediatric exome and genome sequencing. Curr Opin Pediatr. 2014 Dec;26(6):639-45.
5. Cox R. and Mirkin S.M. Characteristic enrichment of DNA repeats in different genomes. PNAS 94 (10) 5237-5242 (1997)
6. Endrullat C, Glökler J, Franke P, Frohme M. Standardization and quality management in next-generation sequencing. Appl Transl Genom. 2016 Jul 1;10:2-9.
19
pter 1
8. Genome of the Netherlands Consortium. Whole-genome sequence variation, population structure and demographic history of the Dutch population. Nat Genet. 2014 Aug;46(8):818-25.
9. Hayden EC. Technology: The $1,000 genome. Nature. 2014 Mar 20;507(7492):294-5. 10. Hoogenboom J, van der Gaag KJ, de Leeuw RH, Sijen T, de Knijff P, Laros JF. FDSTools:
A software package for analysis of massively parallel sequencing data with the ability to recognise and correct STR stutter and other PCR or sequencing noise. Forensic Sci Int Genet. 2017 Mar;27:27-40.
11. Jäger AC, Alvarez ML, Davis CP, Guzmán E, Han Y, Way L, Walichiewicz P, Silva D, Pham N, Caves G, Bruand J, Schlesinger F, Pond SJK, Varlaro J, Stephens KM, Holt CL. Developmental validation of the MiSeq FGx Forensic Genomics System for Targeted Next Generation Sequencing in Forensic DNA Casework and Database Laboratories. Forensic Sci Int Genet. 2017 May;28:52-70.
12. Jeffreys, A.J., Wilson, V., Thein, S.L. Hypervariable ‘ minisatellite ‘ regions in human DNA. Nature 314, 67-73 (1985)
13. Jeffreys, A.J., Wilson, V., Thein, S.L. Individual-specific ‘ fingerprints’ of human DNA. Nature 316, 76-79 (1985)
14. Jin, L., Underhill, P.A., Doctor, V., Davis, R.W., Shen, P., Cavalli-Sforza, L.L., Oefner, P.J. Distribution of haplotypes from a chromosome 21 region distinguishes multiple prehistoric human migrations. Proc. Natl. Acad. Sci. U. S. A. 1999;96:3796–3800. 15. Jobling M.A., Gill P., Encoded evidence: DNAin forensic analysis. Nature Reviews 5:
739-751 (2004)
16. Kayser M. Forensic use of Y-chromosome DNA: a general overview. Hum Genet. 2017 May;136(5):621-635.
17. Kidd, K.K., Pakstis, A.J., Speed, W.C., Lagacé, R., Chang, J., Wootton, S., Haigh, E., Kidd, J.R. Current sequencing technology makes microhaplotypes a powerful new type of genetic marker for forensics. Forensic Sci. Int. Genet. 2014;12:215–224.
18. Kimpton C.P., Gill P., Walton A., Urquhart A., Millican E.S., Adams M. Automated DNA Profiling Employing Multiplex Amplification of Short Tandem Repeat Loci. Gen. Research 1993. 3:13-22
19. de Knijff P. From next generation sequencing to now generation sequencing in forensics. Forensic Sci Int Genet. 2019 Jan;38:175-180.
20. Melton T., Holland C., Holland M., Forensic Mitochondrial DNA: Current Practice and Future Potential. Forensic Science Review 24(2):110
21. Merriman B; Ion Torrent R&D Team, Rothberg JM. Progress in ion torrent semiconductor chip based sequencing. Electrophoresis. 2012 Dec;33(23):3397-417.
22. Parson W, Ballard D, Budowle B, Butler JM, Gettings KB, Gill P, Gusmão L, Hares DR, Irwin JA, King JL, Knijff P, Morling N, Prinz M, Schneider PM, Neste CV, Willuweit S, Phillips C. Massively parallel sequencing of forensic STRs: Considerations of the DNA commission of the International Society for Forensic Genetics (ISFG) on minimal nomenclature requirements. Forensic Sci Int Genet. 2016 May;22:54-63.
23. Phillips C, Santos C, Fondevila M, Carracedo Á, Lareu MV. Inference of Ancestry in Forensic Analysis I: Autosomal Ancestry-Informative Marker Sets.Methods Mol Biol. 2016;1420:233-53.
24. Rhoads A, Au KF. PacBio Sequencing and Its Applications. Genomics Proteomics Bioinformatics. 2015 Oct;13(5):278-89.
20
Cha
pter 1
Biotechnol. 2008 Oct;26(10):1117-24. doi: 10.1038/nbt1485.26. Salipante SJ, Kawashima T, Rosenthal C, Hoogestraat DR, Cummings LA, Sengupta DJ, Harkins TT, Cookson BT, Hoffman NG. Performance comparison of Illumina and ion torrent next-generation sequencing platforms for 16S rRNA-based bacterial community profiling. Appl Environ Microbiol. 2014 Dec;80(24):7583-91.
27. Sanchez JJ, Børsting C, Hallenberg C, Buchard A, Hernandez A, Morling N. Multiplex PCR and minisequencing of SNPs--a model with 35 Y chromosome SNPs. Forensic Sci Int. 2003 Oct 14;137(1):74-84.
28. Vidaki A, Kayser M. Recent progress, methods and perspectives in forensic epigenetics. Forensic Sci Int Genet. 2018 Nov;37:180-195.
29. Voelkerding KV, Dames SA, Durtschi JD. Next-generation sequencing: from basic research to diagnostics. Clin Chem. 2009 Apr;55(4):641-58.
30. Werret D.J. The National DNA Database. Forensic Science International vol88:33-42 (1997)
31. Willems P.J., Dierickx H., Vandenakker E., Bekedam D., Segers N., Deboulle K., Vereecken A. The first 3,000 Non-Invasive Prenatal Tests (NIPT) with the Harmony test in Belgium and the Netherlands. Facts Views Vis Obgyn. 2014;6(1):7-12.
32. Zhang S, Bian Y, Chen A, Zheng H, Gao Y, Hou Y, Li C. Developmental validation of a custom panel including 273 SNPs for forensic application using Ion Torrent PGM. Forensic Sci Int Genet. 2017 Mar;27:50-57.
Chapter 2
TSSV: a tool for characterization of
complex allelic variants in
pure and mixed genomes
Seyed Yahya Anvar
Kristiaan J. van der Gaag
Jaap W. F. van der Heijden
Marcel H. A. M. Veltrop
Rolf H. A. M. Vossen
Rick H. de Leeuw
Cor Breukel
Henk P. J. Buermans
J. Sjef Verbeek
Peter de Knijff
Johan T. den Dunnen
Jeroen F. J. Laros
Bio
informatics, Vol. 30 no. 12 2014, pages 1651–165923
pter 2
Abstract
Motivation: Advances in sequencing technologies and computational algorithms have enabled the study of genomic variants to dissect their functional consequence. Despite this unprecedented progress, current tools fail to reliably detect and characterize more complex allelic variants, such as short tandem repeats (STRs). We developed TSSV as an efficient and sensitive tool to specifically profile all allelic variants present in targeted loci. Based on its design, requiring only two short flanking sequences, TSSV can work without the use of a complete reference sequence to reliably profile highly polymorphic, repetitive or uncharacterized regions.
Results: We show that TSSV can accurately determine allelic STR structures in mixtures with 10% representation of minor alleles or complex mixtures in which a single STR allele is shared. Furthermore, we show the universal utility of TSSV in two other independent studies: characterizing de novo mutations introduced by transcription activator-like effector nucleases (TALENs) and profiling the noise and systematic errors in an Ion Torrent sequencing experiment. TSSV complements the existing tools by aiding the study of highly polymorphic and complex regions and provides a high-resolution map that can be used in a wide range of applications, from personal genomics to forensic analysis and clinical diagnostics.
Availability and implementation: We have implemented TSSV as a Python package that can be installed through the command-line using pip install TSSV command. Its source code and documentation are available at https://pypi.python.org/pypi/tssv and http://www.lgtc.nl/tssv.
Introduction
24
Cha
pter 2
Because of the repetitive nature of STRs and often the low level of complexity of the DNA sequences in which they occur (Treangen and Salzberg, 2012), characterization of STR variability and understanding of their functional consequences are challenging (Weischenfeldt et al., 2013). So far, sequencing-based strategies have focused on reads mapped to the reference genome and subsequent identification of discordant signatures and classification of associated STRs (Medvedev et al., 2009; Mills et al., 2011). Yet, the mainstream aligners, such as BWA (Li and Durbin, 2009) or Bowtie (Langmead and Salzberg, 2012), do not tolerate repeats or insertions and deletions (indels) as a trade-off of run time (Li and Homer, 2010). This limitation leads to ambiguities in the alignment or assembly of repeats which, in turn, can obscure the interpretation of results (Treangen and Salzberg, 2012). Moreover, the current human genome reference still remains incomplete and provides only limited information on expected and potentially uncharacterized STRs in different individuals (Alkan et al., 2011; Iafrate et al., 2004; Kidd et al., 2008; Sebat et al., 2004). Consequently, STRs are not routinely analyzed in whole-genome or whole-exome sequencing studies, despite their obvious applications and their role in human diseases, complex traits and evolution.25
pter 2
Material and Methods
TSSV algorithm
The algorithm expects a FASTA file containing sequencing data and a library containing a list of loci of interest that are described by two unique sequences flanking a target locus in the form of a simple regular expression. The description of targeted loci consists of a series of triplets (i.e. CTTA 2 5), each containing a sequence followed by two integers that denote the minimum and maximum number of times the preceding sequence is expected. The notation of expected alleles is then compiled into a regular expression that is used to distinguish between known and new alleles. It is important that a library that contains a description of loci of interest according to the aforementioned instruction should be customized and provided. TSSV reports an overview of marker pair alignments and a detailed description of the identified alleles and their respective frequency per strand. TSSV also provides supporting reads of each locus of interest in separate FASTA files.
TSSV is an open source Python package that can be easily incorporated in any standard NGS pipeline. In addition, we have made the Python package fastools available at https://pypi.python.org/pypi/fastools. fastools offers a series of functions to manipulate, characterize, sanitize and convert FASTQ/FASTA files to other formats. Therefore, it can be used to convert FASTQ files to TSSV desired format (FASTA). For further information on usage and generated data see Supplementary Table S1.
Marker alignment
Each pair of markers (unique flanking sequences) is aligned to the reads by using a semi-global pairwise alignment, a modified version of the Smith–Waterman algorithm (Smith and Waterman, 1981). The alignment matrix is initialized with penalties only for the aligned sequence and not for the reference sequence. By using this approach, we can use the alignment matrix to calculate the edit distance between the aligned sequence and all substrings of the reference sequence. Finally, TSSV uses the alignment matrix to select the rightmost alignment with a minimum edit distance. To guarantee symmetry with regard to reverse complement sequences, TSSV aligns the reverse complement of the right marker to the reverse complement of the reference sequence.
Allele identification
26
Cha
pter 2
expression of the corresponding marker pair for classification as either a known or a new allele. In case of partial identification of markers (i.e. only the left or right marker of the pair is identified), the input sequence is flagged as having either no beginning or no end. The assessment of required runtime for TSSV to identify alleles in datasets with different sequencing depth is provided in Supplementary Figure S1. Each dataset is profiled to characterize 16 allelic STR structures. It should be noted that currently TSSV uses a single processor for the analysis.
Annotations
Once a list of new alleles is constructed, TSSV uses a revised version of the Mutalyzer online service (Wildeman et al., 2008; https://mutalyzer.nl) to describe all observed variants compared with the reference sequence. Mutalyzer provides a description of observed variants according to the Human Genome Variation Society format for sequence variant description. This can be used to provide an overview of most frequent mutations that are observed within each locus of interest.
Interpretation guidelines
TSSV provides the frequency in which each allelic structure is observed on plus and minus strand. Based on the experimental design, the frequencies of allelic variants and the balance between supporting reads on the plus and minus strand can aid the identification of potential sequencing biases. Moreover, based on the choice of sequencing technology, homopolymers are prone to introducing artificial allelic structures, so it is advised, when possible, to allow for a tolerance of a few base difference in the homopolymer length while describing targeted loci. The estimation of a lower boundary for the identification of variant alleles is subject to the experimental design. Thus, sequencing of control samples, if possible, can aid a more reliable analysis by ruling out potential slippage and background noise. nce a list of new alleles is constructed, TSSV uses a revised version of the Mutalyzer
Availability
27
pter 2
Library preparations and sequencing
STR PCR products for sequencing were generated using the Powerplex® 16-kit
from Promega (commercial assay designed and optimized for fluorescent dye-based fragment analysis of STR loci) and were purified with Ampure XP beads according to manufacturer’s protocol. Library preparation was performed using the Rapid Library Preparation Kit (Roche). Emulsion PCR and sequencing were performed on the FLX Genome Sequencer (454/Roche) according to the protocol provided by the manufacturer.
PCR products for sequencing of all other samples on the Personal Genome Machine (PGM, Ion Torrent) were prepared using the Ion Plus Fragment Library Kit or amplicon fusion primers. Emulsion PCR was performed using the OneTouch (OT1, Ion Torrent). Sequencing was performed according to LifeTech protocol using the Ion PGM™ 200 Sequencing Kit. PCR reaction was done in 10 μl containing 1× FastStart High Fidelity reaction buffer (Roche), 1.8 mM MgCl2, 2% DMSO, 200 μM dNTPs, 0.5 U FastStart High Fidelity Enzyme Blend (Roche), 20 ng DNA, 300 nM universal barcoding primer, 300 nM reverse target primer and 30 nM forward target primer. After 10 min of initial denaturation at 95°C, 30 PCR cycles were performed at 20s 95°C, 30s 60°C and 40s 72°C. Primer sequences are provided in Supplementary Table S2.
TALEN design and transfection
28
Cha
pter 2
Results
Characterization of STRs
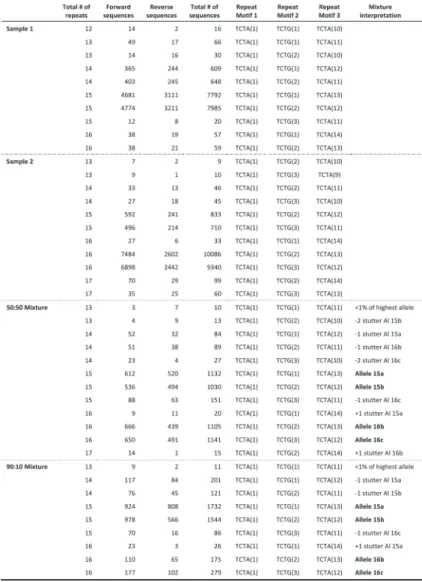
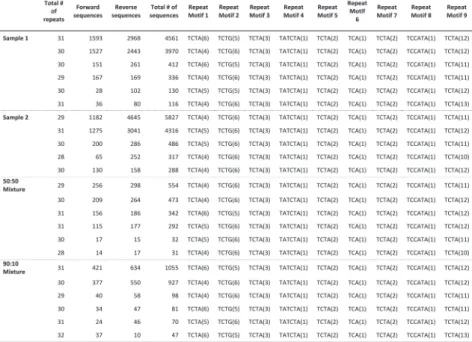
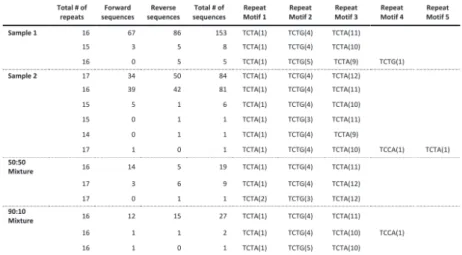
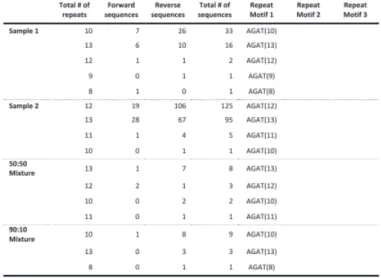
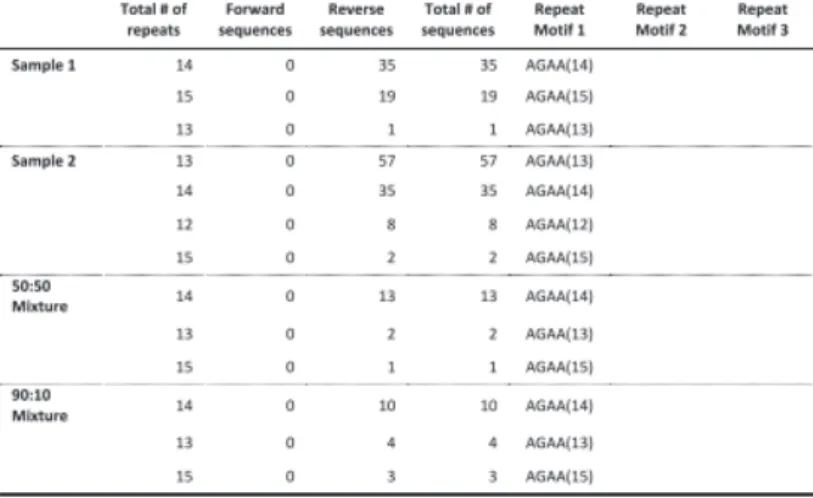
We tested the performance of TSSV in characterizing known STRs from Roche/454 targeted sequencing data of 16 STR loci, amplified in a multiplex reaction. To demonstrate the added value of TSSV over mainstream aligners, we generated four sequencing libraries of which two consisted of pure individual samples and two mixtures in the ratios of 50:50 and 90:10 with comparable depth of coverage (Supplementary Table S3). A full spectrum of STR structures and their abundance was generated after a semi-global alignment of the 25 bp flanking regions adjacent to the STR structure, with tolerance of up to three mismatches (Fig. 1A). On average, 8% of reads remained uncharacterized, mostly because the sequences did not cover both flanking reference sequences or that sequences contained too many mismatches for regions that are required for identification of unique flanking reference sequences (Supplementary Table S3). The PCR product used for preparing the sequencing libraries were generated using the Powerplex 16-kit from Promega, which is an assay designed and optimized for fluorescent dye-based fragment analysis of STR loci. This resulted in a strong imbalance in sequencing yield between STR markers with different dyes in the fragment analysis (Supplementary Table S3). Thus, we restricted the analysis to the three markers with highest coverage (D3S1358, TH01 and D13S317). Frequencies of the observed alleles were interpreted to distinguish actual alleles from slippage artifacts (Supplementary Tables S4–S6).
For D3S1358 (TCTA1 TCTG1-3 TCTA12–13), TSSV robustly identified the STR structure associated with each of the samples, with >91% of reads supporting the presence of two STR alleles (Fig. 1B). In addition, TSSV could pick up a minor frequency (7.25%) for alternative STR structures, in which the DNA amplicons show false STR structures because of DNA polymerase slippage during the amplification (Ellegren, 2004; Hauge and Litt, 1993). Despite the presence of PCR amplification artifacts, the major and minor STR structures in balanced and more extreme mixtures (50:50 and 90:10, respectively) could accurately be identified by TSSV (Fig. 1B and Supplementary Table S4).
29
pter 2
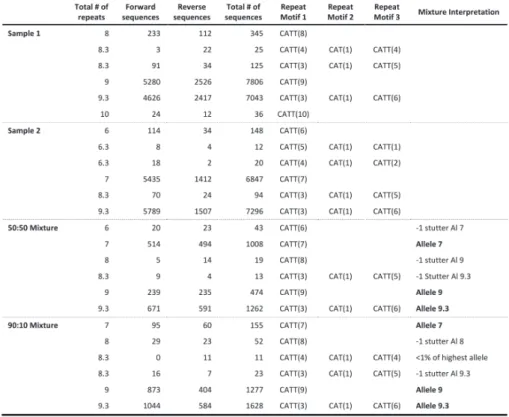
mixtures (TH01 markers) where a single STR allele is shared (Fig. 1C, Supplementary Tables S4–S6 and Supplementary Figs S2–S4). Results of the remaining STR markers are provided in supplementary materials, Supplementary Tables S7–S17.
30
Cha
pter 2
Determining de novo structural variations in TALEN-treated cells
TALENs have shown promising potential in site-specific genome editing (Boch, 2011; Cermak et al., 2011; Miller et al., 2011; Zhang et al., 2011). Their modular structure enables simple construction of TALENs that can specifically recognize virtually any DNA sequence of interest. On delivery of a TALENs-pair, a double strand break is introduced that is repaired by non-homologous end-joining, introducing a large variety of mutations (Supplementary Fig. S5). Because the method lacks a positive selection procedure, the applicability depends largely on its efficacy. We used TSSV to estimate the efficiency of genome editing in ES cells from a mouse model with the hDMD, stably integrated in the mouse genome (t Hoen et al., 2008), and determine the utility of an assembled TALEN pair (Supplementary Table S18) in introducing mutations within targeted intron 52 of the hDMD (Supplementary Fig. S6).
31
pter 2
Fig. 2.Variant characterization and quantification of TALEN-treated and Control ES Cells. (A) Basic statistics of the TSSV analysis. Pie charts show the proportion of sequencing reads that support the presence of new alleles in TALEN-treated (outer circle) or control (inner circle) ES Cells. No Start and No End fragments represent reads in which one of the flanking sequences was not recognized. (B) Total number of variants in TALEN-treated ES Cells and Controls, grouped by type. (C) Comparative analysis of the number of occurrences for individual variants in both samples. Data points are colored based on the type of variation. (D) Zoomed in scatter plot for variants with frequencies lower than 2000. (E) Empirical cumulative distribution of variant frequencies for TALEN-treated (red) and Control ES Cells (black). Kolmogorov–Smirnov test was performed to assess if two distributions are significantly different.
Detection of systematic errors in PGM Ion Torrent
32
Cha
pter 2
for PG090 (versions 2.2 and 3.0) while PG109 was only processed by version 3.0 (sequencing run was carried out after the upgrade of the Ion Torrent Suit). The three datasets enabled us to investigate potential artifacts derived from sequencing and/or different base-calling algorithms. Our first observation indicated a significant decrease in the total number of reads (average of 11.3 and 13.3% in respective to different runs and base-calling algorithms) that were recognized per individual (Supplementary Table S20). We also noticed a significant difference in the fraction of reads per dataset (44.3, 40.3 and 48.7%) that were reported as new alleles, having at least one mismatch with the reference sequence (Fig. 3B).Fig. 3. Identification of mutations within exon 19 of DMD gene. (A) Schematic representation of the locus of interest for resequencing, the design of unique flanking sequences (blue), and the targeted region (red) to be profiled using TSSV. (B) Pie charts show the proportion of reads that support the presence of new alleles (red) in sequencing library of patient 1. Pie charts represent different sequencing runs (PG090 or PG109) or the base-calling algorithm used during the primary analysis (01 or 02). The two most outer pie charts are sequencing reads from the same PGM Ion Torrent run processed using two different versions of base-calling algorithm. The most inner pie chart represents an independent run of the same library. (C) Number of observed variants separated by variation type. Percentages show the proportion of insertion events from the total number of variants in each set.
33
pter 2
Fig.4. Comparative analysis of observed mutations. (A) The total number of occurrences for variants to be observed on plus or minus strands is compared. Data points are colored based on the variation type. (B) Zoomed in scatter plot for variants with strand-specific frequency <500. (C) Sequencing data from the same sequencing run (PG090) are assessed for frequency of observed variants after the use of two different versions of base-calling algorithm. (D) Zoomed in scatter plot for variants with frequency <500 compared between two datasets generated using different base-caller algorithms
To study the possible nucleotide-specific biases, we quantified the frequency of all calls that predominantly occurred on one strand. Despite slight variation, substitutions were observed on both strands at a comparable rate. However, in each dataset, the majority of substituted bases were ‘A’s (59.2, 61.3 and 64.9%) and ‘T’s (28.1, 23.0 and 20.5%) that were predominantly substituted to ‘G’ and ‘C’, respectively (Fig. 5A). Insertions were primarily observed on the forward strand (94%, on average) while ‘A’ remained as the most affected base (77.7%, on average) across all samples (Fig. 5B and Supplementary Figs S9–S11).
34
Cha
pter 2
35
pter 2
Fig. 6. Most abundant sequences and validation by Sanger sequencing. (A) A list of most abundant sequences across different samples. The observed occurrence of each new allele is quantified per strand along with corresponding standard deviation. (B) The result of Sanger sequencing of the target locus is presented per sample. Arrows mark the location in which mutations are reported based on the PGM Ion Torrent sequenc-ing data.
Comparative analysis of TSSV performance
36
Cha
pter 2
Table S22). In addition, lobSTR does not provide information on allelic STR structure, as it only reports the copy number of the major and uninterrupted STR unit and ignores the information from other variable elements or variants outside the STR itself. Consequently, lobSTR failed to accurately detect the presence of mixed simples even in cases in which samples were mixed 50:50 (Supplementary Table S22). Although the information on strand specificity of the aligned reads is present in the alignment file, unlike TSSV, lobSTR does not provide the frequency in which each STR structure is observed. This is an important measure to detect inconsistencies and to rule out potential artifacts. RepeatSeq requires aligned data and uses predefined regions to characterize observed STR alleles. Thus, reads were mapped to the reference genome (hg19) using GS mapper, specifically designed for 454 sequencing data. RepeatSeq reported results for only one STR locus (D8S1179), despite sufficient coverage for a number of STR loci in the BAM file. After manipulating the region descriptions, we could not improve the efficiency of RepeatSeq in identifying the targeted STR loci. Thus, the result of RepeatSeq could not be used for a conclusive comparison with TSSV.Discussion
37
pter 2
library. We show that sensitivity of TSSV in determining allelic STR structures exceeds mixtures with only 10% representation of minor alleles and more complex mixtures in which a single STR allele is shared. The lower boundary of detecting minor allele frequencies is subject to experimental design and the complexity of the targeted locus that may result in variable rate of slippage and background noise. Our detailed analysis of three STR loci provides significant insights into forensic DNA fingerprinting of mixed samples while it confirms the feasibility of TSSV to profile causal allelic expansion of triplet, tetranucleotide or more complex repeat structures in variety of human disorders (Brook et al., 1992; Dere et al., 2004; Kremer et al., 1991; Mahadevan et al., 1992; Mirkin, 2007; Pearson et al., 2002; Verkerk et al., 1991).
Second, we sought to profile and annotate the full spectrum of de novo mutations introduced by TALENs that specifically target intron 52 of hDMD in mouse ES cells. The applicability of designed TALENs to introduce mutations in a targeted locus largely depends on its efficacy because this method lacks a selection procedure. Detected TALEN-specific editing events were almost exclusively insertions and deletions that fit the expected mutation profile of TALENs (Cermak et al., 2011). Although it has recently been reported that TALENs induce insertions at a much lower frequency than deletions (Kim et al., 2013), we have observed an extremely balanced rate of insertion and deletion events (37.26% versus 37.20%, respectively). Nevertheless, TALENs-induced deletions tend to affect more bases than insertions. We show that TSSV can resolve difficult-to-call editing events that affect the length of homopolymers based on the variant frequency in TALEN-treated ES cells versus controls. Moreover, the result of TSSV analysis of TALEN-treated and control ES cells suggests that observed de novo structural variants are predominantly caused by initiation of a double-strand break that is repaired by non-homologous end-joining mechanism and are not the result of sequencing errors. Notably, the Ion Torrent variant caller failed to identify any of the observed variants because of their complexity, and therefore does not provide any information on de novo allelic structures that were introduced.
38
Cha
pter 2
patients who are expected to have only one copy of the X-chromosome. Across all samples, the majority of detected variations were single nucleotide insertions ( 62%), excluding duplications, that were mostly the result of a single ‘A’ insertion (78%). Surprisingly, insertions were predominantly specific to the plus strand (94%) that can be the result of flow order in specific sequence contexts. Although the second base-caller improved the deletions and duplications rates that were derived from over- or under-calling of homopolymers, the insertion rates remained unchanged. We further observed a preference for erroneous substitution events that were more pronounced in the second base-caller. However, we were unable to identify motifs that may be associated with observed biases. We argue that the result of TSSV analysis and its ability to provide a high-resolution map of variants ever more highlights the importance of robust and vigorous assessment of downstream analysis as we generate volumes of sequencing data to identify rare mutations and in the advent of NGS in clinical diagnosis.To demonstrate the added value of TSSV over mainstream STR profiling tools, we ran lobSTR (Gymrek et al., 2012) and RepeatSeq (Highnam et al., 2013) on four samples used for resolving allelic STR structures. Because RepeatSeq hardly reported any STR markers, the performance of TSSV could only be compared with that of lobSTR. We show that TSSV robustly and accurately resolved allelic STR structures with differing complexity. TSSV outperformed lobSTR in reporting the accurate copy number of major STR unit while it provides additional information on allelic STR structures and their strand-specific frequencies. Notably, TSSV excelled in resolving complex mixtures, whereas lobSTR failed to differentiate STR structures associated with different samples, and therefore produced unreliable and inaccurate estimations. Although lobSTR performs well on genotyping diploid samples, there is a clear need for tools to resolve mixtures with differing level of complexity and abundance.
Currently, the major limitation of TSSV is the sequencing read length because the detectable allelic structures are restricted to those that can entirely be covered by a single read. Thus, we envision that the immediate developmental outlook for TSSV can be the inference of allelic locus structure by local assembly of partial reads (reads with only one recognizable flanking region) combined with the comparative analysis of coverage of targeted loci and flanking regions. Furthermore, the promise of novel sequencing technologies (such as Pacific Biosciences RS II), and therefore significant increase in read length will aid the study of larger structural variations.
39
pter 2
Ye et al., 2009) have facilitated the study of experimental data on an unprecedented scale to better understand the functional consequences of genetic variations. TSSV complements the existing tools by aiding the study of unknown, uncharacterized or highly polymorphic and repetitive short structural variations that can be used in a wide range of applications, from personal genomics to forensic analysis and clinical diagnostics.
Acknowledgements
The authors thank Dr. Annemieke Aartsma-Rus for her constructive feedback and discussions. S.Y.A. and K.J.vdG. performed the analyses. S.Y.A., K.J.vdG., M.H.A.M.V., J.S.V., P.dK. and J.F.J.L. designed the study. S.Y.A., K.J.vdG., J.W.F.vdH. and J.F.J.L. were involved in developing the tool. M.H.A.M.V., R.H.A.M.V., R.H.dL., C.B. and H.P.J.B. performed the wet-lab experiments and sequencing. J.T.dD., P.dK. and J.F.JL. coordinated the study. S.Y.A. drafted the manuscript that was subsequently revised by all co-authors.
Funding: This work was partially supported by the Centre for Molecular Systems Biology (CMSB), Duchenne Parent Project (the Netherlands) and a grant from the Netherlands Genomics Initiative (NGI)/Netherlands Organization for Scientific Research (NWO) within the framework of the Forensic Genomics Consortium Netherlands.
Conflict of Interest: none declared.
References
• Alkan,C. et al. (2011) Genome structural variation discovery and genotyping. Nat. Rev. Genet., 12, 363–376.
• Anvar,S.Y. (2013a) Allele-specific characterization of STR structures in pure and mixed forensic samples using TSSV,
• Anvar,S.Y. (2013b) Characterization of DeNovo structural variations induced by TALENs targeting hDMD in mouse ES cells using TSSV, http://dx.doi.org/10. 6084/ m9.figshare.757790.
• Anvar,S.Y. (2013c) Characterizing IonTorrent PGM Error Profiles using TSSV, • Boch,J. (2011) TALEs of genome targeting. Nat. Biotechnol., 29, 135–136.
• Brook,J.D. et al. (1992) Molecular basis of myotonic dystrophy: expansion of a trinucleotide (CTG) repeat at the 30 end of a transcript encoding a protein kinase family member. Cell, 69, 385.
• Cermak,T. et al. (2011) Efficient design and assembly of custom TALEN and other TAL effector-based constructs for DNA targeting. Nucleic Acids Res., 39, e82.
40
Cha
pter 2
structural variation. Nat. Methods, 6, 677–681.• Conrad,D.F. et al. (2010) Origins and functional impact of copy number variation in the human genome. Nature, 464, 704–712.
• Costello,M. et al. (2013) Discovery and characterization of artifactual mutations in deep coverage targeted capture sequencing data due to oxidative DNA damage during sample preparation. Nucleic Acids Res., 41, e67.
• de Cid,R. et al. (2009) Deletion of the late cornified envelope LCE3B and LCE3C genes as a susceptibility factor for psoriasis. Nat. Genet., 41, 211–215.
• DePristo,M.A. et al. (2011) A framework for variation discovery and genotyping using next-generation DNA sequencing data. Nat. Genet., 43, 491–498.
• Dere,R. et al. (2004) Hairpin structure-forming propensity of the (CCTG.CAGG) tetranucleotide repeats contributes to the genetic instability associated with myotonic dystrophy type 2. J. Biol. Chem., 279, 41715–41726.
• Ellegren,H. (2004) Microsatellites: simple sequences with complex evolution. Nat. Rev. Genet., 5, 435–445.
• Girirajan,S. et al. (2011) Relative burden of large CNVs on a range of neurodevelopmental phenotypes. PLoS Genet., 7, e1002334.
• Goya,R. et al. (2010) SNVMix: predicting single nucleotide variants from nextgeneration sequencing of tumors. Bioinformatics, 26, 730–736.
• Gymrek,M. et al. (2012) lobSTR: A short tandem repeat profiler for personal genomes. Genome Res., 22, 1154–1162.
• Hauge,X.Y. and Litt,M. (1993) A study of the origin of ‘shadow bands’ seen when typing dinucleotide repeat polymorphisms by the PCR. Hum. Mol. Genet., 2, 411–415. • Highnam,G. et al. (2013) Accurate human microsatellite genotypes from highthroughput
resequencing data using informed error profiles. Nucleic Acids Res., 41, e32.
• Hinds,D.A. et al. (2006) Common deletions and SNPs are in linkage disequilibrium in the human genome. Nat. Genet., 38, 82–85.
• Hollox,E.J. et al. (2008) Psoriasis is associated with increased beta-defensin genomic copy number. Nat. Genet., 40, 23–25.
• Iafrate,A.J. et al. (2004) Detection of large-scale variation in the human genome. Nat. Genet., 36, 949–951.
• Kayser,M. and de Knijff,P. (2011) Improving human forensics through advances in genetics, genomics and molecular biology. Nat. Rev. Genet., 12, 179–192.
• Kidd,J.M. et al. (2008) Mapping and sequencing of structural variation from eight human genomes. Nature, 453, 56–64.
• Kim,Y. et al. (2013) TALENs and ZFNs are associated with different mutation signatures. Nat. Methods, 10, 185.
• Kimura,M. et al. (2009) Rapid variable-number tandem-repeat genotyping for Mycobacterium leprae clinical specimens. J. Clin. Microbiol., 47, 1757–1766.
• Koboldt,D.C. et al. (2009) VarScan: variant detection in massively parallel sequencing of individual and pooled samples. Bioinformatics, 25, 2283–2285.
• Kremer,E.J. et al. (1991) Mapping of DNA instability at the fragile X to a trinucleotide repeat sequence p(CCG)n. Science, 252, 1711–1714.
• Langmead,B. and Salzberg,S.L. (2012) Fast gapped-read alignment with Bowtie 2, Nat. Methods, 9, 357–359.
41
pter 2
• Li,H. and Homer,N. (2010) A survey of sequence alignment algorithms for nextgeneration sequencing. Brief. Bioinform., 11, 473–483.
• Mahadevan,M. et al. (1992) Myotonic dystrophy mutation: an unstable CTG repeat in the 3’ untranslated region of the gene. Science, 255, 1253–1255.
• McCarroll,S.A. et al. (2009) Donor-recipient mismatch for common gene deletion polymorphisms in graft-versus-host disease. Nat. Genet., 41, 1341–1344.
• McKenna,A. et al. (2010) The genome analysis toolkit: a mapreduce framework for analyzing next-generation DNA sequencing data. Genome Res, 20, 1297–1303. • Medvedev,P. et al. (2009) Computational methods for discovering structural variation
with next-generation sequencing. Nat. Methods, 6, S13–S20.
• Miller,J.C. et al. (2011) A TALE nuclease architecture for efficient genome editing. Nat. Biotechnol., 29, 143–148.
• Mills,R.E. et al. (2011) Mapping copy number variation by population-scale genome sequencing. Nature, 470, 59–65.
• Mirkin,S.M. (2007) Expandable DNA repeats and human disease. Nature, 447, 932–940. • Moretti,T.R. et al. (2001) Validation of short tandem repeats (STRs) for forensic usage: performance testing of fluorescent multiplex STR systems and analysis of authentic and simulated forensic samples. J. Forensic Sci., 46, 647–660.
• Pearson,C.E. et al. (2002) Slipped-strand DNAs formed by long (CAG)*(CTG) repeats: slipped-out repeats and slip-out junctions. Nucleic Acids Res., 30, 4534–4547.
• Pearson,C.E. et al. (2005) Repeat instability: mechanisms of dynamic mutations. Nat. Rev. Genet., 6, 729–742.
• Pinto,D. et al. (2010) Functional impact of global rare copy number variation in autism spectrum disorders. Nature, 466, 368–372.
• Redon,R. et al. (2006) Global variation in copy number in the human genome. Nature, 444, 444–454.
• Sebat,J. et al. (2004) Large-scale copy number polymorphism in the human genome. Science, 305, 525–528.
• Smith,T.F. and Waterman,M.S. (1981) Identification of common molecular subsequences. J. Mol. Biol., 147, 195–197.
• Stephens,P.J. et al. (2011) Massive genomic rearrangement acquired in a single catastrophic event during cancer development. Cell, 144, 27–40.
• Sudmant,P.H. et al. (2010) Diversity of human copy number variation and multicopy genes. Science, 330, 641–646.
• Sutherland,G.R. and Richards,R.I. (1995) Simple tandem DNA repeats and human genetic disease. Proc. Natl Acad. Sci. USA, 92, 3636–3641.
• t Hoen,P.A.et al. (2008) Generation and characterization of transgenic mice with the full-length human DMD gene. J. Biol. Chem., 283, 5899–5907.
• Treangen,T.J.andSalzberg,S.L.(2012)Repetitive DNA and next-generation sequencing: computational challenges and solutions. Nat. Rev. Genet., 13, 36–46.
• Tuzun,E. et al. (2005) Fine-scale structural variation of the human genome. Nat. Genet., 37, 727–732.
• Veltrop,M.H.A.M. et al. (2013) Generation of embryonic stem cells and mice for duchenne research. PLoS Currents Muscular Dystrophy, 1.
42
Cha
pter 2
• Warshauer,D.H. et al. (2013) STRait Razor: a length-based forensic STR allelecalling tool for use with second generation sequencing data. Forensic Sci. Int. Genet., 7, 409–417. • Weber,J.L. and May,P.E. (1989) Abundant class of human DNA polymorphisms whichcan be typed using the polymerase chain reaction. Am. J. Hum. Genet., 44, 388–396. • Weischenfeldt,J. et al. (2013) Phenotypic impact of genomic structural variation: insights
from and for human disease. Nat. Rev. Genet., 14, 125–138.
• Wildeman,M. et al. (2008) Improving sequence variant descriptions in mutation databases and literature using the Mutalyzer sequence variation nomenclature checker. Hum. Mutat., 29, 6–13.
• Ye,K. et al. (2009) Pindel: a pattern growth approach to detect break points of large deletions and medium sized insertions from paired-end short reads. Bioinformatics, 25, 2865–2871.
43
pter 2
Supplementary materials
Methodology (extended)
We developed a method to characterise short structural variations (TSSV) which is made available online. In this section, we describe the functionality and design of this program. Calibration of the algorithm and the output is done with optional command line arguments. TSSV can be installed via pip install tssv command.
Input – Our method expects two input files: one file containing sequencing data in FASTA format and one file containing the library description. The format of this description is shown in Table S1. The last column of the description is compiled into a regular expression. This regular expression is used to distinguish between known and unknown alleles.
Marker Alignment – Each pair of flanking markers is aligned to each read by using semi- global pairwise alignment, a modified version of the Smith- Waterman algorithm. In this adaptation, the alignment matrix is initialised with penalties for the aligned sequence, but not for the reference sequence. By using this approach, we can use the alignment matrix for the calculation of the edit distance between the aligned sequence and all substrings of the reference sequence. Finally, we use the alignment matrix to select the rightmost alignment with a minimum edit distance. To guarantee that this method is symmetrical with regard to the reverse complement, we align the reverse complement of the right marker to the reverse complement of the reference sequence.
Allele Identification – If a marker pair can be aligned to either the forward or reverse complement of the reference sequence, we can select the area of interest by extracting the sequence between the alignment coordinates and by converting it into the forward orientation. This area of interest can then be matched to the regular expression of that marker pair. Depending on the match, we either classify the area of interest as a known or new allele.
44
Cha
45
pter 2
Figure S1 – The speed of TSSV in characterizing known and novel alleles. Four datasets with different number of reads were profiled for 16 STR loci. The analysis was performed on a desktop PC (Intel Core i7 860, 2.80GHz) and a cluster node (Intel Xeon E5- 2660, 2.20GHz). ost abun-dant sequences and validation by Sanger sequencing. (A) A list of most abunabun-dant sequences across different samples. The observed
46
Cha
pter 2
47
pter 2
48
Cha
49
pter 2
50
Cha
pter 2
Table S7 -
Sequence numbers and allele structure of D21S11 Short Tandem
Repeat (6 most frequent alleles for every sample.)
Table S8 -
Sequence numbers and allele structure of D16S539 Short Tandem
Repeat (6 most frequent alleles for every sample.)
51
pter 2
Table S9 -
Sequence numbers and allele structure of TPOX Short Tandem
Repeat (6 most frequent alleles for every sample.)
52
Cha
pter 2
Table S11 -
Sequence numbers and allele structure of D7S820 Short Tandem
Repeat (6 most frequent alleles for every sample.)
53
pter 2
Table S13 -
Sequence numbers and allele structure of D8S1179 Short Tandem
Repeat (6 most frequent alleles for every sample.)
Table S14 -
Sequence numbers and allele structure of CSF1P0 Short Tandem
Repeat (6 most frequent alleles for every sample.)
54
Cha
pter 2
Table S15 -
Sequence numbers and allele structure of D18S51 Short Tandem
Repeat (6 most frequent alleles for every sample.)
Table S16 -
Sequence numbers and allele structure of D5S818 Short Tandem
Repeat (6 most frequent alleles for every sample.)
55
pter 2
Table S17 -
Sequence numbers and allele structure of Penta E Short Tandem
Repeat (6 most frequent alleles for every sample.)
56
Cha
pter 2
Figure S3 – The percentage of reads supporting detected allele-structure of D13S317 Short Tandem Repeat. Black bars depict reads supporting the forward strand and grey bars correspond to the proportion of reads supporting the reverse complement.
57
pter 2
Figure S5 - Schematic representation of TALEN design and targeted resequencing. TALEN-pairs were designed to specifically target intron 52 of the hDMD in mouse ES Cells. The binding sites of TALEN-pairs are 21bp long (blue). After successful transfection, TALENs initiate a double strand break within the target locus of 19bp (red). The 135bp fragment encompassing the entire targeted region was PCR-amplified, sequenced, and analysed using TSSV.
Table S18 –
Target sequence of the TALENS targeting intron 52 of the hDMD
gene.
58
Cha
pter 2
Table S19 –
Basic statistics on sequencing reads from TALEN-treated and
control ES Cells.
59
pter 2
60
Cha
pter 2
61
pter 2
62
Cha
pter 2
63
pter 2
Table S21 –
General statistics on identification of informative reads for STR
profiling of samples using lobSTR.
Table S22 –
lobSTR performance in identification and characterization of allele
specific STR structures.
64
Cha
Chapter 3
Forensic Nomenclature for Short Tandem
Repeats updated for sequencing
67
pter 3
Abstract
The introduction of Massive Parallel Sequencing (MPS) techniques enables sequencing of Short Tandem Repeats (STR) as a new tool for forensic research. In addition to variation in fragment-length, MPS also reveals allelic sequence-variation in STR-fragments. This additional variation demands a new way of describing allelic variants. Here we propose a nomenclature of MPS-derived STR alleles for use in forensic research.
Introduction
For over two decades, the analysis of Short Tandem Repeats (STRs) in forensics was routinely performed using Capillary Electrophoresis (CE). With CE, the length of a DNA fragment containing an STR is determined. STR alleles are identified by comparing unknown fragment lengths with a reference allelic ladder containing fragments with known repeat-lengths. The use of a simple number, representing the number of repeats was sufficient as nomenclature for STR allele variation. Recent developments in Massive Parallel Sequencing (MPS) technologies enable high-throughput sequencing of STRs, revealing additional sequence-variation in many of the STRs [1, 2]. A uniform nomenclature for MPS-STR alleles describing this additional variation still needs to be developed. Here, we propose a universal way of describing STR allele variation, specifically designed for use in forensic casework.
Material and Methods
68
Cha
pter 3
Results
In several studies, MPS of STRs revealed substantial sequence variation in addition to that already described in STRbase [2, 4]. For comparison of published data and, more importantly, for comparison of profiles among databases, it is important that a uniform and straight-forward nomenclature is used. For this nomenclature several aspects should be taken into consideration:
• Different MPS assays will be used to analyse the same markers, introducing variation in the genome-coordinates of the analysed fragment containing an STR (fragments of different assays will not completely overlap).
• Allele-nomenclature should be compact and readable. However, allele-description should also contain all relevant information to reconstruct the original sequence.
• A direct comparison between CE- and MPS-results should be possible.
For CE-nomenclature, ranges have been determined in the past, defining the genomic coordinates of the STRs. For some STRs (like the example of D13S317 discussed below), additional repeating elements adjacent to the defined STR turned out to vary in length resulting in a difference between the total number of variable repeat-units for sequencing and the CE allele-count. Here, we determined genomic coordinates for the region in which STR-variation has been observed for 22 commonly used autosomal STRs (Figure 1a) in the following way:
The start-position of the STR-motif represents the first possible position while retaining maximum length for the longest repeated element. Any repeated elements directly adjacent to the STR of at least three repeats long was included as part of the STR-region. If a complex repeat consists of multiple blocks, interruptions were divided into blocks of the same length where possible (D2S1338, D21S11, FGA and vWA in figure 1a).
For studies of genome variation, HGVS-nomenclature rules [5] describe almost any possible type of genomic variation including STRs. Based on the STR-variation analysed in this study we propose general rules for a straightforward forensic nomenclature that describes sequence-variation in STRs and flanking regions. We mostly follow HGVS-guidelines but some specific rules are optimised for the intended use in forensics.