Contents lists available atScienceDirect
Physics Letters B
www.elsevier.com/locate/physletb
Probing the critical behavior in the evolution of GDR width
at very low temperatures in
A
∼
100 mass region
Balaram Dey
a, Debasish Mondal
a, Deepak Pandit
a, S. Mukhopadhyay
a, Surajit Pal
a,
Srijit Bhattacharya
b, A. De
c, K. Banerjee
a, N. Dinh Dang
d, N. Quang Hung
e,
S.R. Banerjee
a,
∗
aVariable Energy Cyclotron Centre, 1/AF-Bidhannagar, Kolkata 700064, India bDepartment of Physics, Barasat Govt. College, Barasat, N 24 Pgs, Kolkata 700124, India cDepartment of Physics, Raniganj Girls’ College, Raniganj 713358, India
dTheoretical Nuclear Physics Laboratory, RIKEN Nishina Center for Accelerator-Based Science, RIKEN, 2-1 Hirosawa, Wako city, Saitama 351-0198, Japan eSchool of Engineering, Tan Tao University, Tan Tao University Avenue, Tan Duc Ecity, Duc Hoa, Long An Province, Viet Nam
a r t i c l e
i n f o
a b s t r a c t
Article history:
Received 4 October 2013
Received in revised form 5 February 2014 Accepted 6 February 2014
Available online 14 February 2014 Editor: V. Metag
Keywords:
Low temperature GDR width
Adiabatic thermal shape fluctuation model Critical temperature included fluctuation model
Phonon damping model
The influence of giant dipole resonance (GDR) induced quadrupole moment on GDR width at low temperatures is investigated experimentally by measuring GDR width systematically in the unexplored temperature range T=0.8–1.5 MeV, for the first time, in A∼100 mass region. The measured GDR widths, using alpha induced fusion reaction, for 97Tc confirm that the GDR width remains constant
at the ground state value up to a critical temperature and increases sharply thereafter with increase in T. The data have been compared with the adiabatic Thermal Shape Fluctuation Model (TSFM), phenomenological Critical Temperature Fluctuation Model (CTFM) and microscopic Phonon Damping Model (PDM). Interestingly, CTFM and PDM give similar results and agree with the data, whereas the TSFM differs significantly even after incorporating the shell effects.
©2014 Elsevier B.V. This is an open access article under the CC BY license (http://creativecommons.org/licenses/by/3.0/). Funded by SCOAP3.
One of the fascinating areas of experimental nuclear physics has been the study of the giant dipole resonance (GDR) built on the excited states of atomic nuclei. These experimental studies, over the years, have shown that the GDR width increases with both temperatureT and angular momentum J, whereas its centroid en-ergy remains mostly unchanged asT and J vary[1,2]. It is worth mentioning that the effect of J andT on GDR width becomes no-ticeable only above a critical angular momentum, Jc
∼
0.
6A5/6 [3] and T≈
1 MeV. Although a wealth of data exists on the angular momentum dependence of GDR width in different mass regions[4–10], the measurement of the GDR width at low temperatures
(T
<
1 MeV) is rather scarce due to the experimental difficulties in populating the nuclei at low excitation energies. The present work aims at providing systematic experimental data on GDR width at this very low temperature region. It is also our endeavor to sys-tematically assess different theoretical models and understand the complete nature of the damping mechanism as a function ofT in-side the atomic nucleus.*
Corresponding author.E-mail address:[email protected](S.R. Banerjee).
A number of theoretical approaches have been proposed to demonstrate the behavior of GDR width as a function ofT and J. Microscopically, the increase of GDR width as a function ofT is de-scribed reasonably well within the Phonon Damping Model (PDM)
[11–13]. The PDM calculates the GDR width and the strength
func-tion directly in the laboratory frame without any need for an explicit inclusion of thermal fluctuation of nuclear shapes. Inter-estingly, the macroscopic Thermal Shape Fluctuation Model (TSFM)
[14–21], on the other hand, is based on the fact that
large-amplitude thermal fluctuations of nuclear shape play an important role in describing the increase of GDR width as a function of T. This model explains very well the J dependence of the GDR width, the mass dependence of the critical angular momentum (Jc) and the Jacobi shape transition [20,21]. However, it is unable to ex-plain the T dependence below 1.5 MeV in different mass regions
[22–26]. Recently, a new model has been proposed by modifying
the phenomenological parameterization (pTSFM) [3]based on the TSFM and is called the Critical Temperature included Fluctuation Model (CTFM) [26]. The CTFM provides a good description of the behavior of GDR width for bothT and J in the entire mass region
[26–28]. Unfortunately, the number of GDR width measurements
till now at T
<
1 MeV are inadequate to test either the criticalhttp://dx.doi.org/10.1016/j.physletb.2014.02.007
behavior of the GDR width or to conclude that the GDR width re-mains nearly constant at the ground state value belowT
∼
1 MeV as predicted by both PDM and CTFM.In order to examine the above queries regarding the behavior of GDR apparent width as function ofT, a systematic measurement of GDR apparent width in the unexplored region (T
=
0.
8–1.
5 MeV) was performed for97Tc using alpha induced fusion reactions. This is the first measurement of GDR width at finite temperature in theA
∼
100 mass region. The measured GDR apparent widths, both above and below the critical point, can be effectively used to verify the existing theoretical models.The experiments were performed at the Variable Energy Cy-clotron Centre (VECC), Kolkata. A self supporting 1 mg
/
cm2 thick 93Nb target was bombarded with alpha beams produced by theK-130 cyclotron. Four different beam energies of 28, 35, 42 and 50 MeV were used to form the compound nucleus (CN)97Tc at
the excitation energies of 29
.
3,
36,
43 and 50.
4 MeV, respectively. The high energyγ
-rays from the decay of97Tc were detectedus-ing the high energy photon spectrometer LAMBDA[29]. A part of the spectrometer consisting of 49 BaF2 detectors (each having
di-mension of 3
.
5×
3.
5×
35 cm3), was arranged in a 7×
7 matrix configuration. The spectrometer was placed at a distance of 50 cm from the target (covering 1.
8% of 4π) and at an angle of 90◦ with the beam axis. Along with the LAMBDA spectrometer, a 50 element low energyγ
-multiplicity filter[30]was also used to estimate the angular momentum populated in the CN as well as to get a fast start trigger for time-of-flight (TOF) measurement. The multiplicity filter was split into two blocks of 25 detectors each, in a staggered castle type geometry to equalize the solid angle for each multi-plicity detector element, and placed at a distance of 5 cm above and below the centre of the target. The efficiency of the multiplic-ity set-up was 56% as calculated using GEANT4 [31] simulation. The TOF technique was used to separate neutron background in the high-energyγ
-spectrum. Pile up events were rejected using the pulse shape discrimination (PSD) technique by measuring the charge deposition over two integrating time intervals (50 ns and 2 μs) in each of the detectors.The experimentally measured fold distributions were converted into angular momentum distributions using a realistic technique [30] based on GEANT4 simulation. The measured fold distribu-tion for the reacdistribu-tion4He
+
93Nb at 42 MeV incident energy is shown inFig. 1a. The extracted angular momentum distributions corresponding to different folds have also been shown inFig. 1b. Recently, the inverse level density parameter (k) was extracted from evaporated neutrons, protons and alpha particles[32] from the same system at 35 MeV. It was observed that the absolute values ofkobtained from different particle spectra were different but in all cases the value ofk decreased with increase in angular momentum. Hence, to fix the inverse level density parameter, the evaporated neutron spectrum was also measured independently by employing a liquid organic scintillator (BC501A) based neutron de-tector [33] in coincidence with theγ
-multiplicities. The neutron detector was placed at a distance of 1.5 m from the target posi-tion at an angle of 90◦with respect to the beam axis. The neutron TOF spectra were converted to energy spectra by considering the promptγ
-peak as time reference. Efficiency correction for the neu-tron detector was carried out using GEANT4 simulation[31]. The evaporated neutron energy spectra corresponding to different folds were compared with the CASCADE calculation [34] to determine the nuclear level density (NLD) parameter using aχ
2minimizationtechnique in the energy range of 2–7 MeV (Fig. 2, right panel). The fold distribution measured in coincidence with neutrons is com-pared with the fold distribution obtained in coincidence with high energy
γ
-rays for 42 MeV incident energy (as shown inFig. 1a).Fig. 1. (Color online.) Top panel: Measured fold distributions with high energy γ-rays (filled circles) and with neutrons (open circles) along with the GEANT4 simulation. Bottom panel: Angular momentum distributions for different folds at 42 MeV incident energy along with the incident distribution (dot-dashed with sym-bols).
The good match between the two fold distributions indicates that the populated spin distributions in both cases are similar.
The high energy
γ
-ray spectra for different folds of the mul-tiplicity filter (Fig. 2, left panel) were extracted in offline analysis using the cluster summing technique [29]. GDR widths were ob-tained from the measured high energyγ
-ray spectra by comparing it with the statistical model calculation CASCADE along with a bremsstrahlung component. Bremsstrahlung emission was param-eterized by the exponential function (e−Eγ/E0). E0 was adopted
from the systematicE0
=
1.
1[
(
ELab−
Vc)/
Ap]
0.72[35], whereELab,Vc and Ap represent the beam energy, Coulomb barrier and pro-jectile mass, respectively. The systematic was verified earlier[25] for alpha beams at similar energies by measuring the angular dis-tribution of
γ
-rays arising from the non-statistical component. The CASCADE calculation as well as the bremsstrahlung component (both folded with the detector response function) are shown inFig. 4along with the experimental data at 28 and 50 MeV incident
energies. The response function of the LAMBDA spectrometer was generated using GEANT4 simulation. In the statistical model cal-culation, a single Lorentzian GDR strength function was assumed, having centroid energy (EGDR) and width (
Γ
) as parameters. Theother parameters were kept fixed as used for describing the neu-tron evaporation spectra. The moment of inertia of the CN was taken as I
=
I0(
1+
δ
1J2+
δ
2J4)
, where I0 is the moment ofin-ertia of the spherical nucleus. The parametersr0,
δ
1 andδ
2 werekept at their default values of 1.2 fm, 0
.
9×
10−5 and 2.
0×
10−8,respectively. The level density prescription of Ignatyuk [36] was taken with the asymptotic level density parameters as extracted from the corresponding neutron evaporation spectra. The simu-lated spin distributions deduced from the experimental fold dis-tributions were used as inputs for different folds for both neutron and high energy
γ
-ray analyses. The GDR widths were obtained from the best fit statistical model calculations using aχ
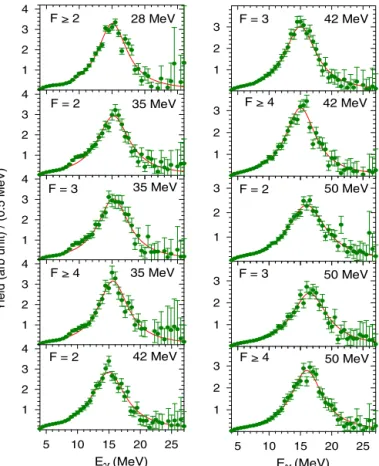
2Fig. 2.(Color online.) The high energyγ-ray spectra (filled circles) along with the CASCADE predictions (continuous line) for different folds (F) (left panel) and the neutron evaporation energy spectra (filled circles) along with the CASCADE predic-tions (continuous line) for different folds (F) (right panel) at incident energies of 28, 35, 42 and 50 MeV.F=2 andF=3 data have been multiplied by 100 and 10, respectively.
are the experimental and best fitted CASCADE spectra, respectively, corresponding to the single Lorentzian function F
(
Eγ)
.As
γ
-rays from the GDR are emitted from various steps of the compound nuclear decay chain, the average values of J andT have been considered. While estimating the average tempera-ture, a lower limit in the excitation energy (E∗) during the CN decay process was employed in the statistical model calculation in accordance with the prescription described in Refs.[37,38]. This lower limit in E∗ is selected when the cut off in the excitation energy only affects the
γ
-emission at very low energy but does not alter the GDR region. The average value of T was calculated fromE∗ using the relationT= [(
E∗−
Erot−
EGDR−
Ep)/
a(
E∗)]
1/2, wherea(
E∗)
is the excitation energy-dependent level density pa-rameter and Ep is the pairing energy. Erot was computed at J within the CASCADE corresponding to each fold. E∗ is the aver-age of the excitation energy weighted over the daughter nuclei forγ
-emission in the GDR region from Eγ=
10–20 MeV given as E∗=
E∗iwi/
wi.E∗i is the excitation energy ofith nuclei in the decay steps andwiis the yield in the region Eγ
=
10–20 MeV. Theextracted GDR parameters, T and J are given inTable 1. The er-ror estimation of temperature includes the uncertainty in the level density parameter, the effect of varying GDR centroid energy and the width of the selected angular momentum distribution. It needs to be mentioned that nuclear deformation was not included in our statistical calculation. Hence, we report on the extraction of the GDR apparent widths and compare them with the different mod-els, which also provide the apparent width of the GDR.
The GDR widths measured in the present work at low T
(0.8–1.5 MeV) are shown inFig. 5a. The data have been compared with the theoretical predictions based on the TSFM. Within this
Fig. 3.(Color online.) Linearized GDR plots are shown (symbols) using the quantity
F(Eγ)Yexp(Eγ)/Ycal(Eγ), whereYexp(Eγ)and Ycal(Eγ)are the experimental and best fitted CASCADE spectra, respectively, corresponding to the single Lorentzian functionF(Eγ)used in the CASCADE (continuous line).
Fig. 4.(Color online.) The experimentalγ-ray energy spectra (symbols) at 28 and 50 MeV are compared with the CASCADE prediction along with the bremsstrahlung component (continuous line). The individual CASCADE (dotted) and bremsstrahlung (dashed) component are also shown.
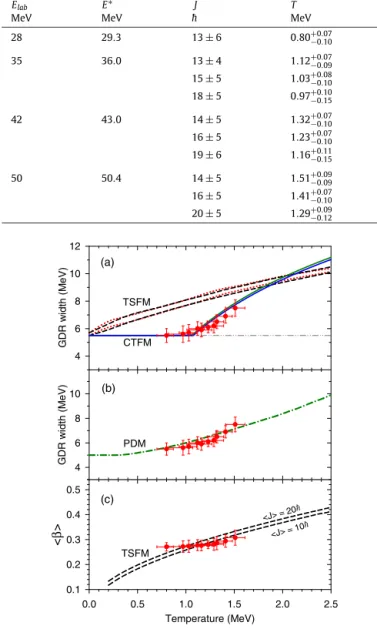
Table 1
Average temperatures and average angular momenta along with level density parameters, GDR widths, centroid energies and bremsstrahlung parameters at different beam energies.
Elab
MeV
E∗
MeV
J
¯
h
T
MeV
a
MeV−1
GDR width MeV
EGDR MeV
E0 MeV
28 29.3 13±6 0.80+0.07
−0.10 A/(8.0±0.4) 5.5±0.5 15.2±0.1 2.4 35 36.0 13±4 1.12−+00..0709 A/(9.7±0.5) 6.0±0.5 15.5±0.1 3.4
15±5 1.03+0.08
−0.10 A/(9.5±0.3) 5.7±0.6 15.5±0.1 3.4 18±5 0.97+0.10
−0.15 A/(8.2±0.4) 5.6±0.6 15.4±0.1 3.4 42 43.0 14±5 1.32+0.07
−0.10 A/(9.0±0.4) 6.5±0.5 15.3±0.1 4.2 16±5 1.23+0.07
−0.10 A/(8.1±0.4) 6.1±0.4 15.3±0.1 4.2 19±6 1.16+0.11
−0.15 A/(7.8±0.5) 5.9±0.5 15.3±0.1 4.2 50 50.4 14±5 1.51+0.09
−0.09 A/(9.2±0.5) 7.5±0.6 16.4±0.1 4.8 16±5 1.41−+00..0710 A/(8.5±0.4) 6.9±0.5 16.6±0.1 4.8 20±5 1.29−+00..0912 A/(8.2±0.4) 6.2±0.5 16.3±0.1 4.8
Fig. 5.(a) GDR width as a function of temperature. Experimental data (symbols) have been compared with the TSFM calculations with shell effect (dotted lines) and without shell effect (dashed lines) are shown for J=0h¯(lower) and J=30¯h (up-per). The CTFM predictions forJ=10h¯(lower) andJ=20¯h(upper) are shown with continuous lines. The double dot-dashed line represents the ground state value of the GDR width. (b) The PDM prediction is shown by the dotted–dashed. (c) The em-pirical deformations (symbols) extracted from the experimental GDR widths com-pared with the TSFM predictions (dashed lines) at two angular momenta.
to take into consideration the effect of evaporation of particles and the corresponding energy loss before the GDR
γ
-emission in the CN decay chain. In this low temperature region, the particle decay width is rather small (∼
0.
2 MeV at T=
2 MeV) and its inclusion within the TSFM marginally improves the prediction. The predic-tions of TSFM at J=
0 and J=
30h¯
are shown in Fig. 5a and compared with the experimental data. As can be seen, the adia-batic TSFM differs significantly from the experimental data in the entire region. This interesting result clearly suggests that the sup-pression of the GDR width at these lowT is a general feature for all nuclei and cannot be explained including only shell effects. It is also very interesting and important point to note that the GDR width data indeed remains nearly constant tillT∼
1 MeV (Fig. 5a) and increases thereafter as predicted by PDM and CTFM. In orderto compare the data with CTFM, the ground state GDR width was calculated using the ground state deformation (
β
=
0.
134) [41] and spreading width parameterizationΓ
s=
0.
05E1GDR.6 [42]for each Lorentzian. The ground state value was estimated to be 5.5 MeV which is consistent with the experimentally measured value in this mass region [43]. The behavior of the GDR width within the CTFM was calculated as a function ofT for J=
10 and 20h¯
select-ing the extreme angular momenta involvselect-ing the experimental data. TheΓ
ev was not included in the CTFM calculations as the model was put forward by fitting the experimental data. Interestingly, the CTFM represents the data remarkably well over the entire Tregion. This excellent match between the experimental data and the CTFM clearly suggests that the experimental GDR widths are not suppressed, rather TSFM over predicts the GDR width at low temperatures as it does not take into account the intrinsic GDR fluctuations induced by the GDR vibrations. Moreover, the system-atic trend of the data also shows that the critical temperature for the increase of GDR width is between 1 and 1.2 MeV as predicted by the CTFM (Tc
=
0.
7+
37.
5/
A).The data were also compared with the results of microscopic PDM calculations [11–13]. Within the PDM, the GDR damping mechanism is caused by coupling of the GDR to noncollective particle–hole (ph) and particle–particle (pp) [hole–hole (hh)] con-figurations. The coupling to the various ph configurations leads to the quantal width (exists even at T
=
0), whereas the ther-mal width arises owing to the coupling to pp and hh configu-rations, which appear at T>
0 because of the distortion of the Fermi surface. The model emphasizes the inclusion of thermal pair-ing, since, in finite systems such as atomic nuclei, thermal pairing does not collapse at the critical temperature Tcp=
0.
57(
T=
0)
of the superfluid–normal phase transition in infinite systems, but decreases monotonically as T increases. The prediction of the PDM is shown in Fig. 5b. The calculations were performed atJ
=
0 by using the single-particle energies obtained within the de-formed Woods-Saxon potentials with the deformation parameterof T. The average deformation (
β
) for this case was also ex-tracted using the universal correlation between the experimental GDR width and the average deformation of the nucleus at finiteT, and was compared with the TSFM. The correlation has been pro-posed recently by including the deformation induced by the GDR motion[27]. As can be observed fromFig. 5c, the empirical defor-mations extracted from the experimental data match excellently well with the TSFM calculation above Tc. The good description of the CTFM as well as the validity of the universal correlation indi-cate that GDR induced deformations could play a decisive role in suppressing the GDR width at lowT.In summary, a systematic study of the GDR width as a func-tion of T has been presented in the unexplored region (T
=
0
.
8–1.
5 MeV) for97Tc. In order to determine the temperature pre-cisely, the level density parameter has been extracted from the neutron evaporation spectrum and the angular momentum from gamma multiplicity filter using a realistic approach. The systematic trend of the data shows that GDR width remains nearly constant at the ground state value up to T∼
1 MeV and increases thereafter. The microscopic PDM and phenomenological CTFM describe the data reasonably well, whereas the adiabatic TSFM differs substan-tially even after inclusion of shell effect. These interesting results indicate that the effect of GDR induced deformation could be one of the ways in explaining macroscopically the behavior of GDR width at lowT. However, this effect is not explicitly needed in mi-croscopic PDM, rather thermal pairing should be included to have adequate description of the damping of GDR width in open shell nuclei at lowT.Acknowledgements
The authors are thankful to VECC Cyclotron operators for a smooth running of the accelerator during the experiment. N. Quang Hung acknowledges the support by the National Foun-dation for Science and Technology Development (NAFOSTED) of Vietnam through Grant No. 103.04-2013.08.
References
[1]M.N. Harakeh, A. van der Woude, Giant Resonances, Fundamental High-frequency Modes of Nuclear Excitation, Clarendon Press, Oxford, 2001.
[2]J.J. Gaardhoje, Annu. Rev. Nucl. Part. Sci. 42 (1992) 483. [3]D. Kusnezov, et al., Phys. Rev. Lett. 81 (1998) 542. [4]Z.M. Drebi, et al., Phys. Rev. C 52 (1995) 578. [5]A. Bracco, et al., Phys. Rev. Lett. 74 (1995) 3748. [6]F. Camera, et al., Phys. Rev. C 60 (1999) 014306. [7]M. Mattiuzzi, et al., Phys. Lett. B 364 (1995) 13. [8]Srijit Bhattacharya, et al., Phys. Rev. C 77 (2008) 024318.
[9]D.R. Chakrabarty, et al., J. Phys. G, Nucl. Part. Phys. 37 (2010) 055105. [10]I. Mukul, et al., Phys. Rev. C 88 (2013) 024312.
[11]N. Dinh Dang, A. Arima, Phys. Rev. Lett. 80 (1998) 4145; N. Dinh Dang, A. Arima, Nucl. Phys. A 636 (1998) 427. [12]N. Dinh Dang, Phys. Rev. C 85 (2012) 2023.
[13]N. Dinh Dang, N. Quang Hung, Phys. Rev. C 86 (2012) 044333. [14]M. Gallardo, et al., Phys. Lett. B 191 (1987) 222.
[15]J.M. Pacheco, et al., Phys. Rev. Lett. 61 (1988) 294. [16]A.L. Goodman, Nucl. Phys. A 528 (1991) 348. [17]N. Dubray, et al., Acta Phys. Pol. B 36 (2005) 1161. [18]Y. Alhassid, et al., Phys. Rev. Lett. 61 (1988) 1926. [19]W.E. Ormand, et al., Phys. Rev. Lett. 77 (1996) 607. [20]A. Maj, et al., Nucl. Phys. A 731 (2004) 319.
[21]Deepak Pandit, et al., Phys. Rev. C 81 (2010) 061302(R). [22]P. Heckman, et al., Phys. Lett. B 555 (2003) 43. [23]F. Camera, et al., Phys. Lett. B 560 (2003) 155. [24]Deepak Pandit, et al., Phys. Lett. B 690 (2010) 473. [25]S. Mukhopadhayay, et al., Phys. Lett. B 709 (2012) 9. [26]Deepak Pandit, et al., Phys. Lett. B 713 (2012) 434. [27]Deepak Pandit, et al., Phys. Rev. C 87 (2013) 044325. [28]Deepak Pandit, et al., Phys. Rev. C 88 (2013) 054327.
[29]S. Mukhopadhayay, et al., Nucl. Instrum. Methods Phys. Res., Sect. A, Accel. Spectrom. Detect. Assoc. Equip. 582 (2007) 603.
[30]Deepak Pandit, et al., Nucl. Instrum. Methods Phys. Res. 624 (2010) 148. [31]S. Agostinelli, et al., Nucl. Instrum. Methods Phys. Res. 506 (2003) 250. [32]Pratap Roy, et al., Phys. Rev. C 86 (2012) 044622.
[33]K. Banerjee, et al., Nucl. Instrum. Methods Phys. Res. 608 (2009) 440. [34]F. Puhlhofer, Nucl. Phys. 280 (1977) 267.
[35]H. Nifennecker, J.A. Pinston, Annu. Rev. Nucl. Part. Sci. 40 (1990) 113. [36]A.V. Ignatyuk, G.N. Smirenkin, A.S. Tishin, Sov. J. Nucl. Phys. 21 (1975) 255, Yad.
Fiz. 21 (1975) 485.
[37]O. Wieland, et al., Phys. Rev. Lett. 97 (2006) 012501. [38]Srijit Bhattacharya, et al., Phys. Rev. C 78 (2008) 064601. [39]V.M. Strutinsky, Nucl. Phys. A 95 (1967) 420;
V.M. Strutinsky, Nucl. Phys. A 122 (1968) 1.