Vol. 2, No. 1; February 2015 ISSN 2332-7294 E-ISSN 2332-7308 Published by Redfame Publishing URL: http://aef.redfame.com
Children’s Food Security and Participation in the
National School Lunch Program
Ariun Ishdorj1 & Lindsey Higgins2
1Department of Agricultural Economics, Texas A&M University, College Station, TX, USA 2Department of Agribusiness, California Polytechnic State University, San Luis Obispo, CA, USA
Correspondence: Ariun Ishdorj, Department of Agricultural Economics, TAMU- 2124, Texas A&M University, College Station, TX, USA
Received: December 19, 2014 Accepted: January 23, 2015 Available online: January 27, 2015.
doi:10.11114/aef.v2i1.655 URL: http://dx.doi.org/10.11114/aef.v2i1.655
Abstract
In 2013 nearly 8.6 million U.S. children lived in households in which one or more child was food insecure. The National School Lunch Program (NSLP) is one of the largest federally funded food and nutrition assistance programs that aims to provide nutritious, well-balanced lunches for school-age children. Given the important role this program plays on food and nutrient intake of school-age children, we examined the relationship between participation in NSLP and children’s food security status. After controlling for the endogeneity of program participation we found that program participation have positive effect on food insecure and marginally food secure children, but the effect was not significant. Having enough time to eat school meals played an important role on students’ decision to participate in NSLP. We also found that marginal food security group shared more characteristics with the food insecure group rather than with the high food secure group.
Keywords: Food security, Instrumental Variable, National School Lunch Program, Nutrition, Probit
JEL Classification:H51, I18
1. Introduction
Food insecurity, defined as having limited or uncertain availability of nutritionally adequate and safe foods, is a concern for more than 17.5 million U.S. households (Coleman-Jensen, Gregory & Singh, 2013). Food security is particularly important for children. Children who are food insecure are more likely to suffer behavioral, academic, psychological, and physical problems (Haering & Syed, 2009; Whitaker, Phillips, & Orzol, 2006; Alaimo, Olsen, & Frongillo, 2001; Casey et al., 2005). The U.S. government has responded to the need for food security by providing assistance through its 15 food and nutrition assistance programs with total spending of $108.9 billion in fiscal 2013 (Oliveira, 2014). Yet, despite these food and nutrition assistance programs, in 2013 nearly 8.6 million children lived in households in which one or more child was food insecure (Coleman-Jensen, Gregory, & Singh, 2013).
Using a series of 18 questions in the current population survey, the Core Food Security Module (CFSM) measures the food security of households (Bickel, Nord, Price, Hamilton, & Cook, 2000). Prior to 2006, very low food security was called “food insecure with hunger”. In 2006, the U.S. Department of Agriculture (USDA) introduced new labels to describe food security status, including high food security, marginal food security, low food security, and very low food security. High and marginal levels are defined as food secure, while low and very low levels are defined as food insecure.
The National School Lunch Program (NSLP) is the second largest federally assisted meal program, with the spending of more than $11 billion in 2013. As a means to helping ensure that children have access to healthy diets by providing nutritious and well-balanced lunches, the NSLP has served over 100,000 schools and childcare institutions, and over 31 million meals each school day some of which were offered for free or at reduced price1. Considering children spend the
1
majority of their weekdays at school during the school year and, on average, consume more than one-third of their calories while at school, school is a natural place to implement policy aimed at improving children’s eating habits and health outcomes (Bhatt, 2009; Briefel, Wilson, & Gleason, 2009).
In recent years, a large body of literature surrounding food security relative to other food assistance programs has developed (Bartfeld, Kim, Ryu, & Ahn, 2009; Wilde, 2007). Yet, despite the breadth of these studies, the relationship between food assistance programs and food security is still uncertain; studies have shown positive, negative and no significant relationship between food security and food assistance programs. Joint models using a system of simultaneous equations have been used, employing instrumental variables or assumptions about the distribution of error terms to analyze the effect of food assistance program on food security status (Mykerezi & Mills, 2010; Bartfeld et al., 2009; Yen, Andrews, Chen, & Eastwood, 2008; Huffman & Jensen, 2003; Jensen, 2002). Others have used longitudinal or panel data (Wilde & Nord, 2005; Kabbani & Kemid, 2005; Herman, Harrison, Afifi, & Jenks, 2004; Hofferth, 2004; Ribar & Hamrick, 2003). Bartfeld and Dunifon (2006) used hierarchical models to show that near-poor households in states with higher food stamp participation rates have a lower risk of food insecurity.
Relatively few studies looked at the association between food security and school meal program participation. Bartfeld et al. (2009) used a two–stage model with instrumental variables to address the effect of School Breakfast Program (SBP) on food insecurity, and found that the accessibility of the SBP has no significant effect on food insecurity, but does have an impact on the probability of being marginally food secure. Using a hierarchical model at the state level, Bartfeld and Dunifon (2006) showed that accessibility of both the Summer School Lunch Program and Summer Food Service Program (a program that serves school-aged children during the summer) reduced the risk of food insecurity. Similarly, using a state-level analysis, Nord and Romig (2006) found that the availability of the Summer Food Service Program and NSLP in summer reduced seasonal differences of food insecurity. Using a dose-response approach with longitudinal data, Kabbani and Kemid (2005) found that participation in the NSLP was associated with lower odds of food insecurity for households with school-age children.
Some studies looked at health outcomes or dietary intake as a result of participation in school-based food programs. Gundersen et al. (2012) used monotone instrumental variables approach and found evidence that receiving a free or reduced-price school lunch improves a child’s health outcomes. They used data from households with children who appear eligible to receive free or reduced-price lunches through NSLP. Based on descriptive analysis, Potamites and Gordon (2010) analyzed children from different food security groups’ and looked at their food and nutrient intakes from school meals. They found that children who live in marginally secure and food-insecure households consumed more food and nutrients at school than those from highly secure households. Dunifon and Kowaleski-Jones (2003) analyzed the effects of NSLP participation and food insecurity on children’s well-being based on sibling comparison analyses. The majority of the research noted above have classified households and/or individuals as being either food secure or food insecure rather than using the relative degrees of food security (high, marginal, low, and very low food security). Recent research (Potamites & Gordon, 2010; Bartfeld et al., 2009) pointed out that different food security groups have their own characteristics. This paper contributes to the existing literature on food security and food assistance programs. Specifically, we evaluate the effect of participation in the NSLP on varying degrees of food security using the data from the third School Nutrition Dietary Assessment study (SNDA-III) of nationally representative sample of schools and children attending those schools.
2. The Model
In order to assess the effect of the NSLP on children’s food security status, an ordered probit model is employed: 𝐹𝑆𝑖∗= β1Xi + β2Pi+ εi (1) where FSi is an ordered categorical variable of food security status of student i:
FSi= {
FSi∗ FSi∗ FSi∗=
(2)
Here FSi=1 if student i is classified as having food insecurity, FSi=2 if marginal food security, and FSi=3 if high food security, Pi is NSLP participation dummy, which equals to one if student i participated in school lunch program on the day of the survey and zero otherwise, Xi is a vector of explanatory variables and εi is the error term.
2.1Endogeneity of National School Lunch Program Participation
Although all school children are eligible to participate in NSLP, there could be differences between the students who decide to participate in NSLP and those who do not. Children from households that are food insecure are more likely to participate in NSLP, hence, the unobservable factors that affect children’s NSLP participation may also affect food security status of those children and lead to endogeneity of program participation. A two-stage method using an instrumental variable (IV) was used to handle the endogeneity of program participation. Students’ NSLP participation decision can be stated as:
𝑃𝑖∗= α1Xi + α2Zi+ μi (3)
𝑃𝑖= { 𝑃𝑖
∗
𝑃𝑖∗ (4) where 𝑃𝑖∗ is the latent variable of NSLP participation and Pi is a binary indicator variable the observed NSLP participation, and Zi is an instrumental variable indicating that a student had enough time to have his or her school lunch (Zi=1), and otherwise (Zi=0). In the first stage, a probit model for the NSLP participation was estimated. The instrumental variable (Zi) was associated with NSLP participation but not associated with food security. In the second stage, the effect of participation and other explanatory variables on food security was estimated.
Two-stage predictor substitution (2SPS) and two-stage residual inclusion (2SRI) are common estimator methods. Terza, Basu, and Rathouz (2007) suggest that 2SRI gives consistent results for nonlinear models, while 2SPS does not. Therefore, 2SRI was used in the estimation of the ordered probit model with endogenous program participation.
The estimates of vector Xi (Xî) and Zi (Zî) were obtained in the first stage. Then the “predictor” P̂ was computed and used in the calculation of the “residual” given by the following equation.
v = P − P̂ (5) In the second stage estimated of food security status, and the actual observed value of Pi were used and the calculated “residual” was added as one of the explanatory variables:
FSi∗= β1Xi + β2P
i+ εi + v (6) 3. Data
Data from the third School Nutrition Dietary Assessment study (SNDA-III) sponsored by the Food and Nutrition Service (FNS) of USDA was used in this research. Mathematica Policy Research, Inc. collected the data from a nationally representative sample of schools during the 2004-2005 school year, aiming to provide information on school meal programs. There were 287 schools (in 94 districts) and 2,314 students who completed an interview giving their opinion of school lunch and a 24-hour dietary recall. In addition, parents of the surveyed students completed an interview on household characteristics, including education, employment, food security, and socioeconomic conditions (Gordon et al., 2007). The final sample consisted of 2012 observations. Descriptive statistics of explanatory variables are provided in Table 1.
Table 1. Definition, Means and Standard Deviation of Variables
Variables Description Mean Std Dev
Household size Number of people living in household 4.47 1.81
Hispanic =1 if Hispanic, any race 0.23 0.42
White =1 if White, Non-Hispanic 0.53 0.50
Black =1 if Black, Non-Hispanic 0.18 0.38
Other Race =1 if Other Race, Non-Hispanic 0.06 0.24
City School serves city 0.35 0.48
Urban fringe of city School serves urban fringe of city 0.33 0.47
Rural and Town School serves rural and town 0.32 0.47
Mid-Atlantic =1 if Mid-Atlantic 0.10 0.30
Midwest =1 if Midwest 0.17 0.37
Mountain-Plains =1 if Mountain 0.08 0.27
Northeast =1 if Northeast 0.09 0.29
Southeast =1 if Southeast 0.21 0.41
Southwest =1 if Southwest 0.18 0.39
Western =1 if Western 0.16 0.37
Less than high school =1 if p_high_ed = 1 0.12 0.32
Some college or postsecondary =1 if p_high_ed = 3 0.34 0.48
College graduate =1 if p_high_ed = 4 0.30 0.46
Participation Child Participation Status - NSLP 0.61 0.49
Elementary school =1 if school_type = 1 0.33 0.47
Middle school =1 if school_type = 2 0.34 0.47
High school =1 if school_type = 3 0.33 0.47
Food Security - Household Scale Food Security - Household Scale 2.51 0.80 2 parents, both employed FT =1 if 2 parents, both employed FT 0.32 0.47 2 parents, one employed FT =1 if 2 parents, one employed FT 0.36 0.48 Neither parent employed FT =1 if Neither parent employed FT 0.15 0.36
1 parent, employed FT =1 if 1 parent, employed FT 0.16 0.37
Time =1 if enough time to eat 0.86 0.35
3.1 Food Security
The series of 18 household food security questions from the CFSM were available in SNDA-III and were used to determine the food security classification of each student. Low food security and very low security were combined into a single food insecure group, as there were very few observations in the very low food security groups, accounting for only 6.41% of observations. Households were labeled as food insecure if the parent answered yes to anywhere from 3 to all 18 questions, marginally food secure if the parent answered yes to one or two questions, and highly food secure if the parent answered no to all 18 questions. In our final sample, 19% of students were food insecure, 10% of students were marginally food secure, and 71% were highly food secure.
3.2 NSLP Participation
All students attending school could purchase a school meal through the lunch program, but the price they pay is different depending on household income. The SNDA-III sample showed that 62% of students participated in the NSLP on the survey day in 2005, referred to as “target day participation”, while approximately 75% of students participated in the NSLP three or more days per week and is referred to as “usual participation” (Gordon et al., 2007). This study used target day participation as the indicator of participation and was coded as 1 for participation on the target day and 0 otherwise.
Among NSLP participants, 54% received a free/reduced price meal and 23% of students who also participated in SBP on the survey day (Table 2). Eligibility for free and reduced priced meals is believed to influence both NSLP participation and food security status.
Table 2. Data Summary
Numbers Percent
Total sample 2012
National School Lunch Program
Participants 1228 61% Free/reduced 668 54% No free/reduced 560 46% SBP 277 23% No SBP 951 77% Nonparticipants 784 39%
School Breakfast Program
Participants 319 16% Free/reduced 243 76% No free/reduced 76 24% NSLP 277 87% No NSLP 42 13% Nonparticipants 1693 84%
Free/reduced price
Receive 862 43%
NSLP 668 54% No NSLP 194 46% SBP 243 28% No SBP 619 72% Not Receive 1150 57%
The length of school lunch meal period is associated with NSLP participation. Law, Lewis, Grant, and Bachemin (1972) found that waiting in line and insufficient time were major reasons for teenagers not eating school lunch. Ishdorj, Crepinsek, and Jensen (2013) found that students who thought that lunch lines were generally long were less likely to participate in NSLP. Harper, Mackin, Sjogren, and Jansen (1980) found that frequency of participation was correlated with time available for lunch. The SNDA-III data showed that 4% of students did not participate in NSLP because there was not adequate time and 71% of students said they spent too much time waiting in line. Also, parents might determine their child’s participation based on concerns about the time available for the student to eat (Gordon et al., 2007), for the reason that short lunch length has a potential negative effect on children’s health (Bhatt, 2009). The National Association of State Boards of Education (NASBE) recommends that students should be provided adequate time to eat lunch (SNA, 2005). If time is too tight, children may worry about missing classes and with the anxiety of limited time, students could accelerate the speed of eating, which will deteriorate eating experiences. Unsatisfied eating experiences could result in a lower NSLP participation in the future as students seek other lunch options.
Although time is believed to be an important variable for student’s decision on NSLP participation, there is no supporting evidence suggesting time is related with food security. However, it was still necessary to be cautious about latent variables, causing correlation between eating time and children’s food security. Possible factors that could determine whether students have enough time to eat lunch were explored. Conklin, Lambert, and Anderson (2002) indicated that lunch periods consisted of time for travelling from classrooms to cafeterias, time for service, time for organizing and cleaning up, time for socialization, and time for actual eating. Obviously, actual eating time could be substantially cut if students spent too much time elsewhere. But, the way a lunch period is allocated does not directly influence food security. Therefore given the definition of food security, time has no direct effect on food security and is considered a reasonable instrumental variable.
In the model, the instrumental variable, TIME, describes whether a student has enough time to have their school lunch and is included in the participation equation.
4. Results
4.1 National School Lunch Program Participation
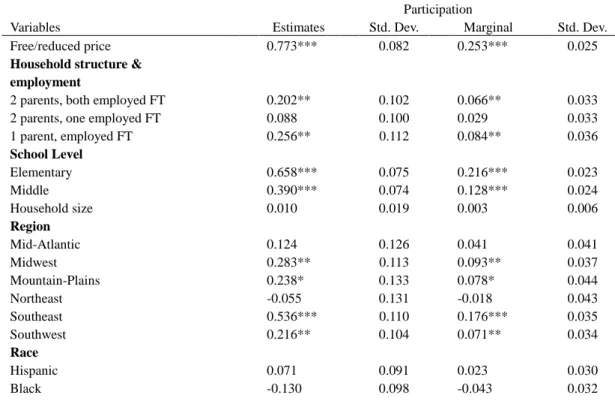
Table 3 provides the coefficients, p-values, and marginal effects of the first stage estimation (program participation). Consistent with expectations, the instrumental variable TIME is statistically significant. TIME shows a positive impact on NSLP participation, indicating that students who had enough time to eat school lunches were 11.9% more likely to participate in NSLP than those who did not have not enough time. In addition, free/reduced prices, household structure and employment, school level, school location, and household highest education had positive effects on the probability of NSLP participation.
Table 3. Coefficients and Marginal Effects of NSLP Participation Equation
Participation
Variables Estimates Std. Dev. Marginal Std. Dev.
Free/reduced price 0.773*** 0.082 0.253*** 0.025
Household structure & employment
2 parents, both employed FT 0.202** 0.102 0.066** 0.033
2 parents, one employed FT 0.088 0.100 0.029 0.033
1 parent, employed FT 0.256** 0.112 0.084** 0.036
School Level
Elementary 0.658*** 0.075 0.216*** 0.023
Middle 0.390*** 0.074 0.128*** 0.024
Household size 0.010 0.019 0.003 0.006
Region
Mid-Atlantic 0.124 0.126 0.041 0.041
Midwest 0.283** 0.113 0.093** 0.037
Mountain-Plains 0.238* 0.133 0.078* 0.044
Northeast -0.055 0.131 -0.018 0.043
Southeast 0.536*** 0.110 0.176*** 0.035
Southwest 0.216** 0.104 0.071** 0.034
Race
Hispanic 0.071 0.091 0.023 0.030
Other race 0.021 0.134 0.007 0.044
Urban vs. Rural Status
City -0.019 0.076 -0.006 0.025
Rural and Town 0.311*** 0.080 0.102*** 0.026
Highest education in household
Less than high school 0.165 0.123 0.054 0.040
High school or GED 0.297*** 0.090 0.097*** 0.029
Some college or postsecondary 0.201*** 0.076 0.066*** 0.025
Instrumental variable
Time 0.363*** 0.086 0.119*** 0.028
Note: Asterisks indicate levels of significance: *= 10%, **= 5%, ***= 1%.
As expected, eligibility for free or reduced price meals appears to attract students to participate in NSLP. Those eligible for a free or reduced price meal were 25.3% more likely to participate. In the sample, 56.38% of students who received a free/reduced price meal on the survey day were food insecure or marginally food secure, compared with 29% in the whole sample. Price differentiation by group worked well to attract more students who had a greater need.
Younger students (those in elementary and middle school) were more likely to participate in NSLP, as were students attending schools located in the Midwest, Mountain-plains, Southeast, and Southwest areas. Participation was more common for schools in rural areas compared with those schools in urban areas. Participation differences were not apparent between races. NSLP participants were more likely to have two parents employed full time and more likely to have just one parent in the household and that parent is employed (relative to the base scenario of no full time employment by parents). NSLP participation of students with employed parents likely reflects the time constraints faced by parents working outside the home.
Highest obtained education levels by the household also present some interesting results. Relative to the base scenario where a college degree is held by at least one member of the household, students whose parents had only high school degree were 9.7% more likely to participate in NSLP, while students whose parent had some college or postsecondary education were 6.6% more likely to participate in NSLP. The results confirmed expectations that a relatively higher education level among parents is associated with higher incomes and, thus, these households can afford to make alternative choices for their child’s lunch.
4.2 Food Security Status
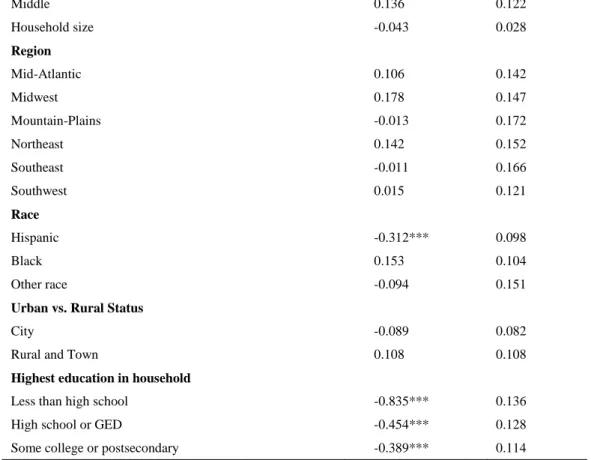
The second stage of this model estimated the effect of NSLP participation on food security status using an ordered probit model. Table 4 provides estimation results from the ordered probit, while Table 5 provides marginal effects for all relative food security levels.
The estimated coefficients themselves provide limited information, while marginal effects are good approximations. The signs of the marginal effects for the marginal, and low food security groups are the same as the corresponding coefficients. However, the signs of marginal effects for the high food security group are opposite compared to the other groups. Free/reduced price meal eligibility, household structure and employment, school level, region, race, and household education level all had significant effects on food security status, while there was no significant association between NSLP participation and food security levels.
Table 4. Coefficients of Ordered Probit Estimation of Food Security
Food security status
Variables Estimates Std. Dev.
NSLP Participation -0.361 0.686
Residual 0.198 0.689
Receive free/reduced price meal -1.071*** 0.196
Household structure &
employment
2 parents, both employed FT 0.522*** 0.116
2 parents, one employed FT 0.331*** 0.103
1 parent, employed FT -0.065 0.119
School Level
Middle 0.136 0.122
Household size -0.043 0.028
Region
Mid-Atlantic 0.106 0.142
Midwest 0.178 0.147
Mountain-Plains -0.013 0.172
Northeast 0.142 0.152
Southeast -0.011 0.166
Southwest 0.015 0.121
Race
Hispanic -0.312*** 0.098
Black 0.153 0.104
Other race -0.094 0.151
Urban vs. Rural Status
City -0.089 0.082
Rural and Town 0.108 0.108
Highest education in household
Less than high school -0.835*** 0.136
High school or GED -0.454*** 0.128
Some college or postsecondary -0.389*** 0.114
Note: Asterisks indicate levels of significance: *= 10%, **= 5%, ***= 1%.
Table 5. Marginal Effects of Ordered Probit Estimation of Household Food Security Status
Food Insecurity Marginal Food Security High Food Security
Variables Marginal Std. Dev. Marginal Std. Dev. Marginal Std. Dev.
Participation of NSLP 0.070 0.132 0.016 0.030 -0.086 0.163
Residual -0.038 0.133 -0.009 0.031 0.047 0.164
Free/reduced price meals 0.207*** 0.038 0.047*** 0.009 -0.254*** 0.046
2 parents, both employed FT -0.101*** 0.022 -0.023*** 0.005 0.124*** 0.027 2 parents, one employed FT -0.064*** 0.020 -0.015*** 0.005 0.079*** 0.024
1 parent, employed FT 0.013 0.023 0.003 0.005 -0.016 0.028
Elementary -0.110*** 0.033 -0.025*** 0.008 0.135*** 0.040
Middle -0.026 0.024 -0.006 0.005 0.032 0.029
Household size 0.008 0.005 0.002 0.001 -0.010 0.007
Mid-Atlantic -0.020 0.027 -0.005 0.006 0.025 0.034
Midwest -0.034 0.028 -0.008 0.007 0.042 0.035
Mountain-Plains 0.002 0.033 0.001 0.008 -0.003 0.041
Northeast -0.027 0.029 -0.006 0.007 0.034 0.036
Southeast 0.002 0.032 0.000 0.007 -0.003 0.039
Southwest -0.003 0.023 -0.001 0.005 0.003 0.029
Hispanic 0.060*** 0.019 0.014*** 0.004 -0.074*** 0.023
Other race -0.030 0.020 -0.007 0.005 0.036 0.025
Black 0.018 0.029 0.004 0.007 -0.022 0.036
City 0.017 0.016 0.004 0.004 -0.021 0.020
Rural area and Town -0.021 0.021 -0.005 0.005 0.026 0.026
Less than high school 0.161*** 0.026 0.037*** 0.007 -0.198*** 0.032 High school or GED 0.088*** 0.025 0.020*** 0.006 -0.108*** 0.030 Some college or postsecondary 0.075*** 0.022 0.017*** 0.005 -0.092*** 0.027 Note: Asterisks indicate levels of significance: *= 10%, **= 5%, ***= 1%.
food insecurity, evidenced in the model as students eligible for free or reduced price lunches showed a decreased likelihood of being food secure. Compared to households with neither parent employed, students with two employed parents were less likely to be food insecure, as higher total income is likely associated with a more stable food supply. Children living in a two parent household with one parent employed full time were only 6% less likely to be food insecure compared to 10% less for a two employed parents’ household. Likewise, parent’s education level was positively associated with food security.
Compared with high school students, elementary aged children were less likely to be food insecure. A theory to explain the inverse relationship between food security and child’s age is that young children require less food compared to older children and are more likely to be protected by adult members of the household. Parents may also be shielding young children in food shortage situations. Compared to white students, this model predicts Hispanic students as being more likely to be food insecure, which is consistent with prior findings (Coleman-Jensen, Nord, & Singh, 2013).
Given that the USDA defines high food security and marginal food security as both being food secure, it was expected that the marginally food secure group would have similar results to the highly food secure group. However, in this study, the signs on the marginal effects for the marginally food secure group were the same as the food insecure group rather than the high food security group. The magnitude of each variable in the marginally food security group was less than those for the food insecurity group, suggesting that students who were marginally food secure shared characteristics with those who were food insecure but with less severity.
4.3 Confirmation and Validation of Results
The most significant finding of this research is also the most surprising; after accounting for the endogeneity of program participation, no statistically significant association between individual NSLP participation and food security was found. To check the plausibility of this result, a number of different checks were run. To check the validity of the instrument, the instrumental variable from the first stage estimation was removed, but included in the second stage. In doing so, TIME was shown to have no significant effect on food security level, confirming its use as an instrumental variable.
In addition to running the model on the whole sample of students, a model was estimated using only students from households with incomes less than 185% of poverty line. In this subgroup, all students were eligible for either free lunch or reduced price lunch. However, the results were consistent and no significant association between NSLP and food security for students living in these low-income households was found.
Since most previous literature constructed a binary variable for food security, a bivariate probit model was also employed as an alternative specification. Compared with three food security levels, the bivariate categories of food security and food insecurity were used instead. Food security combined the high food security and the marginal food security groups, while food insecurity remained same. Again, the results of the bivariate probit model indicated that NSLP participation had no significant effect on food security.
The data set being used included a 24-hour dietary recall, which was used to complete a dietary intake analysis. From the analysis, it appears that NSLP participants did not intake more food energy from lunch than nonparticipants. This finding is consistent with earlier studies on NSLP food intake comparisons (Gordon et al., 2007; Gleason & Suitor, 2003). Therefore, a possible reason that NSLP had no significant effect on food security is that participants did not have a significantly higher caloric intake as a result of NSLP.
5. Discussion and Conclusion
This research adds to the existing body of literature by estimating the effect of NSLP on children’s food security status by accounting for the endogeneity of program participation. Through the use of a two-stage instrumental variables approach, an ordered probit model was estimated and provided some interesting results.
In the first stage, having enough time to eat school lunch was shown to have a positive and significant effect on program participation. More specifically, students who had enough time to eat lunch were 12% more likely to participate in NSLP. This suggests that increasing the number of lunch lines or having fewer classes per lunch period may lead to increased program participation. Other factors that influence participation in NSLP are receiving free/reduced priced meals, being younger, being in a rural area, having relatively low educated parents, and having parents that are full-time employed.
In the second stage, three food security levels were estimated through the ordered probit model. Receipt of free or reduced priced meals, household structure, parents’ employment status, school level, race, and parents’ education level all had significant effects on each food security group. The signs of those significant factors were the same for the food insecure and marginally secure group. Although the USDA defines marginal food security as belonging to a “food secure” classification, these results indicated that the marginally secure group shared more characteristics with the food insecure group rather than with the high food secure group.
SNDA-III is cross-sectional data and the use of longitudinal data might be preferred to fully capture the long-term effect of the program. Besides NSLP, students could also receive public support from other food assistance programs. For instance, Food SNAP is the largest federal assistance program and WIC is the third largest program, which potentially have effects on food security. Because the survey was designed for evaluating the NSLP, it had many missing observations regarding receipt of other food assistance program benefits to include in the analysis, but in the future it would be of interest to use data that allows for controlling for the benefits from other programs.
Nevertheless, the finding that NSLP participation had an insignificant impact on food security is a potentially powerful finding. While this research will certainly not be the final verdict on the effectiveness of the program, it does merit the further exploration of the role of NSLP and its progress toward helping alleviate food security challenges among the nation’s children.
Key findings of this research are the importance of giving enough time to eat school lunches, the positive effect of receiving free / reduced-price meals on program participation, and that those in the marginally food secure group have more similarities to those in food insecure group rather than to those in high food secure group. In the future, policymakers could encourage local districts to (1) provide more lunch lines, (2) training more skilled employees for dining service, and (3) having fewer classes in the same lunch period. By increasing eating time and continuing to employ reduced price meal options, more students would likely participate in the NSLP.
References
Alaimo, K., Olsen, C., & Frongillo, E. (2001). Food insufficiency and American school-aged children’s cognitive, academic, and psychosocial development, Pediatrics, 108, 44-53.
Bartfeld, J., & Dunifon, R. (2006). State-level predictors of food insecurity among households with children. Journal of Policy Analysis and Management, 25, 921-42. http://dx.doi.org/10.1002/pam.20214
Bartfeld, J., Kim, M., Ryu, J. H., & Ahn, H. (2009). The School Breakfast Program Participation and Impacts. Washington DC, U.S. Department of Agriculture, Economic Research Service, Food Assistance and Nutrition Research Report (FANRR), 54. http://dx.doi.org/10.1016/j.jada.2008.10.064
Bhatt, R. R. (2009). The Impact of School Lunch Length on Children’s Health. Working paper, Andrew Young School of Policy Studies Research Paper Series, Georgia State University.
Bickel, G., Nord, M. Price, C., Hamilton, W., & Cook, J. (2000). Guide to Measuring Household Food Security, revised. Alexandria, VA, U.S. Department of Agriculture, Food and Nutrition Service, Technical Report, March.
Briefel, R. R., Wilson, A., & Gleason, P. M. (2009). Consumption of Low-Nutrient, Energy-Dense Foods and Beverages at School, Home, and Other Locations among School Lunch Participants and Nonparticipants. Journal of the American Dietetic Association, 109, 79-90.
Casey, P. H., Szeto, K. L., Robbins, J. M., Stuff, J. E., Connell, C., Gossett, J., & Simpson, P. M. (2005). Child health-related quality of life and household food security. Archives of Pediatrics and Adolescent Medicine, 159, 51-56. http://dx.doi.org/10.1001/archpedi.159.1.51
Coleman-Jensen, A., Gregory, C., & Singh, A. (2014). Household Food Security in the United States in 2013. ERR-173, U.S. Department of Agriculture, Economic Research Service, September.
Coleman-Jensen, A., Nord, M. & Singh, A. (2013). Household Food Security in the United States in 2012. ERR-155, U.S. Department of Agriculture, Economic Research Service, September.
Conklin, M., Lambert, L., & Anderson, J. (2002). How Long Does it Take Students to Eat Lunch? A Summary of Three Studies. Journal of Child Nutrition & Management, 1, 1-6.
Dunifon, R., & Kowaleski-Jones, L. (2003). The influences of participation in the national school lunch program and food insecurity on child Well-Being. Social Service Review,77(1), 72-92. http://dx.doi.org/10.1086/345705
Gleason, P. M., & Suitor, C. W. (2003). Eating at School, How the National School Lunch Program Affects Children’s Diets. American Journal of Agricultural Economics,85(4), 1047-1061. http://dx.doi.org/10.1111/1467-8276.00507
Gordon A. R., M. Fox, Clark, M. Nogales, R. Condon, E. Gleason,P. M. & Sarin, A. (2008). School Nutrition Dietary Assessment Study–III, Volume II, Student Participation and Dietary Intakes. Alexandria, VA, US Dept of Agriculture, Food and Nutrition Service, Office of Research, Nutrition, and Analysis; 2007. Report no. CN-07-SNDA-III.
Gundersen, C., Kreider, B., & Pepper, J. (2012). The Impact of the National School Lunch Program on Child Health: A Nonparametric Bounds Analysis. Journal of Econometrics, 166(1), 79-91.
http://dx.doi.org/10.1016/j.jeconom.2011.06.007
Harper, J. M., Mackin, S. D., Sjogren, D. O., & Jansen, G. R. (1980). Alternate lunch patterns in high school. II. Students and foodservice staff reactions. Journal of the American Dietetic Association, 77, 282-288.
Herman, D. R., Harrison, G. G., Afifi, A. A., & Jenks, E. (2004). The effect of the WIC program on food security status of pregnant, first-time participants. Family Economics & Nutrition Review,16(1), 21-9
Huffman, S., & Jensen, H. H. (2003, July). Do food assistance programs improve household food security? Recent evidence from the United States. Paper prepared for presentation at the American Agricultural Economics Association Annual Meeting, Montreal, Canada.
Hofferth, S. L. (2004). Persistence and change in the food security of families with children,Washington, DC, U.S. Department of Agriculture/Economic Research Service.
Ishdorj, A., Crepinsek, M. K., & Jensen, H. H. (2013). Children’s Consumption of Fruits and Vegetables, Do School Environment and Policies Affect Choices as School and Away from School? Applied Economic Perspectives and Policy, 35(2), 341-359. http://dx.doi.org/10.1093/aepp/ppt003
Jensen, H. H. (2002). Food insecurity and the Food Stamp Program. American Journal of Agricultural Economics, 84, 1215-28. http://dx.doi.org/10.1111/1467-8276.00382
Kabbani, N.S., and M.Y. Kmeid. (2005). The Role of Food Assistance in Helping Food Insecure Households Escape Hunger. Review of Agricultural Economics, 27, 439-45. http://dx.doi.org/10.1111/j.1467-9353.2005.00241.x
Law, H. W., Lewis, H. F., Grant, V. C., & Bachemin, D. S. (1972). Sophomore High School Students’ Attitudes toward School Lunch. Journal of the American Dietetic Association,60, 38-41.
Mykerezi, E., & Mills, B. (2010). The impact of food stamp program participation on household food insecurity. American Journal of Agricultural Economics, 92(5), 1379-1391. http://dx.doi.org/10.1093/ajae/aaq072
Nord, M., & Romig, K. (2006). Hunger in the summer: seasonal food insecurity and the National School Lunch and Summer Food Service programs. Journal of Children & Poverty, 12, 141-58.
Oliveira, V. (2014). Food Assistance Landscape: FY 2013 Annual Report. EIB-120 U.S. Department of Agriculture, Economic Research Service, February.
Potamites, E., & Gordon, A. (2010). Children’s Food Security and Intakes from School Meals. Washington, DC: U.S. Department of Agriculture/Economic Research Service, 61.
Ribar, D. C., & Hamrick, K. S. (2003). Dynamics of poverty and food sufficiency. Washington: USDA, Economic Research Service. Food Assistance and Nutrition Research Report, 36.
SNA. (2005). School Nutrition Association Local Wellness Policy Recommendations, 1-11. Internet site: http://www.schoolnutrition.org/uploadedFiles_old/SchoolNutrition.org/Child_Nutrition/Local_School_Wellness_Policies/S NALocalWellnessPolicyGuidelinesFinal.pdf
Terza, J. V., Basu, A., & Rathouz, P. J. (2008). Two-Stage Residual Inclusion Estimation: Addressing Endogeneity in Health Econometric Modeling. Journal of Health Economics,27(3), 531-43.
http://dx.doi.org/10.1016/j.jhealeco.2007.09.009
Whitaker, R. C., Phillips, S. M., & Orzol, S. M. (2006). Food insecurity and the risks of depression and anxiety in mothers and behavior problems in their preschool-aged children. Pediatrics, 118(3), 859–68. http://dx.doi.org/10.1542/peds.2006-0239 Wilde, P. E. (2007). Measuring the Effect of Food Stamps on Food Insecurity and Hunger: Research and Policy Considerations.
Journal of Nutrition, 137(2), 307-310.
Wilde, P. E., & Nord, M. (2005). The effect of food stamps on food security: a panel data approach. Review of Agricultural Economics, 27, 425-432. http://dx.doi.org/10.1111/j.1467-9353.2005.00239.x
Yen, S. T., Andrews, M., Chen, Z., & Eastwood, D. B. (2008). Food stamp program participation and food insecurity: An instrumental variables approach. American Journal of Agricultural Economics, 90(1), 117-132. http://dx.doi.org/10.1111/j.1467-8276.2007.01045.x