Wind/Hydro Power Generation Simulator
by
Patrick Murphy
Nick Steele
Justin Otus
Senior Project
Electrical Engineering Department
California Polytechnic University
San Luis Obispo
Table of Contents
List of Tables 3
List of Figures 4
Abstract 5
Chapter 1: Introduction 6
Chapter 2: Background 9
Chapter 3: Design Requirements 11
Chapter 4: Design 16
Bill of Materials 16
MSP432 Microcontroller 17
Self-Coded Adjustable Speed Drive 19
DC Motor Module 20
DC Machine used as a Generator 21
Self-Designed DC-DC Buck-Boost Converter 22
Complete Schematic 24
Chapter 5: Simulation Results 25
Microcontroller Simulation Results 25
Speed Drive Simulation Results 26
Motor and Generator Simulation Results 28
Buck-Boost Simulation Results 30
Chapter 6: Conclusion 32
References 34
Appendix A: Final Schematic 36
Appendix B: Microcontroller and DC Drive Code 37
Appendix C: Project Timeline 38
List of Figures
Figure 1-1: Share of Population with Access to Electricity 6
Figure 1-2: Mini Grid Optimization Graph 7
Figure 3-1: Level 0 Block Diagram 11
Figure 3-2: Level 1 Block Diagram 12
Figure 4-1: Level 2 Block Diagram 16
Figure 4-2: Microcontroller Model 18
Figure 4-3: Adjustable Speed Drive Model 19
Figure 4-4: DC Motor Module 21
Figure 4-5: Ideal Rotational Motion Sensor 21
Figure 4-6: DC Machine used as a Generator 21
Figure 4-7: DC-DC Buck-Boost Converter 23
Figure 4-8: DC-DC Buck-Boost Converter Subsystem 24
Figure 4-9: The Complete Simulink Model of the Wind/Hydro Simulator 24 Figure 5-1: Wind Power Curve – Power Output vs Wind Speeds 26
Figure 5-2: Speed Drive Input 27
Figure 5-3: Output of the Speed Drive 28
Figure 5-4: Final Voltage Output 29
Figure 5-5: Final Current Output 30
List of Tables
Table 3-1: Functional Requirements Level 0 11
Table 3-2: Functional Requirements Level 1 12
Table 3-3: Requirements and Specifications 14
Table 4-1: Bill of Materials 16
Table 5-1: Wind Speed Array and Control Voltage Array Test Data 26 Table 5-2: Final Output Voltages Related to the Output Power of a Wind Turbine 29
Abstract
Chapter 1: Introduction
Due to increased concerns on the use of non-renewable energy sources like coal or gasoline and their harmful effects to the environment, a large market for renewable energy sources has formed within the past decade and continues to grow today. This is evidenced by the fact that in the United States, solar and wind power industries have reportedly created jobs 12 times faster than the rest of the country’s economy, and have grown as much as 20% within recent years [1]. Renewable power usage has also become increasingly important for producing power in remote areas throughout the world. The amount of people gaining access to electricity has steadily increased for many years; however, estimates show that 670 million people will have no access to electricity, even by 2030 [2]. Figure 1-1 demonstrates areas, like Africa and Asia, where a large percentage of the population suffers from a lack of electricity [3].
Providing electricity to everybody is a challenge the world has struggled with, e.g. centralized power plants cannot reach out to every home in the world. It isn’t practical or profitable to extend power lines to every rural location far from main cities, especially in countries with underdeveloped public infrastructure. Figure 1-2 shows the exponential curve of how expensive expanding power lines into areas that are sparsely populated [4]. In mid to low density communities developing a small power grid localized to the rural area and unconnected to the national power supply is the most cost effective solution to supply these people with electricity.
Figure 1-2: Mini Grid Optimization Graph [4].
With the technological advances in solar, wind, and hydro power generation,
Chapter 2: Background
As previously discussed in Chapter 1, public access to electricity is inadequate in many parts of the world. This lack of available energy causes problems for people living without the necessities power provides; such as A/C, refrigeration, effective lighting, etc. Many rural communities in less developed nations aren’t connected to any power grid. One potential solution to this problem is building small scale power grids powered by renewable energy. Renewable energy is gaining traction across the world, so understanding how to efficiently provide the most cost effective solutions becomes more and more important. Products which estimate the energy produced in solar panels at a given location exist, but other forms of renewable energy lack similar software. Different areas benefit more from wind or water powered energy but it is difficult to predict how much power is produced, or how to maximize power efficiency. If a rural community lived near a strong running water stream or a windy plain, it could power their community with little investment. Solar panels can prove their worth, even before production, by estimating the energy produced, and wind and hydro energy must be able to do the same.
Renewable energy sources have demonstrated their practicality in recent years through mini-grids that operate off of solar or wind power. For example, solar mini-grids funded by the state government of Ogun State and the European Union were implemented in the Nigerian city of Gbamu Gbamu in early 2018. Prior to this installation, Nigerian citizens residing in the Ogun State relied on personal generators and could not even run multiple house appliances
power generators facilitates an increase in the amount of renewable energy mini-grids that are installed in areas like Gbamu Gbamu, as it makes cost-benefit analyses more accurate and specific.
Currently, no products are able to simulate wind or hydro generators based on a set of data for wind or hydro currents at a given location. Multiple senior projects have utilized a similar system, and this project attempts to build on their work. The primary project referenced is another senior project, “Wind and Hydroelectric Power Simulation for the DC House Project” by Randy Lormand and Christopher Goloskie [6]. The group developed a working system that was more reliant on a potentiometer instead of a set of wind/hydro speeds running through a
microcontroller, enabling a voltage range much larger than 0 V to the maximum output voltage of the microcontroller. Another senior project, “Wind/Hydro Generator Simulator” by Michael Djaja and Christopher Rotsios [7] aimed to solve the same problem as ours; however, was unable to complete it due to the unreliability of their parts. Their system is similar to the system that we will be implementing; however, this project focuses on improving the system characteristics by choosing appropriate components that will be able to handle the speeds of the system. This project aims to improve the accuracy of simulation by having a larger range of outputs available.
To summarize, this design project aims to accurately simulate the power generation of both wind and hydroelectric generators. By inputting a set of wind or water speeds for a given amount of time, this will simulate a scaled down energy output to a generator that will then be converted to a 12V power supply for use. This project will represent an accurate representation of the amount of power that would be generated by a renewable power generator and
Chapter 3: Design Requirements
Block Diagrams
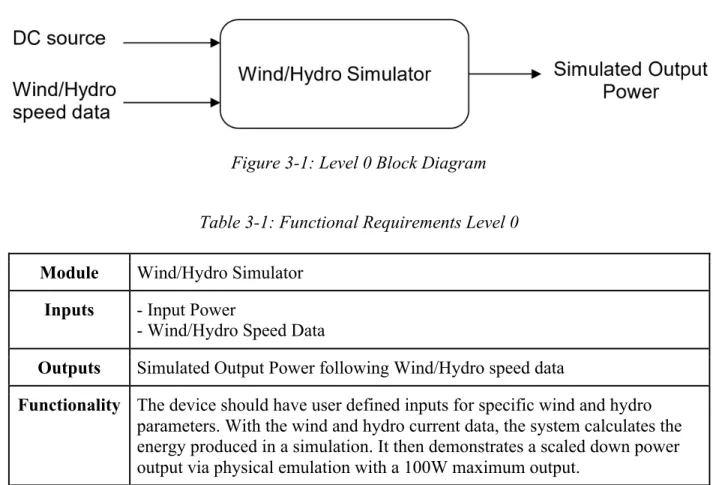
The overall requirement of this system is to power a DC motor using a set of wind/hydro flow speeds in a data file created in Excel or Matlab. The motor spins a generator to form usable power that follows the Wind/Hydro speed date. The level 0 diagram is shown in Figure 3-1.
Figure 3-1: Level 0 Block Diagram
Table 3-1: Functional Requirements Level 0
Module Wind/Hydro Simulator Inputs - Input Power
- Wind/Hydro Speed Data
Outputs Simulated Output Power following Wind/Hydro speed data
Functionality The device should have user defined inputs for specific wind and hydro parameters. With the wind and hydro current data, the system calculates the energy produced in a simulation. It then demonstrates a scaled down power output via physical emulation with a 100W maximum output.
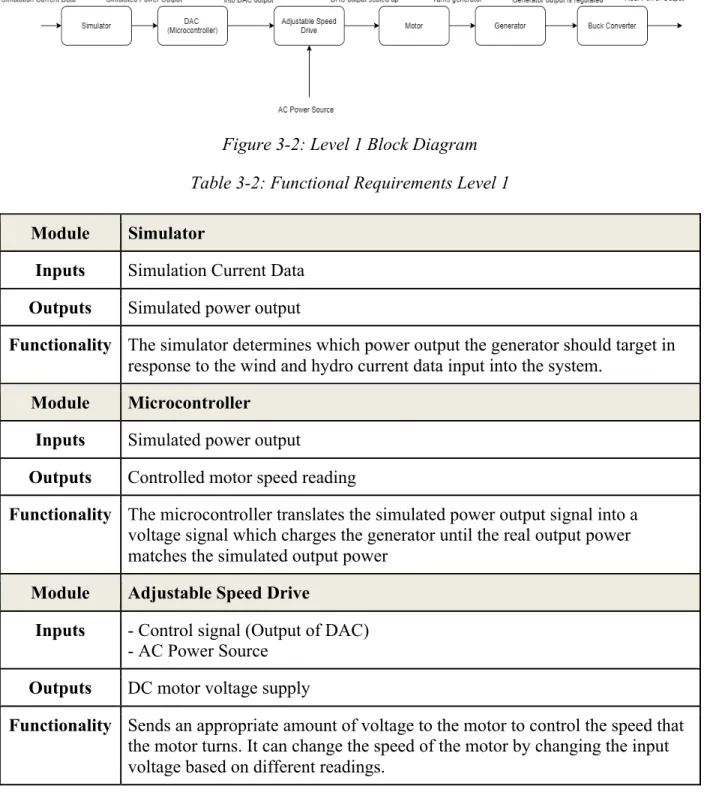
wind/hydro currents spinning a turbine in whatever location is being analyzed, and it will charge a generator. That generator output connects to a DC-DC converter to regulate the voltage into a constant value required by the load.
Figure 3-2: Level 1 Block Diagram
Table 3-2: Functional Requirements Level 1
Module Simulator
Inputs Simulation Current Data Outputs Simulated power output
Functionality The simulator determines which power output the generator should target in response to the wind and hydro current data input into the system.
Module Microcontroller Inputs Simulated power output
Outputs Controlled motor speed reading
Functionality The microcontroller translates the simulated power output signal into a voltage signal which charges the generator until the real output power matches the simulated output power
Module Adjustable Speed Drive
Inputs - Control signal (Output of DAC) - AC Power Source
Outputs DC motor voltage supply
Module Motor
Inputs DC motor voltage supply Outputs Generator power
Functionality The motor receives the voltage signal from the microcontroller and turns the generator in response.
Module Generator
Inputs Generator power (turns generator) Outputs Real Power Output
Functionality The generator models the simulation results on a small scale, representing the effectiveness of a turbine’s placement via live demonstration.
Module Buck Converter
Inputs DC power from the generator Outputs Constant DC power supply
Functionality Takes the variable voltage from the generator and converts it to a constant voltage that can be used to power an appliance
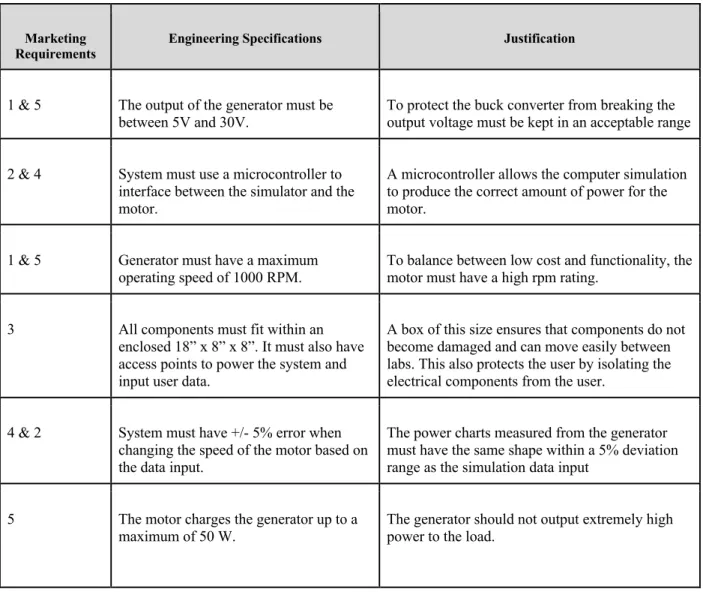
Technical Design Requirements
between 5V and 30V from the generator. This is to make sure that the Buck converter doesn’t overload with current or voltage with our load. This creates a maximum power output of 50W to the Buck converter. All of these components must fit inside a 18” x 8” x 8” enclosed box for protection and to be able to easily move the system. The box must have wires protruding from it that allow a user to connect a laptop to the microcontroller and to connect an appliance via USB to the system output voltage. Table 3-3 summarizes the marketing requirements along with their corresponding engineering specification and justification.
Table 3-3: Requirements and Specifications
Marketing
Requirements Engineering Specifications Justification
1 & 5 The output of the generator must be
between 5V and 30V. To protect the buck converter from breaking the output voltage must be kept in an acceptable range
2 & 4 System must use a microcontroller to interface between the simulator and the motor.
A microcontroller allows the computer simulation to produce the correct amount of power for the motor.
1 & 5 Generator must have a maximum operating speed of 1000 RPM.
To balance between low cost and functionality, the motor must have a high rpm rating.
3 All components must fit within an enclosed 18” x 8” x 8”. It must also have access points to power the system and input user data.
A box of this size ensures that components do not become damaged and can move easily between labs. This also protects the user by isolating the electrical components from the user.
4 & 2 System must have +/- 5% error when changing the speed of the motor based on the data input.
The power charts measured from the generator must have the same shape within a 5% deviation range as the simulation data input
5 The motor charges the generator up to a
1 & 5 Buck converter regulates generator output to useable power.
The buck converter must convert the changing output voltage of the generator to a constant voltage that can be used to power an appliance.
Marketing Requirements
1. The component parameters balance functionality and cost of materials. 2. A customizable input voltage signal must control the speed of the motor. 3. The components fit safely in a mid-sized box.
4. The system must accurately represent the energy production information simulated in real world conditions of wind and hydro generators.
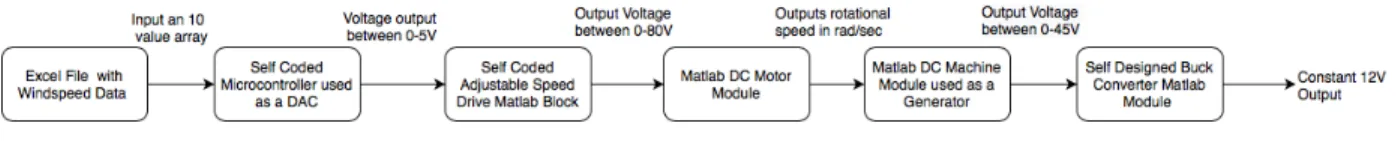
Chapter 4: Design
Due to COVID-19, the scope of our project has changed from building a system that physically simulates the power output of wind and hydroelectric generators at different speeds to simulating that system with the Simulink tools in Matlab. We are unable to use the lab
equipment to build our prototype, so we are re-creating a system that mimics the initial design from Chapter 3. Within Matlab’s Simulink tools, a library known as “Simscape” allowed us to incorporate many different electrical components into our design. We used the Simscape
components whenever possible, and when it wasn’t possible we designed our own. Each block of the system was re-created with the hope that this simulation can be a useful reference when building a physical prototype. The following level 2 block diagram represents the simulated blocks that were built inside Simulink.
Figure 4-1: Level 2 Block Diagram
Because many of the system components were simulated and not purchased, much of the information in a bill of materials is incomplete at this time, but it was still constructed in an attempt to catalogue all of the components that are relevant in this system’s design.
Table 4-1: Bill of Materials
Qty Value Description Size Part
Number
Manufacturer Per Unit Cost ($)
1 90V, 1.4HP DC Motor N/A AP7402 Baldor $499.99
1 12/24V DC Magnetic
Generator
N/A 2325121 61551
TTech $55.95
1 90/180V, ½ HP
DC Drive N/A
GSD4-240-5C
Automation Direct
$71.00
1 6V - 40V DC-DC
Converter
N/A LM2596 Wmycongcong $7.95
Total $657.89
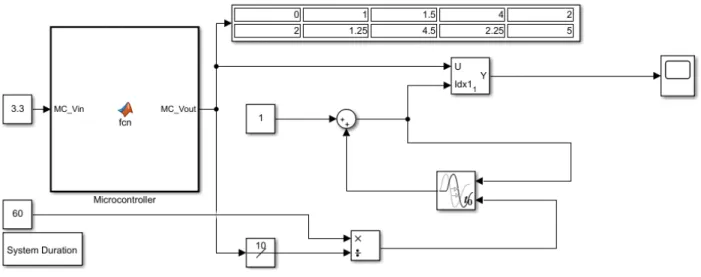
MSP432 Microcontroller
Figure 4-2: Microcontroller Model
The following was the MATLAB code used to program the microcontroller function block:
% Define function output and input function MC_Vout = fcn(MC_Vin)
% Define user-input array (0 - 50 km/h)
InputArray = [15 20 30 45 10 15 22 50 38 3];
Array_Size = length(InputArray); % Number of array elements
m = (5/37); % Slope of Wind/Power Curve
b = -(5/37)*13; % Wind/Power Curve Adjustment
% Initialize Conv Array
ConversionArray = zeros(1,Array_Size,'double')
% Initialize output array
MC_Vout = zeros(1,Array_Size,'double')
% Convert wind speed input data into speed drive control voltage
for index1 = 1:Array_Size
if InputArray(index1) > 13
ConversionArray(index1) = InputArray(index1)*m + b; else
ConversionArray(index1) = 0; end
end
if MC_Vin == 3.3 % 3.3V Source is connected to MSP432
for index2 = 1:Array_Size % Index through the array
for index2 = 1:Array_Size % Set output array elements to 0 MC_Vout(index2) = 0;
end
end
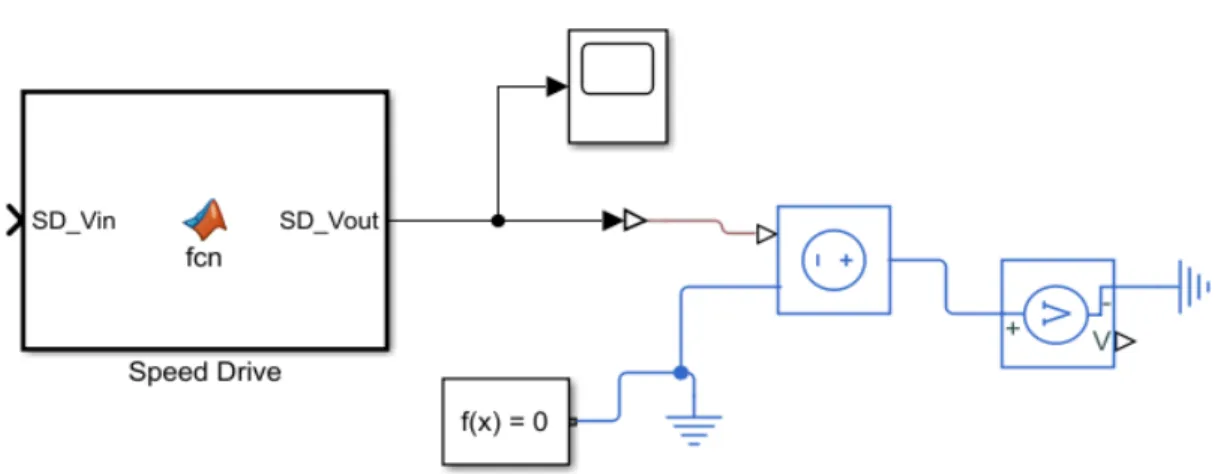
Self-Coded Adjustable Speed Drive
The adjustable speed drive was programmed to receive a voltage signal within a specific range from the microcontroller model and output a range of values that are mathematically scaled via a linear equation defined in the user-defined MATLAB module. The output of this module was converted to a Simscape electrical DC signal so that it can be used as an input to the DC motor module. Figure 4-3 displays the adjustable speed drive model. Note that the input and output range was set to 0V - 5V and 0V - 100V, respectively. This can be changed by the user in the code used to program the function block. The output of the speed drive gets converted to an electrical DC signal using the same array from the microcontroller section where the two component models are connected.
The following was the MATLAB code used to program the adjustable speed drive function block:
% Define function output and input function SD_Vout = fcn(SD_Vin)
Vin_Max = 5; % Define maximum Vin to 5V Vout_Min = 0; % Define minimum Vout to 20V Vout_Max = 100; % Define maximum Vout to 80V % Minimum Vin is assumed to be 0V
if SD_Vin >= 0 % If input is not negative
SD_Vout = ((Vout_Max-Vout_Min)/Vin_Max)*SD_Vin+Vout_Min; % Linearly scale input to output
else % If input is negative
SD_Vout = Vout_Min; % Set output to minimum Vout end
DC Motor Module
The DC Motor Model used was taken directly out of the Simscape Library in Matlab as illustrated in Figure 4-4. It is driven by a constant DC voltage source and it produces the
Figure 4-4: DC Motor Model Figure 4-5: Ideal Rotational Motion Sensor
DC Machine used as a Generator
The generator was designed using the Simulink model DC Machine because of its ability to input rotational speed and convert it into a constant voltage and it is configurable. Figure 4-6 shows the machine model. Since the motor can output a range of rotational speeds (⍵), the DC Machine mechanical input was set to take ⍵, instead of torque. The voltage source between the positive and negative field voltage terminals characterized the voltage output, compared to the rotational speed input. To replicate voltage values that can work for an available DC-DC converter a voltage value of 0.05V was chosen. This creates an equation of 𝑉9 = 𝑉:∗ 0.5375
between the input of the motor and the output of the generator.
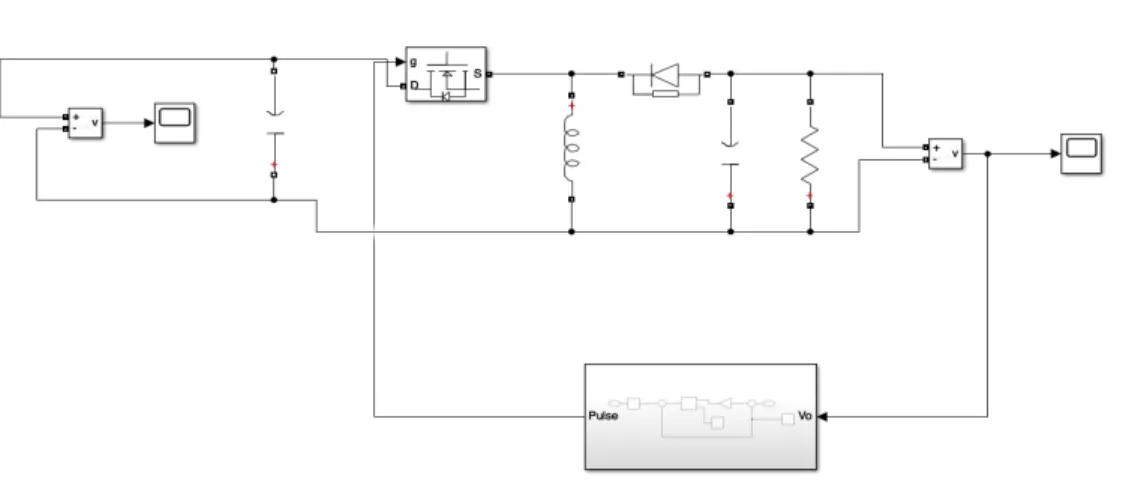
Self-Designed Buck-Boost Converter
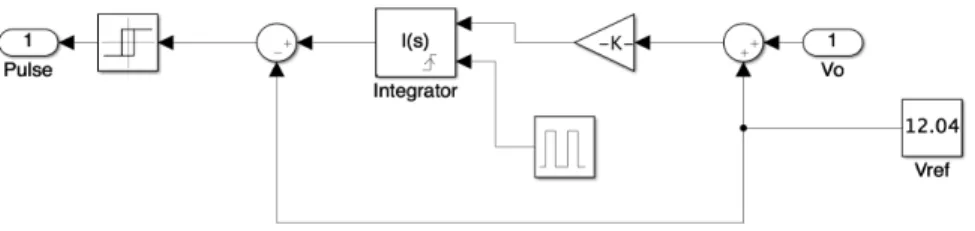
The DC-DC converter needs to regulate the large input range into a more predictable, fixed output voltage. Since most appliances are charged at 12V, this was the voltage we targeted. The generator produces voltage above and below 12V, requiring a buck-boost implementation to handle the wide voltage range as shown in Figure 4-7. 55 V is the upper limit of what our system can output, but that is a dangerous threshold to operate under for most common appliances. To control this, the DC-DC converter uses a subcomponent shown in Figure 4-8 designed by Diamond Matlab Tutorials that helps our converter to always reference the correct voltage. The other components were characterized to work with the range of possible voltages. In order to give the components time to charge and discharge properly, a maximum duty cycle of 80% was set. By analyzing different signals in the simulation program VINMAX=55 V, ΔVO=0.28 V, IOMIN=600 µA, IOMAX=780 µA, and TS=100 µs were all determined. With these parameters set, the remaining characteristics of the converter could be calculated. When duty cycle D is set to the maximum value, the minimum value of input voltage VIN can be calculated with the following steady-state buck-boost equation in continuous conduction mode.
𝑉9 = 𝑉=>∗ −𝐷 1 − 𝐷
Using the above equation, VIN is found to be 3 V; thus, providing an input range of 3 V to 55 V. By using the same equation, the minimum duty cycle can be found by using the maximum input voltage The result yields minimum duty cycle DMIN of 36.4%. The switching frequency can be calculated simply from the period:
This yields switching frequency of 10 kHz. Using these system parameters, the minimum values of the capacitors and inductor can be calculated with the following formula.
𝐿E =
(1 − 𝐷)F∗ 𝑉 G
2 ∗ 𝑓 ∗ 𝐼GJ=K
𝐶G =𝐼GJMN∗ 𝐷 𝛥𝑉G∗ 𝑓
𝐶=K =𝐼GJMN∗ 𝐷 𝛥𝑉=K∗ 𝑓
The smallest or critical inductance or capacitance values are needed to ensure that the
components will function properly in all operational conditions. Using the above equations, the minimum inductance is 40 mH, minimum output capacitance is 101.4 nF, and minimum input capacitance is 676 pF. Input capacitance is unnecessary in simulation where ideal voltage sources are possible but it is an important consideration in the actual hardware design. Readers should note that because these values represent theoretical minimums, component sizes will need to be increased and finely tuned to properly function in simulations with nonideal conditions and especially in hardware.
Figure 4-8: Buck-Boost Converter Subsystem
Finally, all components previously described were combined as depicted in Figure 4-9 to make the complete model of the full system. Note that a capacitor was added between the generator and the DC-DC converter to help with feedback voltage.
Chapter 5: Simulation Results
The simulation tool that was used for this project was Simulink in Matlab. This is a graphical programming environment for modeling, simulating, and analyzing multi-domain dynamic systems [8]. This program was chosen because Simulink works very well when
simulating complex circuitry, and it can also include Matlab programs into the simulation.
Within Simulink there is a library called Simscape, a folder that allows for the simulations of
electrical systems like capacitors, resistors, and even the motor. This is the only simulation tool
that has physical systems already programmed into the simulation tool.
At various stages in the project different voltage and current ranges are required in order to ensure that the system accurately translates an array of wind speed data into a corresponding generator output. The system was probed at each stage to test that every component was operating under expected conditions. Finally, the generator output was compared to the wind speed array to ensure that it was incrementing and decrementing proportional to the changes within that array.
Figure 5-1: Wind Power Curve - Power Output (MW) vs. Wind Speed (km/h) [9]
Table 5-1: Wind Speed Array and Control Voltage Array Test Data
Wind Speed Array (km/h)
5 20 25 40 50 40 35 10 15 20
Control Voltage Array
(V)
0 0.9459 1.622 3.649 5.000 3.649 2.973 0 0.2703 0.9459
represented by Figure 5-3 is an identical graph with one exception, the voltage range is expanded from 0-5 V up to 0-100 V. This was chosen to represent the predicted input range of the Baldor DC Motor that was originally going to be used, as we tried to replicate the parts that were going to be built so that implementation will be easier in the future. There were complications born from system integration; the voltage signal rapidly oscillates between held values within the speed drive. This oscillation was not present during the testing of each individual system; however, it does not affect the output of the total system. What is causing this error is unknown, and while the implementation of a capacitor could potentially damp it, adding one properly in Simulink proved difficult.
Figure 5-3: Output of Speed Drive
The output voltage of the generator represents the changing power output of the
𝑇𝑢𝑟𝑏𝑖𝑛𝑒 𝑃𝑜𝑤𝑒𝑟 = 0.009 ∗ (𝑂𝑢𝑡𝑝𝑢𝑡 𝑉𝑜𝑙𝑡𝑎𝑔𝑒)F+ 0.0478 ∗ (𝑂𝑢𝑡𝑝𝑢𝑡 𝑉𝑜𝑙𝑡𝑎𝑔𝑒) − 0.0904
and is calculated using the related values shown in Table 5-2. Note that this equation solves for power in MW and uses a logarithmic trendline to calculate power.
Table 5-2: Final Output Voltages related to Output Power of a Wind Turbine
Wind Speed (km/h) Generator Output Voltage (V) Power (MW)
13 0 0
15 2.95 0.05
20 10.3 0.08
25 17.7 0.216
30 25 0.34
35 32.4 0.552
40 39.8 0.744
45 47.15 0.912
50 54.5 1
Figure 5-5: Final Current Output
The DC-DC converter output shown in Figure 5-6 should regulate the generator output into a safe and predictable 12 V, and in general this behavior is followed. This is to make the output voltage usable for the common device during implementation. Since a Buck-Boost design was used, any output voltage is going to be able to generate 12 V. This is useful in
Chapter 6: Conclusion
The goal of this project is to develop a Wind/Hydro Simulator that can simulate the power generation of wind and hydroelectric turbines created by various wind and water speeds. As demonstrated in Chapter 5, Matlab/Simulink implementation of the proposed design
demonstrated that the goal was accomplished and a relationship between the generator output and wind/water speed input parameter was determined. The proposed design was able to follow a general pattern of wind speeds consistently and an equation was developed to model the voltage output of the system to a hypothetical power output for a 1 MW wind turbine. However, this system was designed to be physically implemented and was developed to mimic the system of components that we had available to us in the lab.
Due to the nature of the project being remodeled into a virtual simulation as a result of COVID-19, certain system functionality had to be artificially generated in Matlab such as the microcontroller and motor drive. Since the preliminary Matlab/Simulink model for the proposed may not include every single non-ideality in the system, the simulation results had an error in voltage reading between these components. This resulted in rapid oscillation in the voltage readings for these components; however, this does not affect much on the final result, at least as far as simulation is concerned. Other parts of the system such as the motor coupled to a DC generator needed to be simulated through Simulink components found within the Simscape library of the program. The input of the motor was between 0 - 100V which would replicate the hypothetical input for the Baldor DC motor. The output of this generator is between 0 - 54.5 V, which gives us a large range to develop an equation for the change in wind speeds.
jumps when wind speed changes would be smaller. This might make it difficult to record a variety of data points in implementation. We advise a possible change in the implementation for this part of the project. After developing a simulation and reading the results of the previous senior project group [7], it seems like this is the crippling part of the project. It is hard to have a wide variety of motor outputs in such a specific range. A custom made wide-range input DC-DC converter, or a possible change in design, could help the building of this project to work better.
Furthermore, mechanical limitations that would be present in a wind/hydroelectric turbine had to be accounted for as well in the form of maximum power generation at a specific wind/water velocity before beginning to fail. We implemented a 13 km/h cut-in speed and a maximum power speed at 50 km/h. The next step to improve this project would be to develop a better relationship between wind speeds and power generation of wind and water turbines. This system can separate wind speeds into distinct voltages, and if a better relationship were
References
[1].Zafar, S., 2019. How Renewable Energy Benefits Rural Areas. [online] EcoMENA. Available at: <https://www.ecomena.org/renewable-energy-rural/> [Accessed 5 June 2020].
[2].Daly, H., n.d. 1.1 Billion People Still Lack Electricity. This Could Be The Solution. [online] World Economic Forum. Available at:
<https://www.weforum.org/agenda/2018/06/1-billion-people-lack-electricity-solution-mini-grid-iea/> [Accessed 5 June 2020].
[3].Ritchie, H. and Roser, M., 2016. Energy. [online] Our World in Data. Available at: <https://ourworldindata.org/energy> [Accessed 5 June 2020].
[4].“When are renewable energy mini-grids more cost-effective than other options?,” U.S.
Agency for International Development, 13-Feb-2018. [Online]. Available:
https://www.usaid.gov/energy/mini-grids/economics/cost-effectiveness. [Accessed:
04-Jun-2020].
[5].Yee, A., 2018. Solar Mini-Grids Give Nigeria A Power Boost. [online] The New York Times. Available at: <https://www.nytimes.com/2018/12/02/climate/solar-mini-grids-give-nigeria-a-power-boost.html> [Accessed 5 June 2020].
[6].Lormand, R. and Goloskie, C., 2013. Wind And Hydroelectric Power Simulation For The DC House Project. [online] San Luis Obispo: Digital Commons, pp.1-32. Available at: <https://digitalcommons.calpoly.edu/cgi/viewcontent.cgi?article=1222&context=eesp> [Accessed 5 June 2020].
<https://digitalcommons.calpoly.edu/cgi/viewcontent.cgi?article=1444&context=eesp> [Accessed 5 June 2020].
[8].Wikipedia. 2020. Simulink. [online] Available at:
<https://en.wikipedia.org/wiki/Simulink> [Accessed 5 June 2020].
[9].Lloyd, E., Jenden, J., Heffernan, B., Hanania, J., Campbell, A., and Donev, J. 2020. Wind Power. [online] Energy Education. Available at:
<https://energyeducation.ca/encyclopedia/Wind_power> [Accessed 5 June 2020]. [10]. Diamond Matlab Tutorials, 2018. Matlab Simulation Of Buck Boost Converter
With Closed Loop Control. [video] Available at:
<https://www.youtube.com/watch?v=SwMiXKQ3uhY> [Accessed 5 June 2020]. [11]. Mathworks. 2020. Simulink-PS Converter. [online] Available at:
<https://www.mathworks.com/help/physmod/simscape/ref/simulinkpsconverter.html> [Accessed 5 June 2020].
[12]. Mathworks. 2020. Ideal Rotational Motion Sensor. [online] Available at:
<https://www.mathworks.com/help/physmod/simscape/ref/idealrotationalmotionsensor.ht ml> [Accessed 5 June 2020].
Appendix
APPENDIX B — MICROCONTROLLER AND DC DRIVE CODE Speed Drive:
% Define function output and input
function SD_Vout = fcn(SD_Vin)
Vin_Max = 5; % Define maximum Vin to 5V
Vout_Min = 0; % Define minimum Vout to 0V
Vout_Max = 100; % Define maximum Vout to 100V
if SD_Vin >= 0 % If input is not negative
SD_Vout = ((Vout_Max-Vout_Min)/Vin_Max)*SD_Vin+Vout_Min; % Linearly scale input to output
else % If input is negative SD_Vout = Vout_Min; % Set output to minimum Vout
End
Microcontroller:
% Define function output and input function MC_Vout = fcn(MC_Vin)
% Define user-input array (0 - 50 km/h)
InputArray = [15 20 30 45 10 15 22 50 38 3];
Array_Size = length(InputArray); % Number of array elements
m = (5/37); % Slope of Wind/Power Curve
b = -(5/37)*13; % Wind/Power Curve Adjustment
% Initialize Conv Array
ConversionArray = zeros(1,Array_Size,'double') % Initialize output array
MC_Vout = zeros(1,Array_Size,'double')
% Convert wind speed input data into speed drive control voltage for index1 = 1:Array_Size
if InputArray(index1) > 13
ConversionArray(index1) = InputArray(index1)*m + b;
else
ConversionArray(index1) = 0;
end end
if MC_Vin == 3.3 % 3.3V Source is connected to MSP432 for index2 = 1:Array_Size % Index through the array
MC_Vout(index2) = ConversionArray(index2); end
else % 3.3V Source is not connected for index2 = 1:Array_Size % Set output array elements to 0 MC_Vout(index2) = 0;
APPENDIX D — ANALYSIS OF SENIOR PROJECT DESIGN
Project Title: Wind/Hydro Power Generation Simulator
Student’s Name: Patrick Murphy, Justin Otus, Nick Steele
Advisor’s Name: Taufik
1. Summary of Functional Requirements
The project aims to create an accurate simulator that can model the behaviors of power generation based
on wind and hydro current speeds. It simulates the rotational speed generated by a wind or hydro turbine
based on an input of speeds and translates that into a voltage that can be converted into power generation.
It then converts that voltage into a 12 V voltage source to simulate a usable power output.
2. Primary Constraints
The greatest challenge in this project was designing the system to try to simulate actual component parts.
Since this project was not able to be built, the Simulink modules try to replicate possible values that could
be seen based on the components recommended in the report. The DC-DC converter input will be hard in
implementation because of how sensitive they are to voltages and currents. This directed how we
characterized our modules and what our inputs and outputs should be.
The integration between different modules was the most difficult part of the project. Since we were using
multiple kinds of libraries (Matlab code, Simulink, Simscape), connecting the different components
limited the tools we could use and the amount of extra components we could attach. This caused
oscillation with our voltage readings because we were unable to add components to help solve the
problem.
3. Economic
This project relates to natural capital, because it focuses on increasing the renewable energy produced by
geographical areas. With increased construction of renewable energy turbines, jobs in manufacturing and
construction enable more wind and hydro farms. Although the project focuses on software, the results
promote the construction of real turbines.
The cost of this project would mostly be in the development stage of the project lifecycle. Since this
project is now completely simulation, no cost would be needed for manufacturing or selling, instead the
designers would be the bulk of the cost. There will be a little cost in maintaining and improving the
system, but again that would be to the designers. The benefits presented by the project happen after the
project lifecycle and interest those involved with the design of turbines, as it is much cheaper to test a
turbine in a simulator than to spend the time and money to build a product that may have suboptimal
performance. This will help them improve their project by being used in the testing phase of their project
lifecycle.
The project only requires a computer with Matlab installed. The user can input data into the predesigned
Matlab program and run it through a simulation. The product costs $50 because it serves a niche market
and presents great value to a few individuals, but has no manufacturing cost. Our potential customers are
renewable energy companies and people who are interested in the development of off grid communities.
This would help them understand the estimated power generation they should receive and maximize their
power output.
Original estimated cost of component parts (as of the start of your project).
DC Motor: $ 77.00
Microcontroller: $ 19.99
Generator: $ 65.00
DC-DC Converter: $ 7.98
The actual cost and bill of materials was $0. Since this project got limited to only a simulation, none of
the original parts were purchased. The only piece of equipment needed is a laptop with a functioning
Matlab license. Since Matlab is provided by Cal Poly, no costs were accrued during this project. If Matlab
did need to be purchased, it would cost $149 to get a personal license.
The only inputs required for this project is Matlab, however, students can acquire the license for free,
making the cost negligible during the prototyping phase. This means that the project would cost nothing
except for the designers time. This project earns money through consumers and is targeted for a price of
75$. Since there is no cost to the project except the designers time, virtually all the revenue would be
profits. The profits go to the entrepreneurs who built the simulator, but the customer also benefits by
gaining more profitable generators, and the environment benefits by increasing consumption of clean
energy.
Because the product is based in software, maintenance and operation costs stay low and product durability
stays high. The only cost would be updating the simulation code periodically to produce more accurate
results. This product can emerge at any time because renewable energy is so relevant today. Expanding
the amount of clean energy and providing energy to everyone is a continuous goal. This product, with
proper maintenance, can last forever. Since it is a simulation, it will never break down and can be
continuously updated.
The project Gantt charts that describe the time estimates of each section of the project are presented in
appendix C, however, after the project ends continuous updates are needed. Since there is no
manufacturing, after the project improving the system is the only thing that needs to be worried about.
4. If manufactured on a commercial basis:
Since our product appeals to a specific industry, it markets to companies who specialize in the renewable
energy industry and people who are aiming to develop mini-grids. Few companies exist in these fields, so
Since there is no manufacturing process, there would be no cost associated with it.
The estimated price point per device rests at $75. We have to cover the costs of time during development
and make it a worthwhile project. Since it is a niche market and the cost of manufacturing is $0, the price
is tried to be kept low to encourage more customers.
Calculating these numbers would result in a $18,750 profit.
250*75 - 0 = $ 18,750 profit
The only time needed to execute the program involves the time needed to input data. The consumption of
the data would take the most time, if specific conditions weren’t already documented. The simulation
would require approximately 5min to execute and would determine a specific geographical location for
the time that the data captures. The data samples over a 60 second time interval and estimates those
specific conditions for any set of wind data.
5. Environmental
This project promotes environmental sustainability, because it directly relates to the production of more
renewable energy, decreasing the environmental impact of power generation. The manufacturing of
devices and construction of wind and hydro generators would use natural resources such as metals or
polymers that might be harmful to mine or synthesize, however the benefits in renewable power
generation outweigh the costs of the materials and their manufacturing processes.
The project does not directly use any natural resources or ecosystems because it leans heavily on
programmed simulations. Indirectly, it promotes the construction of wind or hydro turbines that use
powerful wind or water currents from the ecosystem. The environmental costs are very low, as they’re
limited to indirectly promoting subsequent construction projects.
The project would serve to improve the natural energy we produce which would decrease the energy
causing harm to the environment. A potential problem exists in the disruption of animal ecosystems. For
the potential deaths of birds becomes a risk in this scenario. In the long term this could cause migration
patterns to shift, doing permanent ecological damage.
This project could have a negative impact on specific ecosystems, if more wind or hydro generators get
installed. But it also has the potential to produce a cleaner environment, benefiting many different species
by replacing dirty forms of electricity generation such as coal or oil burning and cutting down on
pollution. Less pollution means higher air and water quality, two essential parts of any ecosystem.
6. Manufacturability
The only subsystem of the project needing manufacturing are the motor and generator, and the challenges
associated with manufacturing the motor include the difficulty of finding a component rated for both high
power and low rpm. This could cause an increase in price for components; however the assembly should
go smoothly due to the limited parts. Once the units are manufactured, shipping would likely cost a lot
due to the size and weight of the device. This product sells to specific companies, and would have
individually ship to each business. Therefore, our device does not get cheaper when scale increases. The
simulation aspect of the project can distribute easily through download and works on any computer with a
Matlab license. This aspect would scale very easily, and cost no additional money.
However, because COVID19 forced an abrupt shift in the direction of the project, there are no real
manufacturing costs. While the analysis above is still applicable to anybody crafting a prototype, this
project was completed entirely within the Simulink program in Matlab. As a result, the only thing needed
to replicate the project would be a Matlab license.
7. Sustainability
The sustainability challenges associated with the maintenance of the device don’t relate to the project
itself, the device exists on a small scale and has no substantial impact on the environment. Nevertheless,
the simulator functioning properly has an extraordinary influence on sustainability, as it encourages more
This project impacts sustainable resources by contributing more renewable power sources into the
world. Improving the operation of sustainable power sources increases the world’s sustainability.
Further understanding energy calculations or predicting wind and hydro patterns is a challenging part of
improving the design. Since the project focuses on software, updating and renewing the code to maintain
relevance becomes important. The challenge in getting more accurate simulations involves accurately
simulating data entered into the simulation.
There are few issues or challenges with maintaining the completed device. Upgrading and distributing the
simulation software carries no sustainability challenges on its own, as releasing an update via the Internet
doesn’t involve using natural resources or interacting with ecosystems.
8. Ethical
Use of this project and, more broadly, any device utilizing or genuinely addressing renewable energy is
ethical within a utilitarian moral framework because doing so combats the effects of climate change on
the planet while only costing those who work in dirty industries, like coal, in the short term. Far more
people are helped by the project than those harmed.
In terms of the IEEE code of ethics, the design process of this project coincides with sustainable
developmental practices as it furthers the development of renewable energy sources. Furthermore,
information presented when reporting project results is delivered with integrity, not misrepresenting
findings or accepting bribes to allow for mistakes or cut corners. If results were to be presented
dishonestly, this project would violate the IEEE code of ethics.
Misuse of the project could take the form of misrepresentation of renewable power generation via
exploitation of potential software limitations by companies that would want to present renewable energy
9. Health and Safety
Due to the virtual nature of the project, there are no safety precautions that need to be taken in order to
use the simulation system.
10. Social and Political
Because the project addresses renewable energy, this inevitably associates it with the political debate
within the United States concerning climate change. Because of this, it would impact companies that
invest in renewable power systems that utilize wind and hydroelectric energy as well as companies that
compete with such companies.
Examples of companies that could benefit from the project include Avangrid Renewables and NextEra
Energy Resources. Companies that could potentially be negatively affected include Peabody Energy,
ConocoPhillips, and Enterprise Products.
Companies that could benefit the most from this project would not be particularly large or powerful.
Larger companies have likely developed renewable power simulation software more accurate than the
scope of this project can reach and more accurate than what smaller companies have access to. Therefore,
this project would benefit smaller companies that generate wind and hydroelectric power to a greater
degree. Those negatively affected by the project have much more power than the companies that benefit
from it. Companies that harvest a large percentage of resources such as oil and coal have great political
power within the United States, thus allowing for congressional manipulation via lobbying. Such
companies would be negatively affected by smaller renewable energy companies infringing on their
market share.
11. Development
Due to the virtualization of this project as a result of COVID-19, the original system design was
simulated in Matlab via Simulink, utilizing Simscape as a tool to represent electrical signals. We learned
how to properly implement Simscape electrical blocks such as the built-in DC motor as well as program
Simulink user-defined function blocks in order to mimic specific component functionality that was not
![Figure 1-1: Share of Population with Access to Electricity [3].](https://thumb-us.123doks.com/thumbv2/123dok_us/8221573.2179725/6.918.161.748.612.1007/figure-share-population-access-electricity.webp)
![Figure 1-2: Mini Grid Optimization Graph [4].](https://thumb-us.123doks.com/thumbv2/123dok_us/8221573.2179725/7.918.123.782.454.918/figure-mini-grid-optimization-graph.webp)