RESIDUE LEVEL QUANTIFICATION OF PROTEIN STABILITY IN LIVING CELLS
William B. Monteith
A dissertation submitted to the faculty of the University of North Carolina at Chapel Hill in partial fulfillment of the requirements for the degree of Doctor of Philosophy in
the Department of Chemistry.
Chapel Hill 2014
ABSTRACT
William B. Monteith: Residue Level Quantification of Protein Stability in Living Cells (Under the direction of Gary J. Pielak)
The intracellular milieu differs from the dilute conditions in which most biophysical and biochemical studies are performed. This difference has led both experimentalists and theoreticians to tackle the challenging task of understanding how the intracellular environment affects the properties of biopolymers. Despite a growing number of in-cell studies, there is a lack of quantitative, residue-level information about equilibrium thermodynamic protein stability under non-perturbing conditions. My dissertation addresses this void by describing the use of NMR-detected hydrogen-deuterium exchange of quenched cell lysates to measure
individual opening free energies of the 56-amino acid B1 domain of protein G (GB1) in living Escherichia coli cells without adding destabilizing co-solutes or heat.
Comparisons to dilute solution data (pH 7.6 and 37 °C) show that opening free energies increase by as much as 1.14 ±0.05 kcal/mol in cells. Importantly, I also show that homogeneous protein crowders destabilize GB1, highlighting the
than in buffer. The results indicate that quinary interactions between surface exposed residues and cytoplasmic proteins can play a key role in determining the native stability of a protein, whereas such a role is absent in buffer alone. The methods developed and applied throughout this work should prove useful for
ACKNOWLEDGEMENTS
Within one week of rotating in the laboratory of my mentor, Prof. Gary Pielak, I knew I had found my home for the foreseeable future. It wasn’t because of the science (I thought all E. coli was dangerous to be around prior to starting my PhD), but because I had found a highly functional and intelligent human being with some of the most bizarre neuroticisms I had ever encountered. I was intrigued. Over the years, he never ceased to amaze and amuse with his one-liners, nuttiness and general lack of tact (most of which I have kept an electronic record of and will pass down to current Pielakers when I leave the lab). I am lucky to have the distinct
pleasure of sharing an apartment for three months with Gary and his wife, Elizabeth, in Galway Ireland working with collaborators at NUI-Galway (many thanks to
Elizabeth for being such a wonderful cook and sustaining me not only during our time in Ireland, but also the many times at the Pielak Lab gatherings at 3 Martha Lane).
I have the utmost gratitude and respect for Gary. He motivated me out of numerous local minima throughout the years and instilled in me the perseverance to keep pushing in the laboratory. Gary has always given me all the credit for
wisdom, support and espresso. His mental database for scholarly literature is freakish and unparalleled – ask him a question in protein chemistry and he returns the seminal paper, including author, journal and year almost immediately. I guess that’s par for the course for a guy who translates Morse code at 5 am each day. Thanks for the memories and the education, GJP.
I would like to acknowledge the Department of Chemistry at East Carolina University for an outstanding education and excellent research opportunities prior to beginning my doctoral work. I am indebted to Prof. Allison Danell for teaching me to think like an analytical chemist, and I thank Profs. Rickey Hicks and Colin Burns for sparking my fascination with nuclear magnetic resonance. A big thank you to the department for inviting Gary and me to give a seminar in March 2014 at ECU. It was truly an honor and the most fun I have ever had presenting my work.
Many thanks to Prof. Peter Crowley and his laboratory at NUI-Galway for hosting me during the Walton fellowship. Special thanks to Ciara Kyne for aiding in backbone amide chemical shift assignments at low pH, and generally for showing me such great craic in beautiful Ireland.
I owe a great deal of appreciation to Dr. Marc ter Horst in the NMR facility for giving the Pielak group first priority on the Varian 600 MHz instrument and for rapidly addressing spectrometer maintenance issues as they arose. I also thank Dr.
Ashutosh Tripathy in the Mac-In-Fac for teaching me how to use the microcalorimeter and for assistance with DSC experiments.
training (and a lot of patience) I received from Christopher Barnes, a co-author on the material found in Chapter 2. Much of my sanity and creative thinking came from useful conversations (some in the lab, others at 106A Graham St.) with Austin Smith, Rachel Cohen, Annelise Gorensek and Drs. Andrew Miklos, Mohona Sarkar and Jillian Tyrrell.
TABLE OF CONTENTS
LIST OF FIGURES ... xiii
LIST OF TABLES ...xv
LIST OF ABBREVIATIONS AND SYMBOLS ... xvi
CHAPTER 1: PROTEIN STABILITY – HISTORICAL PERSPECTIVES AND A LOOK AHEAD ... 18
1.1 Introduction ... 18
1.2 Conformational protein stability ... 20
1.3 Measurement of Keq ... 21
1.4 Calorimetric measurement of ∆G°' ... 23
1.5 Macromolecular crowding and protein stability ... 24
1.6 Protein stability in cells... 25
1.7 Summary ... 26
1.8 Figures ... 28
CHAPTER 2: DIFFERENTIAL ROTATIONAL DYNAMICS OF GLOBULAR PROTEINS IN CELLS ... 32
2.1 Introduction ... 32
2.2 Results ... 33
2.2.1 Production of the ubiquitin--synuclein fusion construct ... 33
2.2.2 In-cell NMR ... 33
2.4 Summary ... 35
2.5 Materials and methods... 36
2.5.1 Production of the fusion construct ... 36
2.5.2 Protein expression and in-cell NMR ... 37
2.6 Figures ... 39
CHAPTER 3: RESIDUE LEVEL QUANTIFICATION OF PROTEIN STABILITY IN LIVING CELLS ... 43
3.1 Introduction ... 43
3.1.1 NMR-detected backbone amide H/D exchange ... 44
3.2 Results ... 46
3.2.1 Exchange in cells ... 46
3.2.2 Exchange in dilute solution ... 48
3.2.3 In vitro crowding by BSA and lysozyme ... 49
3.2.4 Exchange with the I6L variant ... 49
3.2.5 Calorimetry ... 50
3.3 Discussion ... 50
3.3.1 Exchange mechanism in buffer ... 52
3.3.2 Exchange mechanism in cells ... 52
3.3.3 GB1 structure in cells ... 54
3.3.4 Cellular environment and GB1 stability ... 55
3.3.5 Effect of protein crowders in vitro ... 55
3.3.6 Contributions to protein stability in cells ... 57
3.4.1 Vector ... 57
3.4.2 In-cell H/D exchange: growth, protein expression and initiation ... 58
3.4.3 In-cell H/D exchange: quenched cell lysates and NMR spectroscopy ... 59
3.4.4 Protein purification for dilute solution and in vitro crowding studies ... 61
3.4.5 Mock in-cell H/D exchange... 62
3.4.6 Conventional in vitro H/D exchange in buffer ... 63
3.4.7 Conventional in vitro H/D exchange under crowded conditions ... 63
3.4.8 Differential scanning calorimetry (DSC) ... 64
3.4.9 E. coli viability ... 65
3.5 Figures ... 66
3.6 Tables ... 78
CHAPTER 4: QUINARY STRUCTURE MODULATES PROTEIN STABILITY IN CELLS ... 85
4.1 Significance ... 85
4.2 Introduction ... 86
4.3 Results ... 88
4.4 Discussion ... 90
4.5 Conclusions ... 91
4.6 Materials and methods... 92
4.6.1 Vector ... 92
4.6.2 Protein purification ... 92
4.6.3 In-cell H/D exchange ... 93
4.6.5 DSC ... 93
4.7 Figures ... 94
4.8 Tables ... 101
LIST OF FIGURES
Figure 1.1 Folding landscape for a globular protein ... 28
Figure 1.2 Determination of Keq and ∆G°' from co-solute or thermal denaturation experiments ... 29
Figure 1.3 Backbone amide H/D exchange decay profile ... 30
Figure 1.4 Thermogram and protein stability curve obtained from DSC experiments ... 30
Figure 1.5 Cross-sectional illustration of the Escherichia coli interior ... 31
Figure 2.1 Cartoon representation of the UBQ-SN fusion protein ... 39
Figure 2.2 1H – 15N HSQC spectra of UBQ-SN in cells and in cell lysate ... 39
Figure 2.3 Overlaid HSQC spectra of cell lysates containing UBQ-SN, -synuclein and His6-ubiquitin. ... 40
Figure 2.4 SDS-PAGE of the UBQ-αSN fusion protein, wildtype -synuclein and purified H6-ubiquitin ... 41
Figure 2.5 1H – 15N HSQC spectrum of supernatant acquired immediately after acquiring the in-cell UBQ-SN spectrum ... 42
Figure 3.1 In-cell H/D exchange protocol ... 66
Figure 3.2 Overlaid 1H – 15N HSQC spectra of GB1 in initial and final quenched cell lysates ... 67
Figure 3.3 GB1 backbone amide H/D decay profiles in cells and buffer ... 68
Figure 3.4 ∆∆Gop°' values of GB1 caused by crowding in cells ... 69
Figure 3.5 Structure of GB1 colored by magnitude of in-cell stabilization ... 70
Figure 3.6 ∆Gop°' values of GB1 in cells, buffer, and BSA ... 71
Figure 3.7 ∆∆Gop°' values of GB1 caused by the I6L mutation in cells and buffer ... 72
Figure 3.9 ∆Gop°' values of GB1 in cells and buffer ... 74
Figure 3.10 Thermodynamic cycle for wt and I6L GB1 ... 75
Figure 3.11 E. coli viability over 24 hours ... 76
Figure 3.12 Dilute solution EX2 control ... 77
Figure 4.1 Thermodynamic cycle for wt GB1 and its variants ... 94
Figure 4.2 ∆∆Gop°' values due to the I6L and D40K mutations in cells and buffer ... 95
Figure 4.3 ∆∆Gop,int°' values for I6L and D40K GB1 ... 96
Figure 4.4 Structures of GB1 variants colored by ∆∆Gop,int°' ... 97
Figure 4.5 Expanded thermodynamic cycle for GB1 and its variants ... 98
Figure 4.6 Free energy diagrams for wt and D40K GB1 in cells and buffer .... 99
LIST OF TABLES
Table 3.1 GB1 kobs and ∆Gop°' values in cells and buffer ... 78
Table 3.2 GB1 ∆Gop°' comparison in serial and discrete measurements ... 81
Table 3.3 GB1 kobs and ∆Gop°' values in BSA ... 82
Table 3.4 I6L GB1 kobs and ∆Gop°' values in cells and buffer ... 83
Table 3.5 ∆∆Gop°' values due to the I6L mutation in cells and buffer ... 84
Table 4.1 D40K GB1 kobs and ∆Gop°' values in cells and buffer ... 101
Table 4.2 ∆∆Gop°' values due to the D40K mutation in cells and buffer ... 102
LIST OF ABBREVIATIONS AND SYMBOLS
∆Gop°' standard, modified Gibbs free energy of opening
∆∆Gop°' change in standard, modified Gibbs free energy of opening ∆∆Gop,int°' standard, modified interaction Gibbs free energy of opening ∆HvH°' standard, modified van’t Hoff enthalpy of denaturation ∆Hcal°' standard, modified calorimetric enthalpy of denaturation ∆S°' standard, modified entropy of denaturation
°C degree Celcius
micro- (10-6)
x g centrifugal force, times gravity
BSA bovine serum albumin
CI2 chymotrypsin inhibitor 2
DSC differential scanning calorimetry EDTA ethylene diamine tetraacetic acid FPLC fast protein liquid chromatography g gram
GB1 B1 domain of streptococcal protein G h hour
H/D hydrogen/deuterium
HSQC heteronuclear single quantum coherence IPTG isopropyl β-D-1-thiogalactopyranoside
kint intrinsic rate constant of hydrogen-deuterium exchange
kobs observed rate constant of hydrogen-deuterium exchange
kop opening rate constant
Keq equilibrium constant of denaturation
Kop equilibrium constant of backbone amide opening
kcal/mol kilocalories per mole
kDa kilodalton
L liter
LB Luria Bertani medium
M molar
m milli- (10-3)
min minute
NMR nuclear magnetic resonance
OD600 optical density at 600 nanometers
PAGE polyacrylamide gel electrophoresis PBS phosphate buffered saline
pI isoelectric point
s second
SDS sodium dodecyl sulfate
Tm melting temperature
wt wildtype
CHAPTER 1: PROTEIN STABILITY – HISTORICAL PERSPECTIVES AND A LOOK AHEAD
1.1 Introduction
The structure-function paradigm states that the amino acid sequence of a globular protein encodes its singular, minimum-energy and biologically active
conformation. It is clear from Levinthal’s paradox1 and the short timescale of protein folding that biology does not rely on a random search through conformational space for a protein to find its functional form, but rather that the protein folding ‘problem’ (i.e., the inability to predict the three dimensional structure of a native globular
protein from its primary structure alone) should be solvable by invoking the principles of physical chemistry. Knowledge of the specific energetics of folding – namely the driving and opposing forces that result in net stabilization – from primary structure will open the door to innumerable opportunities in enzyme design, biotechnology and the engineering of protein-based therapeutics.
What forces are responsible for controlling this equilibrium? Early theories7,8
suggested a primary role for electrostatic interactions between charged side chains, but this idea was disproven based on inconsistencies in observed ‘electrostricted’ volumes of model compounds.9 Then, following the discovery of the -helix and sheets by Mirsky and Pauling,10 it was widely held that peptide hydrogen bonds dominated. Kauzmann, however, argued that because H-bonds could form in both the folded and unfolded states, these interactions, albeit stabilizing, could not drive folding.11 Instead, he shifted the focus outside of the protein: water. Hydrophobic species were known to have low affinity in aqueous media, because water
molecules form complex, entropically disfavored12 structures that encapsulate the hydrophobe. Kauzmann’s idea of ‘hydrophobic bonding’11 led to a new view, where collapse of hydrophobic side chains into a compact, globular structure minimized the ordering of water molecules. As more definitive evidence against hydrogen bonding surfaced,13,14 evidence for the hydrophobic effect mounted,15-17 solidifying it as the principle mechanism responsible for folding.
Stabilization of the native state occurs by overcoming, primarily, the loss of conformational entropy associated with the unfolded state via hydrophobic collapse, van der Waals forces, coulombic attractions, H-bonding, and disulfide linkages. This remarkable balancing of free energy cannot be understated: the total free energy associated with the folded and unfolded states of small proteins (not including covalent bonds) is hundreds of kcal/mol, whereas most globular proteins are stabilized by only 5 – 15 kcal/mol,18 energetically equivalent to the free energy of
margin of stabilization that defines the functional role of a protein. The following sections focus on some of the the experimental methods used to measure such subtle differences in free energy.1
1.2 Conformational protein stability
Anfinsen’s pioneering work with ribonuclease A, which resulted in his
‘thermodynamic hypothesis’ (and a Nobel Prize), states that the global minimum in free energy is attained in the folded, native state.5 Although it must be appreciated that exceptions have been identified, for instance when folding is kinetically
controlled,20 my dissertation focuses on the wealth of proteins that undergo reversible, two-state folding (i.e., no intermediates are significantly populated at equilibrium) under equilibrium thermodynamic control.
More specifically, the emphasis is on the conformational stability of globular proteins, defined as the difference in standard state Gibbs free energy under
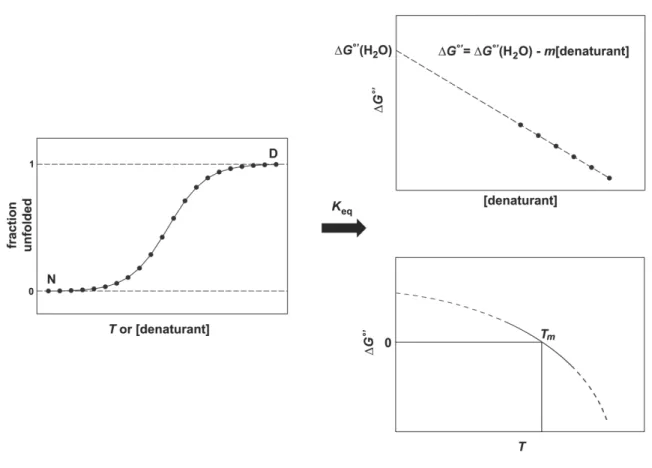
physiological conditions between the native (N), structurally-defined and biologically active folded state and the thermodynamic ensemble of denatured (D), unfolded states (Figure 1.1).
N D [1]
∆G°' GD°' GN°' [2]
1Equilibrium measurements will be emphasized throughout this work; kinetic measurements of
1.3 Measurement of Keq
Protein stability can be measured by determining the relative populations of N and D at equilibrium with a variety of spectroscopic tools.21
∆G°' RTln[D]
[N] RTlnKeq [3]
In terms of population distributions, stabilization by ~7 kcal/mol corresponds to 105 molecules in the native state for every one of the unfolded species at 37 °C. Hence, making stability measurements in vitro under native conditions can be impractical because calculations of Keq are only accurate in the range of 0.1 – 10 using most
techniques. The lone exception, amide exchange, is discussed below. Instead, the equilibrium shown in Eq. 1 is typically perturbed by adding heat or a denaturing co-solute (such as urea or guanidinium chloride) to populate the unfolded state and the response is measured by various spectroscopic methods (e.g., electronic
absorption, circular dichroism, and fluorescence spectroscopies). Tracking the denaturation results in a progress curve with a native and a denatured baseline (left panel, Figure 1.2). Assigning these baselines allows the fractions of the denatured state and native state to be determined as a function of denaturant concentration or T in the steep transition region. In co-solute unfolding experiments, Keq is calculated
using Eq. 3 and the resulting plot of ∆G°' as a function of [denaturant] is then extrapolated to zero denaturant concentration, ∆G°'(H2O).22 For thermal
denaturation, Keq is calculated and a van’t Hoff plot of ln(Keq) versus T-1 yields ∆HvH°' values at temperatures around the Tm of the protein.6 If the change in heat capacity
temperatures beyond the experimentally determined range using the Gibbs-Helmholtz equation (see below).
Stability measurements can also be made under non-perturbing conditions by pairing hydrogen-deuterium (H/D) exchange24,25 with NMR spectroscopy26 or mass spectrometry.27 NMR-detected H/D exchange is the primary method for measuring stability in the Pielak lab and in this dissertation. Since the advent of
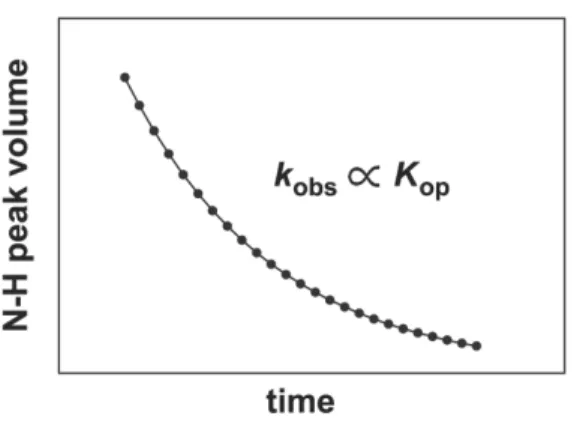
two-dimensional methods in the 1980s,28 stability information can be resolved to the level of individual backbone amide protons. The trade off is the requirement for more protein sample with NMR experiments. In amide H/D exchange, exposure of backbone N-H groups to solvent through local fluctuations of the native state and higher-energy global unfolding events results in irreversible H/D exchange when the protein is resuspended in D2O. With the validity of several assumptions (see Chapter
3), the ratio of the observed rate of N-H peak decay (kobs) to the intrinsic rate of
exchange (kint) obtained from data on unstructured peptides29 defines the equilibrium
constant for the opening (i.e., unfolding) reaction of each N-H group (Figure 1.3).
∆Gop°' RTlnkkobs
int RTlnKop [4]
In this way, an opening free energy (∆Gop°' ) is obtained for each (non-proline)
1.4 Calorimetric measurement of ∆G°'
Differential scanning calorimetry (DSC) directly measures the enthalpy of denaturation and, therefore, can be used with the Gibbs-Helmholtz equation to obtain ∆G°'.
∆G°' ∆H°' T∆S°' [5]
The development of DSC by Privalov16 allowed determination of the excess heat
capacity of the protein as a function of temperature, resulting in two key advances. First, the discovery that ∆Cp on denaturation is nonzero and (nearly) constant16
reaffirmed the role of the hydrophobic effect11 in protein stability. Second, as outlined below, DSC provides the best evidence for two-state behavior.
Knowing that ∆Cp for denaturation is positive and assuming the reaction involves only two thermodynamic states leads to the following form of Eq. 5.23,31
∆G°'(T) ∆Hcal°' 1 T
Tm ∆Cp T Tm Tln T
Tm [6]
∆Hcal°' is the enthalpy change at the midpoint of the melting transition (Tm), where
∆G°' 0 and ∆Sm°' ∆Hcal
°'
Tm . Precise measurement of ∆Cp, Tm and ∆Hcal
°' (Figure 1.4)
allow protein stability curves23 of ∆G°' as a function of T to be calculated.
Denaturation can also be followed in a model-dependent manner by
obtained as described above for spectroscopic measurements. The major
advantage of calorimetric determinations of stability is that the measurement of ∆Hcal°' does not assume a two-state process, which is implicit in the other methods.
Therefore, the best evidence for an equilibrium two-state folding process is when ∆Hcal°' measured calorimetrically matches the model-dependent van’t Hoff ∆HvH°' .
1.5 Macromolecular crowding and protein stability
Traditional biochemistry and biophysics examine the properties of proteins, including stability, in simple buffered solutions far removed from the complex,
crowded native environment within cells (Figure 1.5).32 Initial theories33-35 concerning
the effects of macromolecular crowding on protein stability treated the crowd as inert spheres, giving rise to repulsive interactions between the test protein and myriad macromolecules occupying the cell. Experiments followed that employed synthetic polymers such as dextran, Ficoll, and polyethylene glycols as crowders to mimic the cellular interior.36-39 The results were mostly consistent; crowding stabilized proteins
compared to buffer alone. Furthermore, the mechanism of stabilization seemed clear: hard-core excluded volume effects shift the equilibrium toward the compact, native structure by destabilizing the denatured state ensemble, a purely entropic effect.
to the equilibrium partitioning of molecules in the native and denatured states was realized by studies with more physiologically relevant crowders, such as proteins and reconstituted cytosol.42-45 These ‘soft interactions’46 have been found to modulate the stability in a context dependent fashion, where attractive chemical interactions tend to destabilize test proteins by lowering the free energy of the denatured state ensemble, similar to how urea destabilizes proteins.47 On the other
hand, repulsive interactions are expected to favor the native state and enhance hard-core stabilizing effects.48 Moreover, Minton49 and Zhou50 have independently suggested temperature as an important factor in modulating hard and soft effects. In summary, the net effect of crowding on protein stability will be a combination of steric repulsions and non-specific chemical interactions that depend on the chemical nature of the test protein and crowding species.
1.6 Protein stability in cells
To gain the most physiologically relevant and comprehensive understanding of how macromolecular crowding affects protein stability, quantitative information gleaned from studies performed inside living cells needs to be combined with in-cell molecular dynamics simulations.51 The seminal experiments of Ghaemmaghami and Oas52 on repressor showed that its stability was unchanged in cells relative to buffer alone using H/D exchange and mass spectrometry. Later, Gierasch and workers used a fluorescent tag in cellular retinoic acid-binding protein I to report destabilization in cells.53,54 These experimental results were corroborated in silico only when both hard and soft interactions were taken into consideration.51 More
about in-cell folding and stability with fluorescence imaging of phosphoglycerate kinase and the cell surface protein VIsE.55-58 Their results demonstrate that protein stability can be modulated via cellular compartmentalization, tying together
hypotheses about the strength and type of soft interactions that a protein experiences in a given environment.
However, the in-cell studies above have relied on urea denaturation52-54 or thermal modification55-58 to quantify global stability. Such perturbations are known to trigger stress responses inside cells.59,60 Chapter 3 describes the first residue-level measurement of protein stability under non-perturbing conditions using native state H/D exchange and NMR spectroscopy.48 I found that the B1 domain of protein G (GB1) is stabilized in cells, which is attributed to repulsive soft interactions. I augment these results (Chapter 4) by reporting the first quantification of soft interactions between the cytoplasm of E. coli and a variant of GB1.
1.7 Summary
The more details we amass from experiments performed in cells, the closer we approach a fundamental knowledge of protein chemistry in the cellular
environment. Because the functional role of proteins is defined by the equilibrium between the structural native state and the denatured state ensemble, this endeavor starts with understanding the forces stabilizing proteins in cells. In addition to
environment hinders in-cell biophysical measurements. For example, calorimetry will never be able to distinguish the enthalpy of unfolding of a test protein in a sea of macromolecules and is therefore limited to purified protein samples in buffer or in simple, unphysiological, crowded conditions. In this vein, the purpose of Chapter 2 is to illustrate the problems associated with making quantitative protein stability
measurements using traditional H/D experiments and in-cell NMR.61 The remainder
1.8 Figures
Figure 1.1 Folding landscape for a globular protein.62 The presence of intermediates and molten-globule states can make the landscape rugged, as depicted. Species in these kinetic traps are not significantly populated for proteins adhering to two-state equilibrium unfolding.
Figure 1.2 Determination of Keq and ∆G°' from co-solute (upper right panel) or
thermal (lower right panel) denaturation experiments. The progress curve in the left panel relies on the assumption of a two-state folding model to track Keq. The slope of
Figure 1.3 Backbone amide H/D exchange rates can provide residue-level information on protein stability without the use of heat or co-solute perturbation.
Figure 1.5 Cross-sectional illustration of the Escherichia coli interior. The cell wall is shown in green. The cytoplasmic area is colored blue and purple. The large purple molecules are ribosomes and the small, maroon molecules and white strands are tRNA and mRNA, respectively. Enzymes are blue. The nucleoid region containing DNA and DNA polymerases is in yellow and orange.Illustration used with
CHAPTER 2: DIFFERENTIAL ROTATIONAL DYNAMICS OF GLOBULAR PROTEINS IN CELLS1
2.1 Introduction
In-cell nuclear magnetic resonance spectroscopy63 utilizing the 1H – 15N heteronuclear single quantum coherence (HSQC) experiment yields high quality spectra when applied to intrinsically disordered proteins in Escherichia coli. For globular proteins, however, protein signals from inside the cell are not observed.64,65 Here, we show in a simple and direct way that protein dynamics determines the quality of the in-cell 1H – 15N HSQC spectrum by fusing the globular protein, ubiquitin, to the disordered protein, -synuclein.
Most knowledge about protein structure and dynamics is gleaned from dilute solution experiments. The native intracellular environment of proteins, where
macromolecular concentrations may exceed 300 g/L,32 presents a different set of
conditions. Furthermore, it is known that crowding can impact protein stability and dynamics.66,67
The 1H – 15N HSQC experiment68 is commonly used to characterize proteins in dilute solution. However, the ability to obtain high resolution spectra from
overexpressed 15N-enriched proteins in cells yields mixed results. Disordered
1 The material in this chapter was published in ChemBioChem. The original citation is as follows:
Barnes CO, Monteith WB, Pielak GJ (2011) Internal and global protein motion assessed with a fusion construct and in-cell NMR spectroscopy. ChemBioChem 12:390-391. WB Monteith and GJ Pielak wrote the paper, and permission was received from CO Barnes to include the work in this
proteins, such as -synuclein64 and FlgM,69 exhibit high quality spectra inside cells. Most globular proteins, on the other hand, fail to produce useful in-cell spectra.64,65
Here, we present in a single experiment compelling evidence that this difference in detectability is caused by their different rotational dynamics.
2.2 Results
2.2.1 Production of the ubiquitin--synuclein fusion construct
We produced a histidine-tagged fusion protein from the globular protein, ubiquitin, and the disordered protein, -synuclein (Figure 2.1). Ligation independent cloning70 resulted in a structural gene comprising a N-terminal six-histidine (H6)
segment and a short disordered linker followed by the UBQ-SN sequence. The composition of the intra protein linker was chosen to ensure flexibility between the constituent proteins.
The fusion protein was visualized by using SDS-PAGE after 1.5 h of
expression in E. coli (Figure 2.4). Its apparent molecular weight (29 kDa) is the sum of the apparent molecular weights of purified H6-ubiquitin (9.5 kDa) and wildtype
-synuclein (19 kDa), proving that the fusion protein is intact in cells [-synuclein (calculated MW, 14 kDa) migrates abnormally slowly].71
2.2.2 In-cell NMR
ubiquitin,65 which span a large chemical shift range owing to a well defined structure,
are absent. No protein spectrum is observed in the supernatant of the cell sample (Figure 2.5), indicating that the fusion protein does not leak from cells during the experiment. This finding is consistent with work showing that leakage does not occur for either protein.65
Upon lysing the cells, we observe not only -synuclein crosspeaks, but also crosspeaks corresponding to the ubiquitin portion of the fusion protein (Figure 2.2B). To confirm the ubiquitin signals, 1H – 15N HSQC spectra of cell lysates from H6
-ubiquitin and -synuclein expressing cells were overlaid with the UBQ-SN cell lysate spectrum (Figure 2.3). The contour levels in Figure 2.3 were chosen for clarity. Detailed analysis confirms that each H6-ubiquitin and -synuclein crosspeak
overlaps with a crosspeak from the fusion protein. This overlap, together with the results shown in Figure 2.2, provide unequivocal evidence that the in-cell spectrum is from the C-terminal portion of the fusion protein, which corresponds to
-synuclein, and that the N-terminal ubiquitin is only observed in the cell lysate.
2.3 Discussion
The ability to obtain high resolution NMR spectra depends on the rotational diffusion of the target protein. As rotational correlation times increase, peak
broadening prevents detection. Inside cells, however, the effects of crowding
Our data on the fusion protein provides a simple and direct example of the impact of differential rotational dynamics on the ability to detect proteins via in-cell
1H – 15N-based NMR experiments. The intrinsically disordered portion from
-synuclein, with its ensemble of interconverting dihedral angle combinations,
possesses sufficient internal motion even under the crowded conditions in the cell. Put another way, the transverse relaxation is slow enough to yield a high resolution
1H – 15N HSQC spectrum. Conversely, the rotational motion of the N-terminal
ubiquitin portion is dominated by slower, global tumbling that is made even slower in cells. We have confirmed this result in vitro with proteins as crowding agents.73 The crowding in these environments causes the nuclei to relax quickly, broadening the crosspeaks beyond detection. Only when the cells are lysed and the lysate diluted are the effects mitigated, providing the globular portion with enough rotational freedom for its spectrum to be observed.
Localization studies indicate that the concentration of the fusion protein is nearly equal in the cytoplasm and periplasm (data not shown). Thus any differences between the crowding conditions of the cytoplasm and periplasm are not large enough to dramatically impact the rotational dynamics in either location.
2.4 Summary
proteins in cells can be obtained by using 19F NMR,65 acquiring useful 15N spectra
remains a significant challenge.
2.5 Materials and methods
2.5.1 Production of the fusion construct
The genes encoding human ubiquitin and human -synuclein were amplified by using the polymerase chain reaction. The ~230 bp fragment for ubiquitin was amplified with a mixture of the following primers: Forward 1 – 5’ GAC GAC GAC AAG ATG GCA ATC TTC GTC AAG ACG 3’, Forward 2 – 5’ GAC GAC GAC AAG ATG GCA ATC TTC GTC AAG ACG TTA ACC GG 3’, Reverse – 5’ CAT CTT GTC GTC GTC GCA ACC ACC TCT TAG TCT TAA GAC 3’, with the reverse primer encoding a mutation (underlined) that changes ubiquitin’s stop codon to a cysteine. The ~430 bp -synuclein gene was amplified with a mixture of the following primers: Forward – 5’ GAC GAC GAC AAG ATG GAT GTA TTC ATG AAA GGA 3’, Reverse 1 – 5’ TGA GGA GAA GCC CGG TTA CGC CTC AGG TTC GTA GTC 3’, Reverse 2 – 5’ TGA GGA GAA GCC CGG TTA GGC CTC AGG TTC GTA GTC 3’. PCR
products were treated with 1 L of 20 U/L DPN I (Biolabs) for 1 h at 37 °C. The PCR product was purified on a spin column (SpinPrepTM PCR Clean-Up Kit, Qiagen).
Compatible overhangs were created by treating the purified PCR product with T4 DNA Polymerase as described in the protocol for the Ek/LIC Cloning Kit
final concentration of 7 mM, and the solution incubated at 22 °C for an additional 5 min. The pET-46 Ek/LIC vector was annealed to the product from the previous step as described in the protocol for the Ek/LIC Cloning Kit (Novagen). The annealing reaction was transformed into NovaBlue GigaSinglesTM Competent Cells (Novagen) and XL21 Supercompetent Cells (Stratagene). The samples were plated against 0.1 mg/mL ampicillin before incubating overnight at 37 °C. The sequences of the purified DNA from multiple colonies were determined at the UNC-CH Genome Analysis Facility. DNA encoding the fusion protein was subjected to site-directed mutagenesis to change the cysteine residue at the end of ubiquitin to a glycine (underlined) with the following primers: 5’ AGA CTA AGA GGT GGT GGC GAC GAC GAC AAG 3’, along with its reverse complement: 5’ CTT GTC GTC GTC GCC ACC ACC TCT TAG TCT 3’. Products were treated with 1 L of 20 U/L DPN I for 1 h at 37 °C before being transformed into competentDH5 cells (Invitrogen). The sequence of the desired construct, called UBQ-SN, was confirmed.
2.5.2 Protein expression and in-cell NMR
Plasmids containing the UBQ-SN gene were transformed into BL21 (DE3) Gold cells (Stratagene) and selected with ampicillin (0.1 mg/mL). Cells were grown and subjected to NMR experiments as described by Li et al.,65 after 1.5 h of
2.6 Figures
Figure 2.1 Cartoon representation of the UBQ-SN fusion protein.
Figure 2.2 A) In-cell, 1H – 15N HSQC spectrum of E. coli expressing UBQ-SN after
Figure 2.3 Overlaid spectra of UBQ-SN, -synuclein, and His6-ubiquitin cell lysates
Figure 2.4 SDS-PAGE of (A) molecular weight markers, (B) E. coli lysate from cells expressing the UBQ-αSN fusion protein prior to induction, (C) 12 L of 1 g/mL purified wildtype -synuclein, (D) 12 L of 1 g/mL purified H6-ubiquitin, and (E) E.
coli culture from (B) 1.5 h after induction with 1 mM IPTG. Arrows indicate H6
CHAPTER 3: RESIDUE LEVEL QUANTIFICATION OF PROTEIN STABILITY IN LIVING CELLS1
3.1 Introduction
Proteins function in a heterogeneous and crowded intracellular environment. Macromolecules comprise 20 – 30% of the volume of an Escherichia coli cell and reach concentrations of 300 – 400 g/L.32,77 Theory predicts that the properties of proteins and nucleic acids can be significantly altered in cells compared to buffer alone.78,79 Nevertheless, most biochemical and biophysical studies are conducted under dilute (<10 g/L macromolecules) conditions. Here, we augment the small but growing list of reports probing the equilibrium thermodynamic stability of proteins in living cells,52,54-56,58 and provide the first measurement of residue-level stability under non-perturbing conditions.
Until recently, the effects of macromolecular crowding on protein stability were thought to be caused solely by hard-core, steric repulsions arising from the impenetrability of matter.33,36,79 The expectation was that crowding enhances stability by favoring the compact native state over the ensemble of denatured states.
Increased attention to transient, non-specific protein-protein interactions41,80-82 has
1 The material in this chapter has been accepted for publication in PNAS. The original citation is as
led both experimentalists46,49,83,84 and theoreticians43,51,85 to recognize the effects of
chemical interactions between crowder and test protein when assessing the net effect of macromolecular crowding. These weak, non-specific interactions can reinforce or oppose the effect of hard-core repulsions, resulting in increased or decreased stability depending on the chemical nature of the test protein and crowder.42,44,45,86
We chose the B1 domain of streptococcal protein G87 as our test protein because its structure, stability and folding kinetics have been extensively studied in dilute solution.88-98 Its small size (56 amino acids; 6.2 kDa) and high thermal stability make GB1 well suited for studies by NMR spectroscopy.
3.1.1 NMR-detected backbone amide H/D exchange
Quantifying the equilibrium thermodynamic stability of proteins relies on determining the relative populations of native and denatured states. Because the denatured state ensemble of a stable protein is sparsely populated under native conditions, stability is usually probed by adding heat or a co-solute to promote unfolding so that the concentration ratio of the two states can be determined.99 However, stability can be measured without these perturbations by exploiting the phenomenon of backbone amide H/D exchange24 detected by NMR spectroscopy.100 The observed rate of amide proton (N-H) exchange, kobs, is related to equilibrium
kop
kcl
kint
kop
kcl
closed (N-H) open (N-H) open (N-D) closed (N-D) [1]
Each position opens and closes with rate constants, kop and kcl (where Kop = kop/kcl),
and exchange from the open state occurs with intrinsic rate constant, kint. Values for
kint are based on exchange data from unstructured peptides.29,101 If the test protein is
stable (i.e.,kcl >> kop), the observed rate becomes:
[2]
Exchange occurs within two limits.25 At the EX1 limit, closing is rate determining, and kobs = kop. This limit is usually observed for less stable proteins and at basic pH.102
Most globular proteins undergo EX2 kinetics, where exchange from the open state is rate limiting (i.e.,kcl >> kint), and kobs values can be converted to equilibrium opening
free energies, ∆Gop°' :26
[3,4]
The backbone amides most strongly involved in H-bonded regions of secondary structure exchange only from the fully unfolded state, yielding a maximum value of ∆Gop°' .30,103,104 For these residues ∆Gop°' approximates the free energy of denaturation, ∆Gden°' , providing information on global stability. Lower amplitude fluctuations of the native state can give rise to partially unfolded forms,105 resulting in residues with ∆Gop°' values less than those of the global unfolders.
int cl int op obs + = k k k k k int op int cl op
obs = k =K k
k k k int obs °'
op =- ln
k k RT G
In summary, NMR-detected H/D exchange can measure equilibrium thermodynamic stability of a protein at the level of individual amino acid residues under non-perturbing conditions. Inomata et al.106 employed this technique to measure kobs values in human cells for four residues in ubiquitin, but experiments
confirming the exchange mechanism were not reported and opening free energies were not quantified. Our results fill this void and provide quantitative residue-level protein stability measurements in living cells under non-perturbing conditions.
3.2 Results
3.2.1 Exchange in cells
We attempted to measure GB1 stability directly in cells by pairing H/D exchange with in-cell NMR107 and conventional serial 15N-1H HSQC analysis,108
because GB1 is one of the few proteins that gives reasonable spectra in E.
coli.80,81,109,110 The signal-to-noise ratios of the spectra, however, were insufficient for quantification. We overcame this problem by modifying the approach of
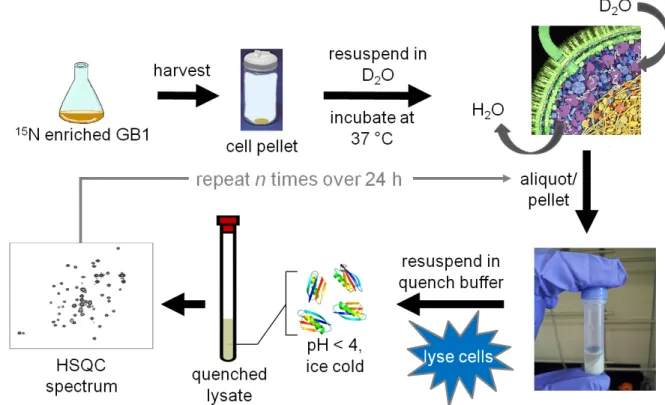
Ghaemmaghami and Oas52 for measuring stability in ‘discrete’, quenched cell lysates(Figure 3.1 and Section 3.4.3). Briefly, the cells are transferred and washed into D2O, where they remain viable for the course of the experiment (Figure 3.11).
An aliquot of cell slurry is removed at defined times, the cells are lysed, exchange is quenched and the lysate is analyzed by NMR. The dead time is ~1 h.
(Figure 3.2). Profiles for representative residues are shown in Figure 3.3. Values of kobs are tabulated in Table 3.1.
The decay of the T18 cross peak illustrates the upper limit for measuring exchange. Quantification of kobs for T18 required a lower contour level and fitting to
fewer times than the 17 more slowly exchanging residues. At contour levels lower than those shown in Figure 3.2, resonances from six additional residues (K10, A20, A24, T25, Q32, N35) are detectable in the spectrum from the initial time point, but decay is too rapid to obtain kobs. Rates for these residues are listed as >kobs,T18.
Crosspeaks from 24 backbone amides do not appear to exchange. We conclude that these residues are ‘quench-labeled’. That is, they are least protected from solvent and, therefore, are labeled with protons immediately prior to quenching, when the proton concentration increases 104-fold. This conclusion arises from two considerations.First, the side chain amides, which are solvent exposed, behave similarly. Second, as discussed below, quench-labeling is not observed in the serially-acquired (i.e., no quench step) dilute solution data. Exchange rates for quench-labeled residues are also listed as >kobs,T18, even though their rates are
probably even larger than those for the six residues described above. We attempted to assign the remaining residues, but the lysate was not stable enough for
acquisition of three-dimensional NMR data.
In summary, 48 of the 56 residues provide information on exchange. For the 17 slowly exchanging residues, kobs values were converted to free energies of
included because its rate in cells was obtained from limited data. Elevated rates of intrinsic exchange (10 – 100 s-1) under our conditions (pHcorr 7.6, 37 °C) prevented
quantification of 30 residues. Based on our results for T18, we conclude that the kobs
values for these 30 residues are >7×10⁻⁴ s-1 in cells and >3×10⁻⁴ s-1 in buffer (see below).
3.2.2 Exchange in dilute solution
To compare the in-cell rates to those acquired in dilute solution (pHcorr7.6, 37
°C), we mimicked the discrete sampling method (Figure 3.1) using purified GB1 instead of the GB1-containing lysate (Section 3.4.5). The exchange behavior is similar under both conditions; i.e., the same residues exchange slowly, the same residues exchange too rapidly to quantify, and the same quench-labeling is observed. However, quantifying the exchange of T18 was possible because the dead time is <5 min, compared to ~1 h for the in-cell studies (Figure 3.3). Similar to the in-cell data, T18 is the fastest exchanging quantifiable residue. The kobs values
are tabulated in Table 3.1, and the concomitant ∆Gop,buff°' values were used to calculate the changes in stability (Figures 3.4 and 3.5, Table 3.1) caused by crowding in cells (∆∆Gop,cell°' = ∆Gop,cell°' – ∆Gop,buff°' ).
studies. These data also show that lyophilization of GB1 does not affect our results. In addition, the 24 residues that do not appear to exchange in the discrete,
quenched measurements are completely exchanged by the initial time point in the serial measurements, consistent with our conclusion about quench labeling.
3.2.3 In vitro crowding by BSA and lysozyme
To assess the effect of individual protein crowders42,111 on GB1 stability, we acquired exchange data in 100 g/L solutions of either bovine serum albumin (BSA) or lysozyme (Section 3.4.7). Of the 17 common GB1 residues quantified in cells and in buffer, 13 yielded measurable rates in BSA; the others exchanged too quickly (Table 3.3). The corresponding opening free energies, ∆Gop,BSA°' , were compared to those obtained in buffer and in cells (Figure 3.6). BSA destabilizes GB1 compared to dilute solution, whereas the protein is stabilized in cells. In lysozyme, exchange rates are so large that the backbone N-H signals have completely decayed by the first acquisition (~20 min). We conclude that lysozyme destabilizes GB1 by >1 kcal/mol compared to buffer alone.
3.2.4 Exchange with the I6L variant
Recently, we used a thermodynamic cycle comprising kobs measurements of
residues in chymotrypsin inhibitor 2 and a variant, in buffer and in reconstituted cytosol, to confirm the EX2 mechanism.45 We repeated this strategy with the
(∆∆Gop,cell,I6L°' = ∆Gop,cell,I6L°' – ∆Gop,buff,I6L°' ). Second, we calculated the change caused by the mutation (∆∆Gop°' ,mut = ∆Gop,I6L°' – ∆Gop,wt°' ) in cells. Third, we calculated the effect of the mutation in dilute solution (Figures 3.7 and 3.10). We use these data to assess the thermodynamic cycle in the Discussion.
3.2.5 Calorimetry
We used differential scanning calorimetry to quantify the free energy of denaturation, ∆Gden°' (Section 3.4.8). Due to the high thermal stability of the wild-type protein (Tm = 79.0 °C at pHcorr 7.6), it is difficult to obtain adequate post-transitional
baselines for robust fitting while maintaining reversibility.113 To solve this problem, we used the calorimetric enthalpy, ∆Hcal°' , of the destabilized I6L variant and the Tm
values of the two proteins to calculate ∆∆Gden,mut°' with the equation, ∆∆Gden,mut°' ∆Hcal°' (Tm,I6L – Tm,wt)/Tm,I6L.23 The value of ∆∆Gden,mut°' (-0.68 ±0.06 kcal/mol) is consistent with the average ∆∆Gop,mut°' (-0.8 ±0.1 kcal/mol) from dilute solution H/D exchange experiments.
3.3 Discussion
F30 and V54, are unassigned). We obtained kobs values under all four conditions (wt
protein and I6L variant in buffer and in cells) for the 12 underlined residues.
To interpret the effect of the intracellular environment, we must first determine the meaning of the opening free energies. If they arise from globally exchanging residues, then we expect constant values of ∆Gop°' and ∆∆Gop,cell°' across the primary structure (Figures 3.4 and 3.9). Although there is deviation, the range is <1 kcal/mol. For this reason we remain cautious about over interpreting these deviations because data from 20 proteins114 show that global unfolders yield ∆G
op
°' values within 1
kcal/mol of ∆Gden°' obtained from thermal or co-solute denaturation. In addition, if some residues exchange by local unfolding and others by global unfolding we might expect a correlation between ∆Gop°' and ∆∆Gop°' ,cell, but this is not the case. In
summary, we believe these residues exchange through global unfolding or high energy fluctuations that are energetically indistinguishable from global unfolding under physiological conditions. With this caveat in mind, we suggest two additional sources of deviation. First, although most evidence points to equilibrium two-state folding of GB1,96-98 there is evidence of complex kinetic pathways, so we cannot rule out the possibility that intermediates may be populated at equilibrium in cells or in buffer. Second, despite our knowledge that kint values do not change under crowded
3.3.1 Exchange mechanism in buffer
As stated in the Introduction, to convert kobs values to ∆Gop°' values, the test protein must be stable (i.e.,kcl >> kop) and kint must be rate determining (the EX2
limit). GB1 is highly stable in dilute solution,88,89 and intrinsic exchange rates in
buffer are known.29,101 Proof that intrinsic exchange is rate determining for GB1 in buffer comes from two sources. First, stopped-flow measurements provide a lower limit of ~103 s-1for kcl,90 whereas kint values are <102 s-1. In addition, H/D
measurements at two pH values can be used to assess the exchange mechanism, because intrinsic exchange is base catalyzed above pH 4.116 Specifically, if k
int is
rate determining, changing the pH by one unit should change kobs by a factor of 10.
Consistent with this idea, a plot of log kobs versus log kobs for GB1 residues in buffer
at pH 7.6 and 6.7 (Figure 3.12) has a slope of 0.9 ±0.1 and an intercept (-1.1 ±0.3) equal to the difference in pH. Lastly, because our exchange experiments yield data for residues involved in global unfolding, the ∆Gop°' values should approximate ∆Gden°' from calorimetry. This approximation holds for both wt GB1 and the I6L variant (Section 3.4.8).
3.3.2 Exchange mechanism in cells
The fact that the 15N-1H HSQC spectrum of GB1 can be overlaid with the spectrum in buffer80 indicates the protein is stable in cells. Further, kint values do not
change significantly in reconstituted cytosol compared to buffer.115 Unfortunately, we cannot test the requirement that kint is rate determining by changing the pH because
the thermodynamic cycle,45 mentioned in Results (Figure 3.10). Briefly, if k
int is rate
determining in cells, the change in ∆Gop°' caused by a mutation (∆∆Gop°' ,mut) should be the same in buffer and cells (Figure 3.7). Of the 12 comparable residues, three (K4, T51, T53) of the ∆∆Gop°' ,mut values agree within one standard deviation of the mean, and another three (Y3, A26, A34) within two standard deviations. The remaining six residues (K28, V29, K31, T44, D46, F52) differ by more than two standard
deviations. We were puzzled that not all the residues satisfied the condition ∆∆Gop°' ,mut,buff ≈∆∆Gop°' ,mut,cell, because, as discussed above, all 12 residues are exposed only on global unfolding and possess similar protection factors. We hypothesize that the exceptions arise because the thermodynamic cycle neglects the possibility that mutations introduce new interactions (with respect to wild-type) between GB1 and the cytoplasm that are absent in buffer. We provide additional support for this hypothesis in Chapter 4.
To provide further, albeit indirect, evidence that we are measuring free energies, we estimated the effect the intracellular environment would need to impose on GB1 to move exchange to the EX1 limit (kobs ≈kop). Using a kcl of 103 s-1
from Alexander et al.90 and the average value of -RTln kobs
kint for the 17 residues
quantified in cells, the cytoplasm would have to decrease kop 102 – 103-fold and
decrease kcl by an order of magnitude compared to dilute solution to force exchange
into the regime where kcl is rate determining. Such drastic effects are unlikely and
3.3.3 GB1 structure in cells
Although the folding kinetics54-57,106 and equilibrium thermodynamic stability52,54-56,58 of globular proteins can be influenced by crowding, their tertiary structures should remain unchanged106,109,117 because the packing densities of globular proteins approximate those for ideal packing of hard spheres.17 As discussed above, the ability to overlay the in-cell spectrum with that from dilute solution is consistent with this expectation.
Furthermore, the exchange data show similar patterns along the primary structure in both cells and buffer, supporting the conclusion that the tertiary structure is unchanged. More specifically, the pattern of solvent accessible surface area (SASA) along the sequence has an approximate inverse relationship with ∆∆Gop°' (Figure 3.4). The average SASA for the 17 residues with quantifiable exchange rates (excluding T18), the seven residues that decay too quickly, and the 24 quench-labeled residues are 0.6 ±0.3 Å2, 1.3 ±0.9 Å2, and 2 ±1 Å2, respectively, where the
uncertainties are the sample standard deviations. Hence, the quench-labeled and rapidly exchanging residues are more likely to have larger solvent exposure. These exposed backbone amide nitrogen atoms are found in loops, the outer strands of the four-stranded sheet (2 and 3), and the ends of the helix. The observations about SASA are consistent with dilute solution studies of GB1 structure,88,92 dynamics91 and H/D exchange.93 We conclude that the cellular interior does not change the
3.3.4 Cellular environment and GB1 stability
The cytoplasm of E. coli stabilizes GB1 residues by 0.43 ±0.06 to 1.14 ±0.05 kcal/mol compared to buffer at the same pH and temperature (Figures 3.4 and 3.5). Recent advances in both the experimental and theoretical aspects of
macromolecular crowding allow this stabilization to be rationalized in terms of the properties of GB1 and the E. coli cytoplasm.
The net effect of macromolecular crowding arises from the relative effects of hard-core repulsions, which are always stabilizing, and chemical interactions, which may be stabilizing or destabilizing.46,86 GB1 has a pI of 4.8, similar to that of the majority of E. coli proteins,118 and a net charge of -4 at pH 7.6. These properties are expected to result in a large number of charge-charge repulsions in cells. Indeed, it has been suggested that these repulsions are what allow GB1 to tumble freely in the cell and yield high quality in-cell 15N-1H HSQC spectra.80,81,109,110,119,120 These soft repulsive interactions enhance the volume excluded by hard interactions in cells, thus favoring the compact native state and resulting in the observed stabilization. Our results, together with those from others52,53,55,56,58 show that protein stability in cells can be increased, decreased, or unaffected compared to buffer alone,
demonstrating that physiologically-relevant crowding effects are context dependent, with the type and strength of quinary interactions41 playing a key role.
3.3.5 Effect of protein crowders in vitro
such an extent in 100 g/L lysozyme that quantification was not possible. This destabilization can be understood by the prevalence of weak, attractive interactions between positively charged lysozyme (pI = 11.3) and anionic GB1. The attractive interactions are destabilizing because the unfolded state possesses more reactive surface than the folded state, lowering the free energy of the denatured state ensemble relative to the native state.
A similar explanation for destabilization by BSA is less straightforward. Based on our rationale for in-cell stabilization, we expected stabilization of GB1 in 100 g/L BSA (pI = 4.7) compared to buffer alone because both GB1 and BSA have anionic surfaces. However, this destabilization is in agreement with our
observations42,45,111,121 for chymotrypsin inhibitor 2 (CI2, pI = 6.0), supporting the hypothesis that non-specific, attractive backbone interactions can overcome charge-charge effects and hard-core repulsions. Moreover, the fact that cells are not
crowded with only one protein complicates such simplistic comparisons.
Nevertheless, the effect of BSA and other protein crowders can be rationalized via Zhou’s realization that despite the presence of stabilizing, repulsive soft interactions between a test protein and a crowder, there exists a temperature above which
3.3.6 Contributions to protein stability in cells
Recent work has shown that the effects of macromolecular crowding on globular protein stability depend on the nature of the crowder.44,45,51,121 Synthetic polymers tend to act as inert spheres and are stabilizing. Physiologically relevant crowders (e.g. proteins, cytoplasm) modulate the hard-core effect through soft chemical interactions: attractive forces between the crowder and test protein favor destabilization, and repulsive interactions enhance stability. However, this idea may be too simple, as indicated by our observation on the effect of BSA and the
temperature dependence of crowding discussed by Zhou.50 Another complication is
the role the cell has in modulating stability via compartmentalization, as highlighted by the Gruebele group.56,58 While the present study enriches our knowledge of the forces stabilizing proteins under native conditions, more studies are necessary to bring a comprehensive understanding of the effects of cellular crowding on protein stability.
3.4 Materials and methods
Unless otherwise stated, pH readings are uncorrected for the deuterium isotope effect.122 Intrinsic rate constants from the online program SPHERE101 were calculated for exchange at 37 °C and pH 7.2. Experiments were performed in triplicate. Uncertainties are the standard deviation of the mean.
3.4.1 Vector
deamidation,94 and we refer to this form as wild-type (wt). The I6L variant was
produced by site-directed mutagenesis (QuikChange; Agilent) with the following primers: forward 5’ CAT ATG CAG TAC AAG CTT CTG CTG AAC GGT AAA ACC C 3’, reverse 5’ G GGT TTT ACC GTT CAG CAG AAG CTT GTA CTG CAT ATG 3’, where the isoleucine to leucine mutation is underlined. The DNA sequence of coding region was confirmed by chain termination sequencing123 at Eton Bioscience, Inc.
3.4.2 In-cell H/D exchange: growth, protein expression and initiation
The plasmid encoding GB1 was transformed into competent BL21 (DE3) Escherichia coli cells and spread onto Luria Broth agar plates containing 100 g/mL ampicillin, followed by incubation overnight at 37 °C. A single colony was used to inoculate a 50 mL overnight culture in M9 minimal medium (50 mM Na2HPO4, 20
mM KH2PO4, 9 mM NaCl, 5 g/L 15NH4Cl as the sole nitrogen source and
supplemented with 4 g/L glucose, 2 mM MgSO4, 10 mg/L thiamine HCl, 10 mg/L
biotin, 100 M CaCl2, and 100 g/mL ampicillin). This culture was incubated
overnight with shaking (New Brunswick Scientific) at 37 °C and 225 rpm. The next morning, the 50 mL culture was poured into 950 mL of supplemented M9. This 1 L culture was grown with shaking at 37 °C until the optical density at 600 nm reached 0.6. Protein expression was then induced with 1 mM isopropyl-
-D-thiogalactopyranoside (IPTG). After 2 h, expression was halted by adding
To ensure exchange into >99% D2O, the medium was carefully decanted and
the cell pellet was resuspended in 200 mL of sodium phosphate buffered saline (PBS; 8.5 mM Na2HPO4, 1.8 mM NaH2PO4, 150 mM NaCl) prepared from 99.9%
D2O and containing 50 g/mL chloramphenicol. A timer was initiated to mark the
start of exchange. The resuspended cells were gently pelleted (~2,500 x g, 10 min), the supernatant removed and the pellet carefully resuspended with a minimal
volume (2 – 3 mL) of PBS in D2O containing 50 g/mL chloramphenicol. The cell
slurry in D2O was returned to the 37 °C shaker and equilibrated for 10 min prior to
preparing the first lysate sample.
3.4.3 In-cell H/D exchange: quenched cell lysates and NMR spectroscopy
At specified times after initiation, a 500 L aliquot was removed from the cell slurry and transferred to a 2-mL tube containing 335 mg of 0.1 mm silica beads (Lysing Matrix B; MP Biomedicals). The aliquot was pelleted via centrifugation at 4,000 x g at 4 °C and the supernatant carefully removed. Quench buffer (350 L 100 mM sodium citrate, pH 3.0, 4 °C) was added and the cells lysed via bead
vortexing124 on a Maxi Mix II vortexer (Thermo Scientific) for 5 min at 4 °C. The lysed cells were centrifuged at 17,000 x g for 5 min at 4 °C, and the cleared, quenched lysate was transferred to an NMR tube and stored on ice prior to NMR analysis.
complete in a shorter time. Second, the expression level of the variant is lower than that of wt GB1, leading to a lower concentration of I6L GB1 in the NMR samples.
For each quenched lysate, a 15N-1H HSQC spectrum was acquired at 5 °C on a Varian Inova 600 MHz spectrometer equipped with a triple resonance HCN probe using sweep widths of 2500 Hz in the 15N dimension and 12001 Hz in the 1H
dimension. Each spectrum was acquired in ~20 min and comprised 64 increments in the 15N dimension with eight scans per increment.
Processing was performed with nmrPipe.75 The N-H crosspeak volumes were obtained from NMRViewJ.76 Backbone amide assignments are based on published
work88,125 and personal communication with the Crowley lab at NUI-Galway.
Crosspeak volumes were plotted against time and fit to an exponential decay function (SigmaPlot) to obtain kobs values for the assigned residues that exhibit appropriate decay profiles.
The pH of each quenched lysate was measured after spectral acquisition and ranged between pH 3 and 4 for all experiments. Typical deviations were ≤0.1 pH unit between lysates from the same experiment. The concentration of wt GB1 in
quenched lysates was 1 – 2 mM based on comparing peak volumes from a lysate of a non-exchanged sample (prepared as above, but without exchange into D2O;
3.4.4 Protein purification for dilute solution and in vitro crowding studies
Isolation and purification of 15N-enriched wt GB1 was based on the protocol of Lindman et al.113 Cells from a 1 L growth in 15N M9 minimal medium and 2 – 3 h induction were harvested and poured into 30 mL of lysis buffer (10 mM Tris-HCl, 1 mM EDTA, pH 7.5) preheated to ~85 °C, whereupon the temperature dropped to 70 – 75 °C. The sample was stirred and heated until the temperature reached 80 °C. The lysed cells were cooled on ice for 10 min and then centrifuged at 28,000 x g for 30 min.
The supernatant was filtered through a 0.45 m syringe-driven unit (Millex) and purified via anion exchange chromatography at 4 °C on an AKTA FPLC (GE Healthcare) by using diethylaminoethyl (DEAE) cellulose resin. Buffer A (20 mM Tris-HCl, pH 7.5) was used to load the crude lysate onto the column and elute impurities. Buffer B (20 mM Tris-HCl, 1 M NaCl, pH 7.5) was used to produce a linear gradient of 0 – 400 mM NaCl. Fractions were assessed by using sodium dodecyl sulfate polyacrylamide gel electrophoresis (4 – 20% Criterion TGX gels; Biorad) with Coomassie Brilliant Blue R-250 staining. Fractions containing GB1 were pooled and concentrated for further purification by size exclusion chromatography (Superdex 75) at 4 °C with a running buffer of 20 mM potassium phosphate, 50 mM NaCl, pH 6.0. The pure fractions were pooled, dialyzed against water, frozen and lyophilized (Labconco).
I6L, we employed sonic dismembration. Cells from a 1 L growth in 15N M9 minimal
medium and 2 – 3 h induction were harvested and resuspended in 10 mL of lysis buffer. The cells were lysed by sonication [500 W dismembrator equipped with 1/8 in. tip, 15% amplitude (Fisher Scientific)] for 10 min using a 2 s on, 2 s off pulse program. The lysed cells were centrifuged for 30 min at 28,000 x g. Streptomycin sulfate (10 mg/mL) was added to the supernatant, followed by stirring at 4 °C for 30 min. The mixture was centrifuged at 28,000 x g for 30 min and the final supernatant filtered through a 0.45 m membrane. The resulting lysate was purified as described above.
3.4.5 Mock in-cell H/D exchange
To mimic the quenched lysate protocol used for the in-cell experiments, studies on purified wt GB1 in buffer alone were performed with samples prepared with a quench step at discrete times. For these experiments, ~25 mg of pure 15 N-enriched GB1 was resuspended to a final pH of 7.2 in 2.0 mL of PBS prepared in 95% D2O. The D2O content mimics the situation in cells exchanged into 99% D2O,
where a basal proton pool exists because of rapidly exchanging sites in proteins and other cellular components. The pH corresponds to a 2H-corrected pH of 7.6, the pH
in E. coli cells.126,127 A timer was initiated at resuspension to mark the start of
lysate samples. The pH of each quenched dilute solution sample was measured after NMR analysis and found to be 3.7.
3.4.6 Conventional in vitro H/D exchange in buffer
To validate the protocol for measuring dilute solution exchange rates at discrete times, the traditional method108 involving serial HSQC acquisitions on a single exchange sample without a quench step was performed. A 1 – 2 mM sample of wt GB1 was prepared by resuspending purified GB1 in PBS prepared in 95% D2O, pH 7.2 and immediately transferred to an NMR tube and placed into the
spectrometer at 37 °C. After equilibration and shim adjustment, serial 15N-1H HSQC spectra were collected for ~6 h (~20 min per spectrum), at which time the exchange reaction was complete. The sample was removed from the magnet, inspected to ensure no precipitate had formed, and the pH confirmed to be 7.2. Data processing was performed with nmrPipe.75 The Rate Analysis tool within NMRViewJ76 was used to plot crosspeak volumes against time and fit the exponential decays to obtain kobs values. For the destabilized I6L variant in buffer, data acquisition was meaningful only for ~2 h after initiation of exchange. To collect a sufficient number of data points for curve fitting, the number of scans per increment was reduced to four, resulting in an acquisition time of ~10 min per spectrum.
3.4.7 Conventional in vitro H/D exchange under crowded conditions
pH 10. The solution was heated for >5 h. The sample was then frozen and lyophilized, and the process repeated once. To initiate the H/D exchange
experiment, a 100 g/L protein crowder sample prepared in PBS (95% D2O) was
used to resuspend purified 15N-enriched wt GB1 to a final concentration of ~1 mM and final pH of 7.2. The sample was quickly mixed, applied to a 0.45 m filter, and inserted into the spectrometer at 37 °C. After thermal equilibration and shim
adjustment, serial spectra were acquired as described above. Data processing and analysis were performed as described for serial, dilute solution H/D exchange. In solutions of both BSA and lysozyme, GB1 exchange was complete within 1 – 2 h.
3.4.8 Differential scanning calorimetry (DSC)
DSC experiments were performed on a MicroCal VP-DSC calorimeter and the data analyzed in Origin 7. Protein samples (0.5 – 1 mM) were prepared in the same buffer as dilute solution exchange experiments. An upward scan from 20 °C to 95 °C at a scan rate of 60 °C/h was performed, followed by cooling to 20 °C. A second upward scan to 95 °C was performed to assess reversibility. Baselines were corrected by subtracting the buffer/buffer scan from the protein/buffer scan. Experiments were performed in triplicate with the standard deviation of the mean indicated (except for measurements of ∆∆Gden°' ,mut, where the uncertainty is from propagation of error analysis).
Tm values were measured at pHcorr 7.6 for wt (79.0 ±0.2 °C) and the I6L