Maths 1, 2, 3, and Statistics…
Sharon Sterken New Hanover
County Schools
Spinning in Circles: long run probability
Note: actual responses will vary from student to student
1. If you spun this spinner, do you think that the tip of the arrow would be likely to land in the shaded region?
Why, or why not?
Most students will think it is unlikely that the tip of the arrow will land in the
2. A probability is a number between 0 and 1 that describes how likely it is that a particular outcome will occur. A probability of 0
represents an outcome that never occurs and a probability of 1 represents an outcome that always occurs. If you spun the pictured
spinner, which do you think would be closest to the probability that the tip of the arrow
would land in the shaded area? a. 0 b. 1/10 c. 1/4 d. 1/2 e. 1
Many students will choose a fraction like 1/10 because the area of the shaded region is
3. Make a spinner arrow by bending the
outside edge of a paper clip back so that points in the opposite direction, as
shown. (The length of your spinner arrow should be equal to the radius of the
spinner disk.) Use a pencil or pen to hold the looped end of the reshaped paper clip in place at the center of the pictured
4. The sample table, which shows the results of 3 spins, illustrates how you should complete table 1.
Spi n
In Shaded Area?
(Y = yes, N = no) Cumulative Number of Spins in Shaded Area Cumulative Number of Spins Proportion of Spins in
Shaded Area
1 N 0 1 0/1 = 0
2 Y 1 2 1/2 = .5
Spin the spinner 20 times and complete table 1 in the same way, by recording each outcome and updating your
cumulative results, as shown.
Remember to use the tip of the paper clip to determine whether the outcome of a spin is shaded or white, and note
that each outcome appears as a yes (Y) or no (N) in the second column. After
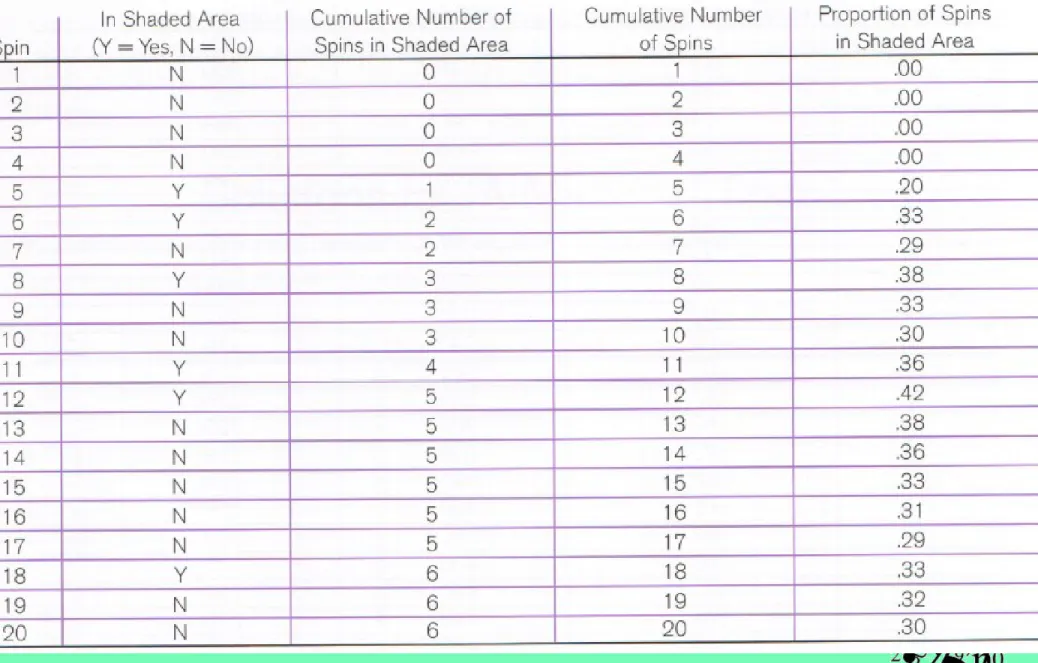
5. In 20 spins, what proportion of the time did the tip of the spinner land in the shaded area?
How close is this value to the value that you selected in number 2 as the probability of such a spin?
For the sample data shown in the preceding
solution, the proportion of the time that the tip of the spinner landed in the shaded area is
0.30. Students who chose a fraction like 1/10 as the estimated probability of the time that the spinner would land in the shaded area in
6. Using your data from Table 1, plot the twenty pairs (Cumulative number of
spins, Proportion of spins in shaded
9. The long-run proportion of “shaded”
outcomes is about 1/4 because the tip of the spinner arrow lands on the
perimeter of the circle and about 1/4 of the perimeter of the circle is shaded.
11 a and b. If students selected the correct probability in question 2, the results of their spins should confirm their choice. If students selected a fraction like 1/10 on the basis of an estimate of the area of the shaded
region, the results should help them see that it is only the tip of the spinner
2. Partners will switch positions and the new puzzler will complete a different Word Find 5 times while the new timer fills out the table with all 5 times.
Trial Number Student A Time Student B Time
1
2
3
4
3. What are the independent and
dependent variables? Explain your reasoning.
Independent variable: number of trials because we think the trial number will explain the time on the puzzle
4. You will create two scatterplots (one for each student’s times) and be sure to
label your axes.
answers will vary
5. Find the equation of the line of best fit for each graph and sketch it on your plot. What are the similarities and differences of the equations?
6. Describe the correlation of each plot. There is a strong, negative linear
relationship between time and number of trials.
7. Predict the time it would take for each person to complete the puzzle on the
12th trial. Do these values make sense? Explain.
8. Summarize your results including the effect repetition has in solving time. How would more repetitions affect the time?
The more trials in puzzle completion, the less time it takes to complete the
Sampling Rectangles
1. Look at the rectangles on the activity sheet. Each small square represents a
rectangle that has an area of one. Select five rectangles that you think would give a good representation (that is, a
representation or “typical” sample) of all the rectangles on the sheet.
a. Record the numbers of the rectangles that you chose and give their
b. Compute and record the sample mean area for the five rectangles that you
selected.
“Typical” Rectangles Number of rectangle Area
1. 2. 3. 4. 5.
2. Generate five random numbers
between 1 and 100 by using a random number generator on your calculator. If a number repeats, discard it and
generate another number to replace it: MATH, PRB, 5: RANDINT (1,100,5)
a. Use these random numbers to locate the five rectangles that have the
b. Compute and record the sample mean area of the five rectangles “selected” by the random numbers.
Random Rectangles Number of rectangle Area
1. 2. 3. 4. 5.
5. Using the 100 rectangles pictured on the activity sheet “Random Rectangles” and the random number generator on your calculator randomly select 10
6. Collect everyone’s results and make a dotplot of the simulated sampling
distribution of the sample means for the samples of size 10.
a. How does this new simulated sampling distribution compare with the simulated sampling distribution that your class
made in the activity Sampling
b. In particular, how does the sample size affect the shape, center and spread of
7. Using the activity sheet “Data Record”, enter a measure of center and a
measure of spread (median and IQR or mean and standard deviation) for each of the two simulated sampling
distributions, and write a brief
Rock, Paper, Scissor… a look at probability
Nelson, C., Williams, N. (2008, December/2009, January). A fair game? The case of rock, paper, scissors. Mathematics
1. With your partner, play Rock, Paper, Scissor eighteen times. (Paper is palm on palm,
rock is a closed fist, and scissors is the number two horizontally. Hit your other
hand twice, and on the third time give the symbol you wish. A rock beats scissors.
Paper beats rocks, and scissors beats paper.) With a tally mark, record the number of
wins, losses, and ties in the table below.
Win Lose
2. Draw a tree diagram to show all possible outcomes of the game.
rock rock rock
rock
paper paper paper
3. How many outcomes does the game have?
4. Label each possible outcome on the tree diagram as to win for a, b, or tie.
tie
rock rock rock
rock
paper paper paper
paper scisso r scisso r scisso r scisso r p la y e r B p la y e r A win A win A
win A win B win B
5. Count the number of wins for A.
3
6. Find the probability A will win in any round.
3/9 = 1/3
7. Count the number of wins for B.
3
8. Find the probability B will win in any round.
9. Is the game fair? Do both players have an equal probability of winning any round?
This is a fair game because each player has a
1/3 chance of winning any round.
10. Compare the mathematical model with what happened when you played the game. discussion
11. How do you think probability is used in the real world? See how many areas you can list that use probability.