Carleton Centre for Community Innovation
Evaluating the Social
Impact of the OCLF/Alterna
Community Micro Loan
Program
2009-2010 Survey: findings,
comparison and analysis
Arjun Langford Evaluator
Carleton Centre for Community Innovation July, 2010
CONTENTS
Executive Summary: ... 3 Introduction ... 4 Methodology ... 5Survey findings Part 1: Training Loans Program ... 7
Survey Findings Part 2: Small Business Loans ... 12
Survey Findings Part 3: Socio-Economic and MACRO-Level (Training and Small Business Loans Program) ... 16
Survey Challenges and Recommendations: ... 20
EXECUTIVE SUMMARY:
Demographics of survey # of respondents in 2010 sample: 15 (9 training loan borrowers, 6 small business loan borrowers)
# of respondents in overall 2009-2010 sample: 30 (19 training loan borrowers, 11 small business loan borrowers)
Core Findings from 2009 and 2010 survey
Training Loans Program Small Business Loans Program
Average loan size: $5,858.
Credit worthiness among recipients is increasing: 60% increase in the number of bank accounts opened in the time after clients have become involved in the program.
95% of those involved with the training loans program become employed or moved on towards further education. 88% of training loan clients gain
employment in the same field in which they have done their training. 68% of training loan clients increased
their salaries after involvement in the program.
The training loans increase borrowers’ income by an average of $17,707.
The average amount of new tax revenue created by the training loans program: $3,019 per person, (average of $872 directed to the provincial government and $2,147 to the federal government annually).
Average loan size: $12,340.
Credit worthiness among recipients is increasing: 65% of small business loan clients are opening new bank accounts and leveraging their initial loans into further access to credit.
83% of OCLF directly contributed to new business creation.
OCLF financing helps small businesses create new job opportunities: an average of 3.27 jobs per small business are created through the small business loans training program.
Business loan recipients increase their income by an average of $14,443 after having received the loan.
50% of the businesses from the 2010 survey sample were able to leverage initial loans into additional loans from the Business Development Bank of Canada (BDC).
50% of the businesses from the 2010 sample improved the location of their businesses.
INTRODUCTION
Background
The Ottawa Community Loan Fund (OCLF) broadly provides two forms of loans, training loans and small business loans. Both programs are facilitated through a partnership between Alterna Savings and the OCLF. Within this partnership, the OCLF acts primarily as an intermediary in the Ottawa community, identifying individuals and groups and providing expertise to those that require access to credit. Alterna Savings, provides the loans to those members of the community, while the OCLF guarantees 80% of the loan in case of borrower insolvency.
There are two forms of training loans. One, the Internationally-Trained Professionals Loans Program, is a specialized loan product designed for students involved in accreditation programs for internationally trained teachers, nurses and bio-tech workers. The second form of training loan is available to all members of the community looking to undertake job-training and accreditation programs.
The OCLF also offers two forms of small business loans, one in partnership with Alterna Savings and one in Partnership with the Canada Youth Business Federation (CYBF). Within the OCLF-Alterna partnership, the OCLF acts as an intermediary and guarantor of loans, while Alterna provides the funding for the loans as part of its Corporate Social Responsibility program. Within the OCLF-CYBF partnership, the OCLF acts as a local intermediary for the nation-wide program. The OCLF is essentially the “store-front” and administrator of the CYBF program that delivers business coaching, resources, financing and mentoring to young entrepreneurs (aged 18-34) with good business ideas but little financing options through conventional sources of credit.
Evaluation
The purpose of this social impact evaluation is to provide an independent measure of the effectiveness of OCLF/Alterna Community Micro Loans Program. The findings of this evaluation will allow the OCLF to provide a detailed snapshot of the impact of its loan program and as a result will provide increased accountability to government, donors, and the public as it increases the breadth of its programming in the future.
The focus of this evaluation goes beyond a typical financial assessment of the program. Rather than a simple breakdown of the amount of money loaned out to clients and re-paid, this evaluation seeks to determine the overall impact that the loan has had on improving the lives of their clients. This evaluation will give a more detailed view on the value-for-money and
effectiveness of the micro-loan program through a focus on the social and economic impacts on the clients served by this program.
Key areas explored in this evaluation are the impacts of the OCLF/Alterna Loans Program on client credit ratings, their ability to access capital, to create and maintain employment, to improve their economic status, and reduce reliance on government. This study will allow both donors and the public a clearer view of the impact that this program is having on the groups that it serves and the resulting impact that this group is having within the Ottawa community.
METHODOLOGY
History
This survey and report is based on a previous report Evaluating the social impact of the OCLF/Alterna Community Micro Loan Program: Findings from the testing of a SROI matrix submitted by 3CI in 2009 by Michele Tarsilla. The questionnaire used for this report was developed from a 2009 evaluation matrix that sought to assess the impact of the program at a micro and macro level. At the micro level, the program assesses the impact of the program on the individual borrowers. At the macro level, the questionnaire addresses the impact of the program on the government at large. In this regard, assessment of the savings created for government through client participation in the program can be quantified.
Interview Method
Interviews were conducted by telephone and were semi-structured. They were
predominantly quantitatively focused, with some qualitative information. The interview was based on predominantly closed-ended questions. Because the OCLF and Alterna provide 4 different forms of loans (CYBF, Small Business, ITTIFI and Training), two different surveys were used. CYBF and Small Business loan clients were given one survey that addressed their situation more directly, while ITTIFI and Training loan clients received a separate survey that performed the same function(for a copy of each of the two questionnaires, please see Appendix I and II for the 2009 survey and Appendix III and IV for the 2010 survey).
Survey Sample
The current design of the 2010 OCLF survey has been adapted from the 2009 evaluation matrix. As a result, data gained from the 2009 research findings can be compared and aggregated with the 2010 research findings1.
The 2010 survey is of OCLF clients between 2007 and 2010 that were not surveyed in 2009. The 2009 survey is of OCLF clients from 2007 to early 2009. Combining the respondents from the 2009 and 2010 survey results, 30 clients of OCLF programming have participated in the research (19 training loan clients and 11 small business loan clients). All of these respondents received their loans between 2007 and 2010. Within this time period, the OCLF has served 68 clients, (46 Training Loan and ITTIFI clients and 22 Small Business Loan and CYBF loan clients). Given the proportion of respondents interviewed (roughly 50%), the number of respondents2 represents a sufficient
sample size to use aggregated data from the two survey years to safely generalize findings as representative of typical results for clients of the program overall.
Representation of findings
1 However, in some cases, changes to the survey (whether for clarity, for richer data or to overcome
obsolescence in questions) have been made.
2 All respondents were contacted based on a list of clients, with each member of the client base (survey
Because of the two different survey formats, the findings section will separate the financial and employment data of the two OCLF programs. Part 1 of the findings section will focus on the financial and employment data of the training loans program, Part 2 of the findings section will focus on the financial and employment data of the small business loans program and Part 3 of the findings section will focus on the socio-economic and macro-level findings of the survey.
SURVEY FINDINGS PART 1: TRAINING LOANS PROGRAM
This section focuses on the findings relating to the training loans program. In this section, there will be information and analysis relating to the size of loan, borrower relationships with financial institutions, employment and income.
The findings from this year’s study are described along with a comparison to the findings from the 2009 study as well as the aggregate findings of the 2009 and 2010 surveys. Analysis and explanations for the results will be included where applicable. The aggregated results represent an accurate approximation of the overall program results of the program between 2007 and 2010. Loan Sizes:
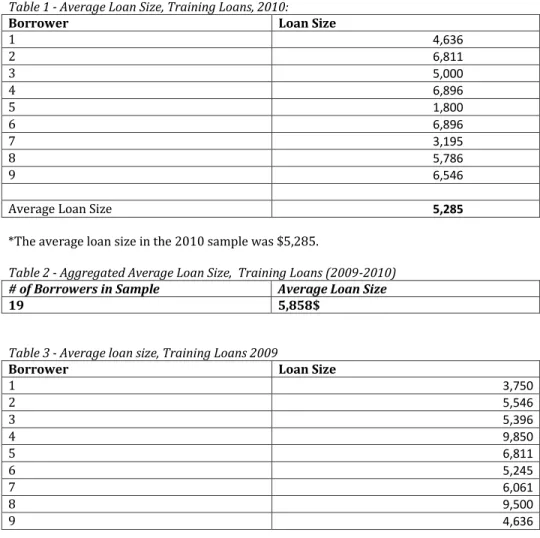
Table 1 - Average Loan Size, Training Loans, 2010:
Borrower Loan Size
1 4,636 2 6,811 3 5,000 4 6,896 5 1,800 6 6,896 7 3,195 8 5,786 9 6,546
Average Loan Size 5,285
*The average loan size in the 2010 sample was $5,285.
Table 2 - Aggregated Average Loan Size, Training Loans (2009-2010)
# of Borrowers in Sample Average Loan Size
19 5,858$
Table 3 - Average loan size, Training Loans 2009
Borrower Loan Size
1 3,750 2 5,546 3 5,396 4 9,850 5 6,811 6 5,245 7 6,061 8 9,500 9 4,636
10 6,946
Average Loan Size 6,374
The average loan size in the 2010 sample was lower than 2009 by $ 1,089 The likely reason that the 2010 survey yielded a lower average loan size is because Alterna changed its training loan policy to a maximum of $5000, mid-year, 2009.
Training Loans Borrowers’ Relationship with Financial Institutions:
Exploring client relationships with financial institutions is important for the purposes of this study because it helps to determine the extent to which the OCLF created new opportunities for credit and the extent to which client participation in OCLF programming improved their credit status.
In order to measure this, the percentage of clients who attempted to receive loans from other institutions prior to the OCLF and the average number of new bank accounts created after receiving a loan were measured.
Table 4 –% of clients who attempted to receive loans at commercial banks prior to OCLF (Training Loans)
Training Loans
2010 Training Loans 2009 Aggregated
% contacted other
institutions for loans 11% 50%
31%
This data indicates that the training loans for 2010 removed barriers to credit access in 11% of the cases. This is a stark contrast from the 2009 data, which indicates that 50% of training loans created a new pathway to credit access.
Another possible reason for the difference between the two sets of data could mean that more potential OCLF clients became aware of the training loans program and thus avoided contact with conventional banks prior to the OCLF.
The aggregated data shows that the majority of training loan clients did not seek loans through other financial avenues, meaning that within the Ottawa area, the OCLF is likely seen as a primary loan source among the training loan demographic. As the program matures more individuals may be learning about the program from friends and colleagues and seek out OCLF as their first choice for training loan application.
Table 5 – Measure of Credit improvement: Number of new bank accounts created after OCLF loan (Training Loans)
Training Loans
2010 Training Loans 2009 Aggregated
# of Bank Accounts 1.44 1.7 1.58
This data represents the number of new bank accounts that are being opened in addition to previous accounts by clients of the training loans program.
This data indicates that again in 2010, credit worthiness among loan recipients is increasing. Similar to 2009, new bank accounts are being opened, which increases accessibility to credit and
improves overall credit ratings for clients. In addition, an increased number of bank accounts helps to link borrowers, in particular new Canadians with the financial system and the possibility of developing a strong credit history and thus, credit rating.
The aggregated data from both years of the survey indicates that there is nearly a 60% increase in the number of bank accounts used in the time after clients have become involved in the program . Employment Status
This sub-section focuses on the employment status of training loan recipients. An outline and analysis of clients’ employment status and employment type will be brought forward.
Table 6 - Employment Status, Training Loans
Employment Status Training Loans
2010 Training Loans 2009 Aggregated Average Full Time Employed 55% 80% 68%
Part-Time Employed 33% 0% 15%
Student/Internship 0% 20% 11%
Unemployed 11% 0% 5%
In 2010 we see a decrease in full time employment and an increase in part time employment and unemployment following the training period. This points to the downturn in the economy over the past 12-18 months as opposed to the earlier survey that captured only 2007, 2008 and early 2009 statistics
The two surveys combined indicates that 95% of those involved with the program become employed after the training loans program or move on towards further education. The vast majority (68%) receive full time employment, while 15% gain part-time employment and an additional 15% continue their education.
A slight limitation of this data is that it assumes that the participants of this survey in 2009 are still in the same employment situation as this year. In the past year there has been no follow up to see if previous participants are still employed.
Table 7 - Employment in Same Field, Training Loans Employment In
same field as training
Training Loans
2010 Training Loans 2009 Aggregated Average
Yes 77% 90% 88%
No 23% 10% 12%
Similar to the finding above, the 2010 survey points to less employment in the field of training as we find in the 2009 survey. Again this finding is likely caused by the downturn in the economy over the past 12-18 months. Unemployment rates nationally through this period rose by 1.9% between 2008 and 2010 (from 6% to 7.9%) and in the Ottawa area rose by 0.8% (from 5.1% to 5.9%). The aggregate data from the two surveys indicates that 88% of training loan clients gain employment in the same field in which they have done their training.
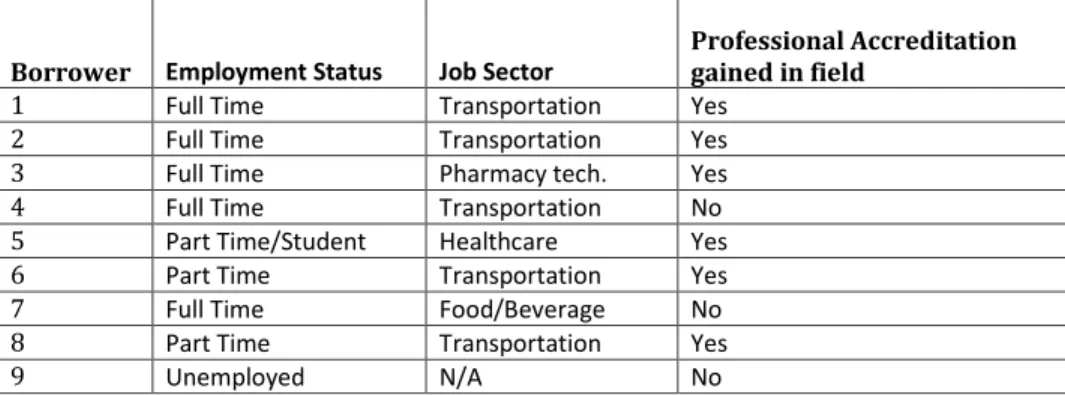
Table 8 – Field of work for training loan borrowers, (2010 sample only) Borrower Employment Status Job Sector
Professional Accreditation gained in field
1 Full Time Transportation Yes
2 Full Time Transportation Yes
3 Full Time Pharmacy tech. Yes
4 Full Time Transportation No
5 Part Time/Student Healthcare Yes
6 Part Time Transportation Yes
7 Full Time Food/Beverage No
8 Part Time Transportation Yes
9 Unemployed N/A No
This table provides a breakdown of the different fields that 2010 training loan borrowers received training in.
66% of training loan borrowers entered the transportation sector and 23% entered the health and pharmacy field.
77% of training loan borrowers gained professional accreditation in their field.
Income
This section outlines the extent to which salaries have changed as a result of the loans program. For the training loans, it is possible to track direct salary changes that come as a result of the training financed by the loan.
Table 9 - Change in salaries (Training Loans)
Salary Change Training Loans
2010 Training Loans 2009 Aggregated Data Salary Increase 66% 100% * Only 7 of 10 respondents answered this question, all responded positively. 68% *This number is based on the total number of clients who reported an increase in salary. Salary Remained the same 33% 0% * Unknown because 3 respondents did not answer this question.
Salary decreased 0% 0% 0%
Did Not Disclose 0% 30% 15%
This table shows that in the 2009 and 20010 surveys a very high proportion of training loan clients, 68%, increase their salaries after involvement in the program. At the same time, no respondents reported a decrease in salary.
.
Table 10 - Average Income Increase (Training Loans) Training Loans 2010 (8 out of 9 response rate) Training Loans 2009 (7 of 10 response rate) Aggregated Data Average Salary Before Loan 26,250 25,208 25,762 Current Average Salary 38,125 49,583 43,471 Average Change in Salary 11,875 24,375$ 17,707
The 2010 data shows that the average salary change was not as dramatic for the 2010 survey. We continue to see increased salaries after the training but in the 2010 survey the increase is less than 50% of the change as found in the 2009 survey. This statistic can be linked to two earlier findings. In 2010 there were more part time workers following the training loan as we find in the 2009 survey again this can be directly attributable to the exonomic downturn over this period. Secondly, the 2009 survey participants captured a greater number of years since their training (2007-2009) while the 2010 survey captures income changes over a shorter period, 2009-2010.
In the aggregate across the two surveys the training loans on average increase borrowers income by $17,707.
* * *
“It (the training loan) helped me a lot, I thought I wasn’t going to get it because of my
income, Alterna saved my life because the other banks wouldn’t help me out”
- Training Loan Recipient, 2010
“Credit-wise, this has really helped me out” - Training Loan Recipient, 2010
“It has made my overall career better” – Training Loan Recipient, 2010
SURVEY FINDINGS PART 2: SMALL BUSINESS LOANS
The varying nature of the small business loans program relative to the training loans program makes the use of a separate set of survey instruments and thus separate sections of analysis for the two programs necessary. This section outlines findings on the small business loan borrowers’ loan size data, relationships with financial institutions, employment outcomes and income.
Loan Sizes:
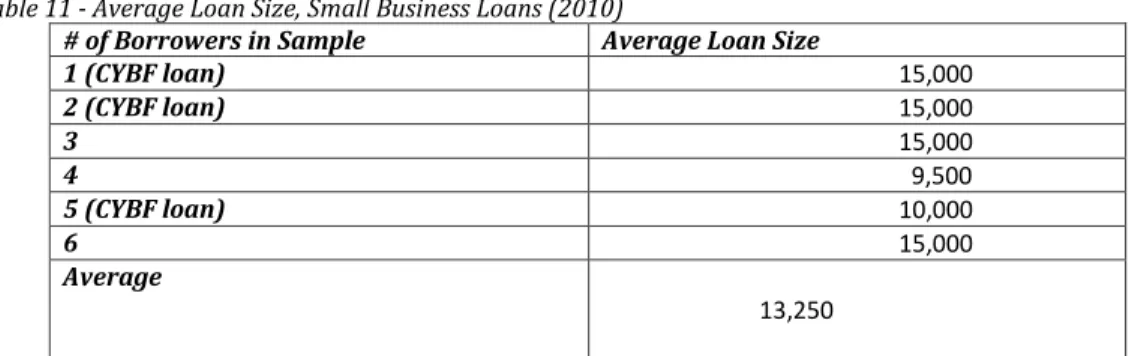
Table 11 - Average Loan Size, Small Business Loans (2010)
# of Borrowers in Sample Average Loan Size
1 (CYBF loan) 15,000 2 (CYBF loan) 15,000 3 15,000 4 9,500 5 (CYBF loan) 10,000 6 15,000 Average 13,250
The average loan size for small business loans in the 2010 survey was $13,250. Table 12 - Average Loan Size, Small Business Loans (2009)
# of Borrowers in Sample Average Loan Size
1 10,500 2 7,500 3 8,250 4 15,000 5 15,000 Average 11,250
The average loan for small business loans in the 2009 sample was $2,000 less than those in 2010. Table 13 - Aggregated Small Business Loan size
# of Borrowers in Sample Average Loan Size
11 12,340
The average loan size among small business loan recipients in both the 2009 and 2010 surveys is $12,340.
Relationship with Financial Institutions
For small business owners, the advantages that come with credit-worthiness are closely tied to the ability to leverage loans for the purposes of business expansion, large-scale equipment purchases and the ability to obtain a larger line of credit for product purchases. This subsection outlines and analyzes the percentage of financial institutions contacted prior to the OCLF and the number of new bank accounts created by small business loan borrowers.
Table 14 - Number of Banks Contacted for a loan prior to OCLF (Small Business Loans)
Small Business
Loans 2010 Small Business Loans 2009 Aggregated
% of clients that contacted other institutions for loans
prior to the OCLF 30% 60%
45%
*The 2010 survey had a much lower percentage of clients who sought loans from other institutions prior to contacting the OCLF. The likely reason for this is that 50% of the loan recipients from the 2010 survey obtained CYBF loans. In the 2009 survey, 40% of the small business loan clients received CYBF loans. In total, 45% of the small business loans clients received CYBF loans. As mentioned in the introductory section, the CYBF is geared towards young entrepreneurs and has made the OCLF a primary option for a loan, rather than a secondary option for young
entrepreneurs. Only 1 of 11 small business loan clients (9% of the sample) that was not part of the CYBF program did not contact another financial institution prior to the OCLF.
The aggregated data from the small business loan sample of 2009 and 2010 indicates that 45% of clients contacted other institutions prior to the OCLF for a loan. When discounting the 5 of 11 CYBF small business loan recipients that had a greater incentive to contact the OCLF first, 83% (5 of 6 remaining small business loan borrowers) contacted other financial institutions first. This is a significant number, meaning that over 80% of the businesses supported by the small business loans program (not including CYBF) would not have received the financing necessary to start their businesses had it not been for the presence of the OCLF programming.
Table 15 - Measure of Credit improvement: Number of new bank accounts created after OCLF loan (Small Business Loans)
Small Business
Loans 2010 Small Business Loans 2009 Aggregated
# of Bank Accounts 1.6 1.7 1.65
This data indicates that businesses are benefitting strongly from involvement with the OCLF programming for credit-worthiness purposes. Aggregated data suggests that small business loan clients are opening new bank accounts and thus leveraging their initial loan in to further access to credit for the expansion of their businesses.
The power of leveraging is significant for the OCLF loan recipients from the 2010 sample: -50% of the small business loan borrowers that were part of the 2010 survey sample were able to obtain additional loans from the Business Development Bank of Canada (BDC).
-50% of the businesses in the 2010 were able to improve the location of their businesses, by moving from a home location at the time of establishment to a current storefront location.
Leveraging of finances and credit-worthiness are a direct result of the loans facilitated by the OCLF.
Employment
In measuring the effectiveness of the small business loans program, it is necessary to look at the purpose of the loans, the ability of loan recipients to maintain ownership of their business and the average number of jobs created by the businesses.
Table 16 – Purpose of Loan (2010 Survey)3
Purpose of funding Percentage
Business Start-Up 83%
Business Expansion 17%
This data indicates that the vast majority, 83% of small business loans from the OCLF foster the creation of new businesses.
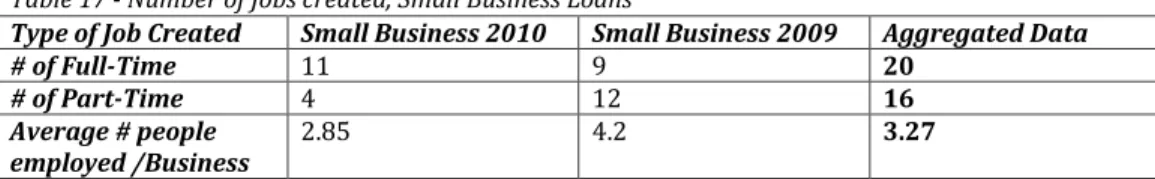
Table 17 - Number of Jobs created, Small Business Loans
Type of Job Created Small Business 2010 Small Business 2009 Aggregated Data
# of Full-Time 11 9 20
# of Part-Time 4 12 16
Average # people
employed /Business 2.85 4.2 3.27
This table shows that on average, the small businesses financed through the small business loans program between 2007 and 2010 create an average of 3.27 jobs per business (both full and part-time). This means that this program’s financing directly contributes to increased job opportunities. Income
For the small business loans, direct salary changes are more difficult to track because business owners do not always pay themselves salaries, and often re-invest gains back in to their businesses. As a result, income among small business loan borrowers was calculated based on business revenue.
Table 18 - Average Business Revenue (Small Business Loans) Small Business Loans 2010 (4 out of 6 response rate) Training Loans 2009 (5 of 5 response rate) Aggregated Data Average Salary Before Loan $42,500 $44,000 $43,332 Current Average Salary $73,125 $49,583 $60,045 Average Change in Salary 26,250$ 5,000$ 14,443$
Based on the 2009 and 2010 surveys of nine small business loan recipients on average, business loan recipients increase their income by $14,443 after having received the loan.
SURVEY FINDINGS PART 3: SOCIO-ECONOMIC AND
MACRO-LEVEL (TRAINING AND SMALL BUSINESS LOANS PROGRAM)
This section has two core functions, the first is to outline some of the personal impacts on the lives of both of training loan and small business loan recipients, this is possible by outlining and analyzing the results of the data relating to housing status and socioeconomic status from the survey.
The second part of this section will outline the impact of the program on government. This is possible through analysis of the amount of money generated by increased tax revenue, and the amount of money saved through reduced expenditure.
Housing
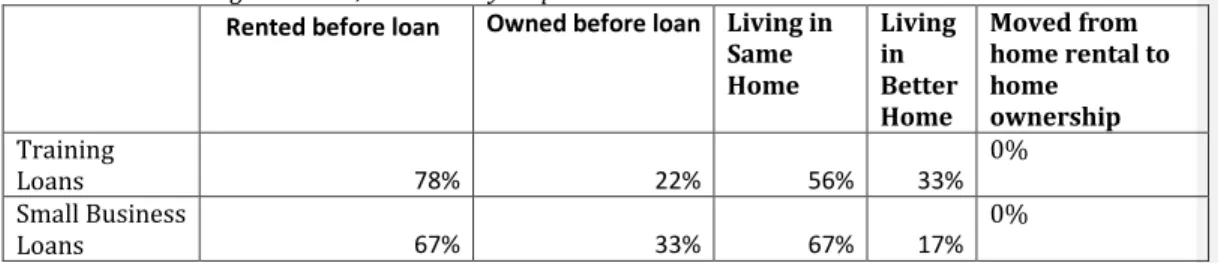
In the 2009 survey, 20% of respondents who rented before the program ended up buying their home as a result of the increased income. Unfortunately, because of the previous survey design, little additional information can be gained from the 2009 respondents. For the 2010 survey respondents, increased information on housing outcomes for clients has been garnered. Table 19 - Housing outcomes, 2010 survey respondents
Rented before loan Owned before loan Living in
Same Home Living in Better Home Moved from home rental to home ownership Training Loans 78% 22% 56% 33% 0% Small Business Loans 67% 33% 67% 17% 0%
*This shows that overall the loans have had an impact on client housing outcomes. For the training loan users, one third are now living in better homes (defined in the survey as homes with more space or more rooms). For small business loan clients, 17% of clients are living in better homes. Most continue to rent rather than own their homes.
Socioeconomic Impact
The 2009 survey found that 80% of all borrowers (both training loan and small business loan respondents combined) experienced improved socio-economic status for themselves or their family. Specific areas of improvement in their lives listed, included improvements to their recreational activities, food and nutrition, ability to support their spouse, purchasing assets, improvement in health and a sense of general well being.
The 2010 survey had similar results for those receiving training loans and different results for those receiving small business loans where only 17% indicated a change in socio-economic status and many were unsure if such a change had occurred:
Table 20 – Socio-economic Impact, 2010 Economic Status Improved from loan Areas of improvement noted: Training Loans 77% (yes) [7 of 9 respondents] 23% (no) [2 of 9 respondents]
-Health and Medical Care.
-Improved credit rating. -Ability to support family abroad.
-Supporting family -Improvements in Medical care
Small Business
Loans Yes - 17% [1 of 6 Respondents] No - 50% [3 of 6 Respondents] Unsure - 33% [2 of 6 respondents]
-ability to purchase business assets.
From the 2010 data it is clear that the training loans have a significant impact on improving the socio-economic status of borrowers. As was shown in the income section, training loan borrowers experienced a clear increase in income which has translated to overall improvements in their lives. For small business loans borrowers, the results are quite different. There is less overall enthusiasm for improvements created by the program on their lives. Yet, Table 18 points to a significant raise in salary for business loan recipients. Possible reasons for this could be the fact that running a small business can be a difficult and stressful undertaking and that improvements to a business’s status are not always perceived as improvements at the personal level. In fact the more noticeable statistic is in the hiring of others and expanded economic activity that results from the training loan rather than a perception of socio-economic change for the business owner. Finally, certain respondents remarked that the amount of time between receiving a loan and experiencing changes to their personal lives has been too short to notice any differences.
OCLF programming impact on Government: Social Return on Investment at the Macro-level Determining the SROI at the macro level is possible in two ways:
1) By determining the number of borrowers in the sample who have moved partially or completely away from welfare assistance programs.
2) By determining increases in clients’ annual income, the program contributes to the payment of higher taxes.
Table 21 - Client movement away from social assistance
Borrower Type of Government Assistance Support Previously Received per month Annual Savings for Government 1 Ontario Disability
Support Program 500-1000/month $6,000-12,000
2 Ontario works, Social
Assistance 500/month $6,000
3 Employment
Insurance 500-1000/month $6,000-12,000 Total Government
Savings from three former social assistance recipients
$18,000-30,000
3 Training loan clients were on some form of social assistance before the loan, and stopped receiving it after the loan. None of the small business loan recipients had benefitted from any form of social assistance.
Based on the 2010 survey sample alone, the OCLF has directly contributed to saving government between $18,000 and $30,000.
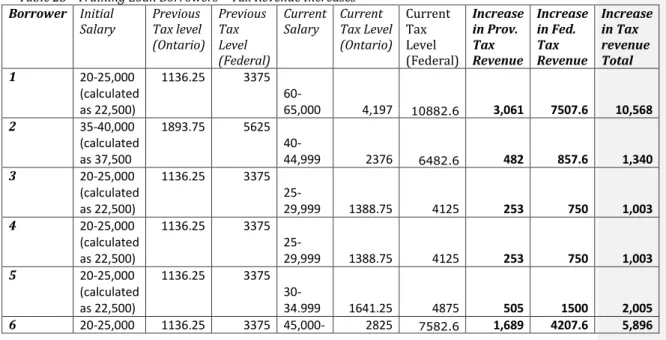
Table 23 - Training Loan Borrowers – Tax Revenue Increases
Borrower Initial
Salary Previous Tax level (Ontario) Previous Tax Level (Federal) Current
Salary Current Tax Level (Ontario) Current Tax Level (Federal) Increase in Prov. Tax Revenue Increase in Fed. Tax Revenue Increase in Tax revenue Total 1 20-25,000 (calculated as 22,500) 1136.25 3375 60-65,000 4,197 10882.6 3,061 7507.6 10,568 2 35-40,000 (calculated as 37,500 1893.75 5625 40-44,999 2376 6482.6 482 857.6 1,340 3 20-25,000 (calculated as 22,500) 1136.25 3375 25-29,999 1388.75 4125 253 750 1,003 4 20-25,000 (calculated as 22,500) 1136.25 3375 25-29,999 1388.75 4125 253 750 1,003 5 20-25,000 (calculated as 22,500) 1136.25 3375 30-34.999 1641.25 4875 505 1500 2,005 6 20-25,000 1136.25 3375 45,000- 2825 7582.6 1,689 4207.6 5,896
(calculated as 22,500) 49,999 7 20-25,000 (calculated as 22,500) 1136.25 3375 20-24,999 1136.25 3375 0 0 0 8 30-35,000 1641.25 4875 40-44,999 2376 6482.6 735 1607.6 2,342 9 Did not disclose N/A N/A
N/A N/A N/A N/A N/A N/A
Average Per
Client $872 $2147 $3,019
This table shows that both the provincial and federal government gained a significant increase in tax revenue from the increases in salary generated through participation in the loans program. On average, the total amount of new tax revenue created by the training loans is $3,019 per person, with an average $872 going to the provincial government and $2,147 going to the federal government annually.
Table 24 - Income Tax increases, Small Business Loans, 2010
Small Business Loans Increased 66% (4 of 6)
Stayed the same 16% (1 of 6)
Did not disclose 16% (1 of 6)
*Tax Rates for Business Owners: Calculating a reasonable estimate of the tax contributions of the small business borrowers sample is not possible because of the many different tax incentives and taxing mechanisms available for businesses. An accurate estimation of this group’s tax
contributions would require access to each individual’s business books, this would be too difficult to obtain given the nature of this project. That being said, 66% of small business loan borrowers did report that their income taxes did increase, though an accurate assessment of the extent to which tax revenue increased is not possible to extrapolate.
SURVEY CHALLENGES AND RECOMMENDATIONS:
Challenge Recommendation
Contacting an adequate number of respondents based on existing contact information.
Of the contact list, many numbers were no longer in existence and few emails were provided, reducing the potential number of respondents to be contacted.
Strong Contact Connection: Ensure multiple sources of contact information at intake. Ensure that a work phone number, home phone number, cellular phone number and a personal and work email are provided at intake. Contact all clients in the database on a yearly basis to make sure information is updated.
Participant skepticism.
Several potential respondents declined to either participate in the interview or provide certain information.
Legitimacy:
Notify all clients of the program that participation in follow up interviews and research is a mandatory part of the loans program. Have a form that outlines the fact they will be contacted and that participation in future research is an essential part of the terms and conditions of the contract.
Participant availability.
Varied working hours. On several occasions it was very difficult to gain contact with a potential respondent, especially those that took training loans for trucking.
Variation:
Varied calling times, this comes with its own potential problems, such as the fact that people don’t like being bothered evenings and weekends.
Lack of before and after comparison.
True impact statements would be more fruitful if an intake and exit interview could be compared against one another.
New client information intake:
At intake, perform a similar survey to act as a baseline for future study of the benefits to applicants.
CONCLUSIONS
Improved relationships with financial institutions
OCLF programming directly contributes to improved relationships between loan clients and financial institutions. This creates better credit ratings for individuals and new opportunities for business expansion. This means that groups that were formerly marginalized from the mainstream financial system, are gaining a foothold thanks to the lift provided by the OCLF.
These improved relationships with financial institutions have tangible benefits. For training loan borrowers, a higher number of bank accounts are being opened in the time after clients have become involved in the program, for small business loan borrowers, improved credit rating was cited as a clear benefit of participating in the program.
Small business loan clients are opening new bank accounts and thus leveraging their initial loan in to further access to credit for the expansion of their businesses. These improved relationships contributed to 50% of the small business loan borrowers (from the 2010 survey sample) being able to obtain additional loans from the Business Development Bank of Canada (BDC). In addition, 50% of the businesses were able to improve the location of their businesses, by moving from a home location at the time of establishment to a current storefront location.
Increased Employment Opportunities
OCLF programming helped individuals gain employment at higher wages and helped businesses create new employment opportunities.
Based on the 2009 and 2010 surveys, 95% of those involved with the training loans program became employed or move on towards further education after the training loans program. At the same time, the training loans on average increased borrowers income by an average of $17,707 annually.
These two surveys also indicate that small businesses that were financed by OCLF programming created an average of 3.27 jobs per business, while businesses increased their average revenue by $14,443.
Improvements in socio-economic status
The OCLF training loans program had a significant impact on improving the socio-economic status of recipients. 80% of the respondents from the 2009 sample and 77% of the respondents expressed the view that their lives had improved since taking out the training loan. Areas of improvement include improvements in health and medical care, improved credit rating, improved ability to support family abroad and overall family support.
In contrast the 2010 sample showed that 33% of respondents were unsure if the loan had improved their economic status, 50% expressed that it had not improved their lives, with only 17%
expressing that the loan had been of benefit to them. Based on the fact that 100% of these businesses were still in existence (a much higher success rate than most other small businesses), and there was an average salary increase of over $14,000 per business, these results likely have more to do with the nature of running a small business than dissatisfaction with the program overall.
Government benefits significantly from OCLF programming: increased tax revenues, decreased expenditures
Because OCLF programming enables increased economic outcomes for the individual, government benefits as well. The 2010 survey indicates that the increased salaries attained by training loan recipients generated an average of $3,019 in total annual tax revenue, with the province of Ontario receiving an $872 increase annually and the federal government receiving $2147 annually. Though determining average increases in tax revenue is not possible for the small business loans program, 66% of businesses reported placement in higher business tax brackets than before receiving their loan. Government is benefitting significantly from increased revenue from the people and businesses supported by OCLF programming. In addition, the OCLF has helped facilitate increased employment opportunities. In the 2010 sample alone, 3 program participants moved away from government assistance into employment. This helped to save government between $18,000 and $30,000 annually. In addition 15 new employees were hired by businesses receiving small business loans. The bottom line indicates that when OCLF is able to expand its services, government as much as the OCLF’s clients will benefit.


![Table 20 – Socio-economic Impact, 2010 Economic Status Improved from loan Areas of improvement noted: Training Loans 77% (yes) [7 of 9 respondents] 23% (no) [2 of 9 respondents]](https://thumb-us.123doks.com/thumbv2/123dok_us/8753626.2373734/17.918.106.561.256.657/economic-impact-economic-improved-improvement-training-respondents-respondents.webp)