Statistique Canada Statistics
Canada
Component of Statistics Canada Catalogue no. 75-001-X Perspectives on Labour and Income
Household debt in Canada
by Raj K. Chawla and Sharanjit Uppal
March 23, 2012The following standard symbols are used in Statistics Canada publications: not available for any reference period
not available for a specific reference period not applicable
true zero or a value rounded to zero
value rounded to 0 (zero) where a meaningful distinction exists between true zero and the value rounded preliminary
revised
suppressed to meet the confidentiality requirements of the Statistics Act use with caution
too unreliable to be published . .. ... 0 0S p r x E F
Highlights
In this issue
Household debt in Canada
In 2009, two-thirds of households had outstanding debt that averaged $114,400.
The incidence and amount of debt was higher in certain groups: younger homeowners, young families with children, the better-educated, and those with high household incomes. Over 60% of household debt was held by those under 45 years of age, and nearly one-half was held by couples with children.
Household debt was more unequally distributed in populations that are considered more economically vulnerable, such as the less-educated, unattached individuals and renters. Conversely, debt was more equally distributed among the better-educated, couples with children, people with higher household incomes and mortgagees.
Debt was higher in some regions—particularly in areas with higher housing costs. Households in British Columbia, Alberta and or Ontario owed, on average, between $124,700 and $157,700, com-pared to the national average of $114,400.
Those who were more likely to correctly answer questions related to financial knowledge and had higher levels of self-assessed financial knowledge were also more likely to have higher levels of debt, even when other characteristics such as income, age and education were taken into account.
Household debt
in Canada
Raj K. Chawla and Sharanjit Uppal
Raj K. Chawla and Sharanjit Uppal are with the Labour Statistics Division. Raj K. Chawla can be reached at 613-951-6901 or raj.chawla@statcan.gc.ca. Sharanjit Uppal can be reached at 613-951-3887 or sharanjit.uppal@statcan.gc.ca.
M
any Canadians use debt to finance the purchase of a new home, acquire goods and services, or invest in education. In recent years, both mortgage debt and consumer debt have increased significantly (Chawla 2011). In 1980, the ratio of household debt to personal disposable income was 66%; that ratio recently passed the 150% figure (Statistics Canada 2011). This means that, in aggregate, households owed more than $1.50 for every dollar of disposable income. Household debt is therefore an increasingly important component of the finances of many Canadian families.Although estimates of household debt are produced on a regular basis at the aggregate level, less is known about the individual characteristics of borrowers. The Survey of Financial Security (SFS), last conducted in 2005 (and prior to that, in 1999), is one of the primary sources of information on household finances. Corre-spondingly, studies examining the characteristics of Canadian borrowers are relatively rare (Brighton and Connidis 1982; Schwartz 1999).
The 2009 Canadian Financial Capability Survey (CFCS), supported by the Department of Finance Canada and Human Resources and Skills Develop-ment Canada, was conducted to assess the financial knowledge, saving patterns and credit use of Canadi-ans. It included questions on the assets and debts of survey respondents (see Data source and definitions). The CFCS is the most current source of data on the char-acteristics of Canadian borrowers collected by Statis-tics Canada.
One aim of the survey was to collect information on financial literacy. The Task Force on Financial Literacy defined financial literacy as having the knowledge, skills
Data source and definitions
The analysis contained in this study is based on the 2009 Canadian Financial Capability Survey (CFCS). This survey was sponsored by Human Resources and Skills Development Canada, the Department of Finance Canada and the Financial Consumer Agency of Canada to assess Canadi-ans’ knowledge and abilities related to handling their fi-nances, including budgeting, saving for retirement and children’s postsecondary education, assets held, mortgages and consumer debts owed. The survey also collected infor-mation on the sources Canadians used to improve their financial knowledge and abilities to handle and improve their finances, day-to-day money management, and gen-eral financial planning.
The survey received responses from 15,519 persons 18 years of age and over covering sociodemographic and employ-ment characteristics, sources of income, types of assets held and debts owed, and other behavioural characteristics. In the vast majority of cases (about 90%), survey respondents were those responsible for decisions related to ongoing household expenses and financial management. Most of this information was in terms of “yes/no” format with separate codes for “refused,” “don’t know,” “not stated,” and “valid skip.” Quantitative information was sought on pre-tax to-tal income, the household’s toto-tal income, asset holdings, debts and liabilities, and wealth. Missing information on income was imputed whereas total assets, total debts and liabilities, and wealth were left with a separate code. Because of the low response rate to the assets portion of the survey (about 50%), assets-related variables are not used in this paper. Regarding the debt section, 84% of those in the sample provided usable data on their debt status and the amount of total debt outstanding. The valid response range for total debt was greater than $0 and less than or equal to $5 million.
The total household debt includes mortgage debt on prin-cipal residence, vacation home and other real estate, and consumer debt. The latter includes debt outstanding on credit cards, personal and home equity lines of credit, secured and unsecured loans from banks and other insti-tutions, and unpaid bills (including taxes, rent, etc.).
Household debt in Canada
and confidence to make responsible financial decisions (Department of Finance Canada 2010).1 In the CFCS,
financial literacy was measured by 14 multiple-choice questions related to inflation and interest rates, credit reports and credit ratings, stocks and risk, insurance, taxation, debts and loans, and banking fees. These ques-tions covered a wide range of financial topics and con-cepts indicative of financial literacy rather than just numerical ability. Importantly, “do not know” was al-ways an option so respondents were not required to come up with an answer.
Given its focus on financial literacy, the CFCS can be used to examine whether the presence or amount of debt is correlated with financial knowledge—a new contribution to the Canadian literature on household debt.
This paper begins by examining the characteristics of debtors, focusing on two questions. Are debtors more likely to be found in certain types of households? Which households accumulate larger amounts of debt? The article then investigates whether debts are associ-ated with the level of financial knowledge or indica-tors of financial attitudes. It also examines whether the relationships between debt and financial capability per-sist when other characteristics like income and educa-tional attainment are taken into account.
Debt is the outcome of a contract between lenders and borrowers. Lending institutions will consider many factors in reviewing the loan applications of potential borrowers that affect both the incidence and level of debt. Such factors may include the level and stability of the applicant’s income, his or her current debt load, collateral assets, and the market value of mortgaged properties, among others. Thus the level of outstanding debt is not just a function of borrow-ers’ demands but also the lendborrow-ers’ assessment of bor-rowers’ ability to repay or provide sufficient collateral assets.
Who are the borrowers?
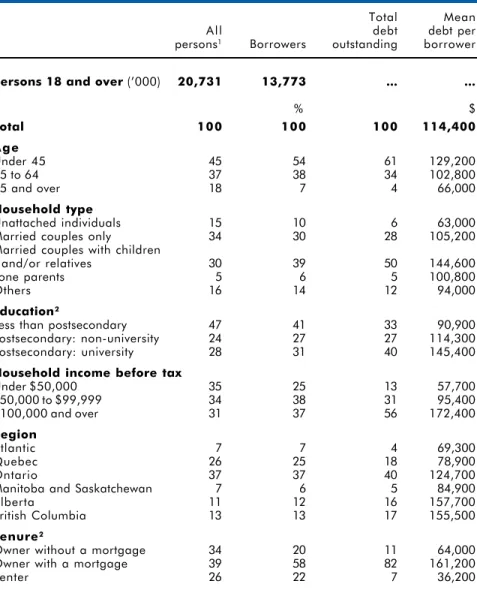
In the CFCS, household debt is defined as mortgage debt on all residences and real estate, and consumer debt (including debt outstanding on credit cards, personal and home equity lines of credit, secured and unsecured loans from banks and other institutions, and unpaid bills). Of those who answered the debt questions, two-thirds said that they held at least one type of debt. In 2009, borrowers had an average of $114,400 per debtor2 (Table 1).
Consistent with the life-cycle theory (Modigliani and Brumberg 1954; Friedman 1957; Browning and Crossley 2001), younger people and parents with chil-dren at home were more likely to hold debt. Indi-viduals under 45 made up 45% of the population, but 54% of borrowers. Similarly, married people with children accounted for 30% of the overall population, but 39% of debtors. They were also more likely to have higher levels of debt. Couples with children held one-half of all household debt, with an average debt of $144,600, higher than the overall average of $114,400. Similarly, individuals under 45 held 61% of household debt, $129,200 on average.
Higher income was associated with an increased prob-ability of holding debt and a higher debt load. Indi-viduals who had a household income of at least $100,000 represented 31% of the population but 37% of those with debt. Moreover, individuals with higher household incomes had more debt, likely due to their greater debt-carrying capacity.3 The total amount of
household debt was particularly concentrated among those with at least $100,000 in household income as they accounted for 37% of all debtors but held 56% of all household debt (averaging $172,400 per bor-rower). In comparison, those who had a household income of at least $50,000 but less than $100,000 rep-resented 38% of debtors but held 31% of household debt (averaging $95,400 per borrower), while those with less than $50,000 in household income held 13% (or $57,700 per borrower), even though they made up 25% of debtors.
Higher education levels were also associated with an increased probability of holding debt and higher aver-age debt. Individuals with at least some postsecondary education comprised about one-half of the popula-tion but almost 60% of those with debt. And univer-sity graduates had an average debt that was 60% higher than those with less than postsecondary education— $145,400 compared to $90,900.
Although the distribution of borrowers across regions was similar to the distribution of the population as a whole, the amount owed was more concentrated in some regions. Debtors in British Columbia, Alberta and Ontario owed, on average, between $124,700 and $157,700, compared to the national average of $114,400. Together, households in these provinces held 3 out of 4 dollars of household debt in the country. The concentration of debt in these regions generally corresponds to higher real estate prices (TD Econom-ics 2011).
Household debt in Canada
Table 1 Distribution of borrowers and total debt across selected characteristics1
Total Mean
All debt debt per
persons1 Borrowers outstanding borrower
Persons 18 and over (’000) 20,731 13,773 ... ...
% $ Total 100 100 100 114,400 Age Under 45 45 54 61 129,200 45 to 64 37 38 34 102,800 65 and over 18 7 4 66,000 Household type Unattached individuals 15 10 6 63,000
Married couples only 34 30 28 105,200
Married couples with children
and/or relatives 30 39 50 144,600
Lone parents 5 6 5 100,800
Others 16 14 12 94,000
Education2
Less than postsecondary 47 41 33 90,900
Postsecondary: non-university 24 27 27 114,300
Postsecondary: university 28 31 40 145,400
Household income before tax
Under $50,000 35 25 13 57,700 $50,000 to $99,999 34 38 31 95,400 $100,000 and over 31 37 56 172,400 Region Atlantic 7 7 4 69,300 Quebec 26 25 18 78,900 Ontario 37 37 40 124,700
Manitoba and Saskatchewan 7 6 5 84,900
Alberta 11 12 16 157,700
British Columbia 13 13 17 155,500
Tenure2
Owner without a mortgage 34 20 11 64,000
Owner with a mortgage 39 58 82 161,200
Renter 26 22 7 36,200
1. Excludes those who did not answer the CFCS debt module. 2. Excludes those with missing information on this characteristic.
Source: Statistics Canada, Canadian Financial Capability Survey (CFCS), 2009.
A close relationship was also found between home ownership and debt as households with mortgages accounted for 39% of the popula-tion but 58% of debtors. Con-versely, homeowners without a mortgage accounted for 34% of the population but 62% of all households without any debt.4
Renters (26% of the population) were also less likely to hold debt, as they accounted for one-third of households without any debt.65
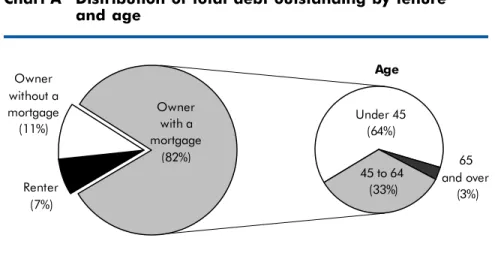
Debt was concentrated among mortgagees, who held 82% of out-standing debt (averaging $161,200 per debtor). Conversely, home-owners without a mortgage held
11% and renters 7% of total debt. Almost two-thirds of mortgagees were under 45 (Chart A), and this group held more than one-half of outstanding debt. The concentra-tion of debt among younger mort-gagees falls in line with the life-cycle theory of consumption. For many mortgagees, housing is both a consumption item and an investment tool, which can also be used as collateral to finance other needs (see Mortgage and consumer debt).
Dispersion of household debt
Even though some groups have higher average debt levels than oth-ers, this does not necessarily mean that debt is equally distributed
within these groups. One method that can be used to look at debt dispersion is the Gini coefficient.7
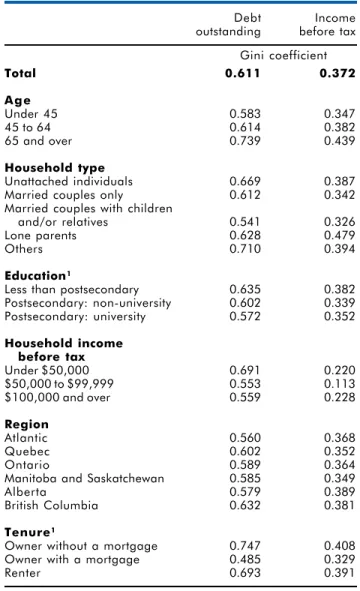
A higher value of the Gini coeffi-cient indicates a greater concentra-tion in the distribuconcentra-tion—the situation where a relatively small proportion of borrowers hold a large proportion of total debt. Looking only at borrowers, the 2009 Gini coefficient of household debt was 0.611, compared with 0.372 for household income for the same group (Table 3). This means that debt is about 64% more con-centrated among borrowing house-holds than income in those same households. Moreover, debt was more concentrated than income among borrowers in all sociodemographic groups. Nevertheless, household debt was more unequally distributed within some groups of borrowers than others. Groups with a higher Gini coefficient included those who had less than a postsecondary educa-tion, unattached individuals and people in ‘other’ family types, and those with less than $50,000
Household debt in Canada 45 to 64 (33%) Owner without a mortgage (11%) Renter (7%) Owner with a mortgage (82%) 65 and over (3%) Under 45 (64%) Age
Table 2 Distribution of debtors by age, tenure and number of consumer debts held
Owner Owner
without a with a
Total mortgage mortgage Renter
’000 All debtors 13,773 2,705 8,022 3,009 % None 15 5 23 5 One 42 62 34 45 Two 28 27 27 33 At least three 14 7 16 17 ’000
Under 45 years of age 7,481 871 4,577 1,998 % None 14 5 19 4 O n e 39 56 34 41 Two 30 30 28 33 At least three 18 9 19 21 ’000 45 to 64 years of age 5,286 1,367 3,094 825 % None 18 4 26 8 O n e 43 63 34 45 Two 28 26 28 36 At least three 11 7 13 12 ’000
65 years of age and over 1,006 466 352 185 %
None 18 6 39 8
O n e 62 70 43 74
Two 17 22 12 15
At least three 3 2 6 3
Source: Statistics Canada, Canadian Financial Capability Survey, 2009.
Mortgage and consumer debt
The 2009 CFCS did not collect infor-mation on the relative contribution of consumer debt and mortgage debt to overall household debt. However, it collected information on the presence of six types of consumer debts: student loans, payday loans, other loans (ex-cluding the first two), credit card bal-ances, personal and home equity lines of credit, and unpaid bills (e.g., taxes, rent).6 The proportion of debtors with
an outstanding credit card balance was 48%; 41% had an outstanding line of credit; 32% had other loans (e.g., per-sonal loans); 18% had student loans; 3% had other debts (e.g., unpaid bills); and less than 1% had payday loans. Debtors with a mortgage were more likely to have more than one source of consumer debt. For instance, 48% of those with just one type of consumer debt were mortgagees, compared with 65% among those who had at least three types of consumer debts. As the homeowner ages, both mortgage and consumer debt decline. Among those under 45, the proportion of debt-ors with three or more consumer loans was 18%, but this proportion was 11% among those age 45 to 64 and just 3% among those at least 65 years of age (Table 2). Conversely, the proportion of debtors using only one source of consumer debt rose with age, from 39% among those under 45, to 62% among those at least 65 years of age.
in household income. Because individuals in these groups may have fewer resources to deal with debt payments, the most indebted within these groups may be more at risk of defaulting because they hold a large portion of the group debt.8
Conversely, debt was more equally distributed among youth, those with a postsecondary education and those who had at least $50,000 in family income (the latter hold a disproportionate amount of out-standing debt).
Chart A Distribution of total debt outstanding by tenure and age
Household debt in Canada
Table 3 also indicates that owners without a mortgage and renters had higher levels of debt inequality—even if differences between them are, by definition, mostly due to differences in consumer debt. This means that even though renters and mortgage-free homeowners held just 18% of household debt, most debt was con-centrated among a relatively small proportion of the group.
Financial literacy
A large proportion of total household debt is held by people who are in the accumulation stages of their life cycle and/or who have higher-than-average incomes. Although their borrowing accords with life-cycle smoothing and has passed institutional lending stand-ards, the extent to which borrowers account for the risk of interest rate increases, housing price declines, income interruptions or other such factors in their borrowing decisions is not known. To some extent, such risks may be mitigated by the financial literacy of borrowers since those who are more financially capa-ble would be expected to better understand the risks associated with borrowing and how to best mitigate these risks.9
The question as to whether financial literacy is associ-ated with varying debt metrics has been studied previ-ously. Gerardi et al. (2010) found that lower financial literacy was associated with a higher probability of defaults and foreclosures in the U.S. housing market. Using data from the CFCS, Hurst (2011) examined the relationship between financial literacy and several indicators of financial insecurity, but found little rela-tionship between the two. This paper contributes to the literature by examining the relationship between household debt levels and financial literacy.
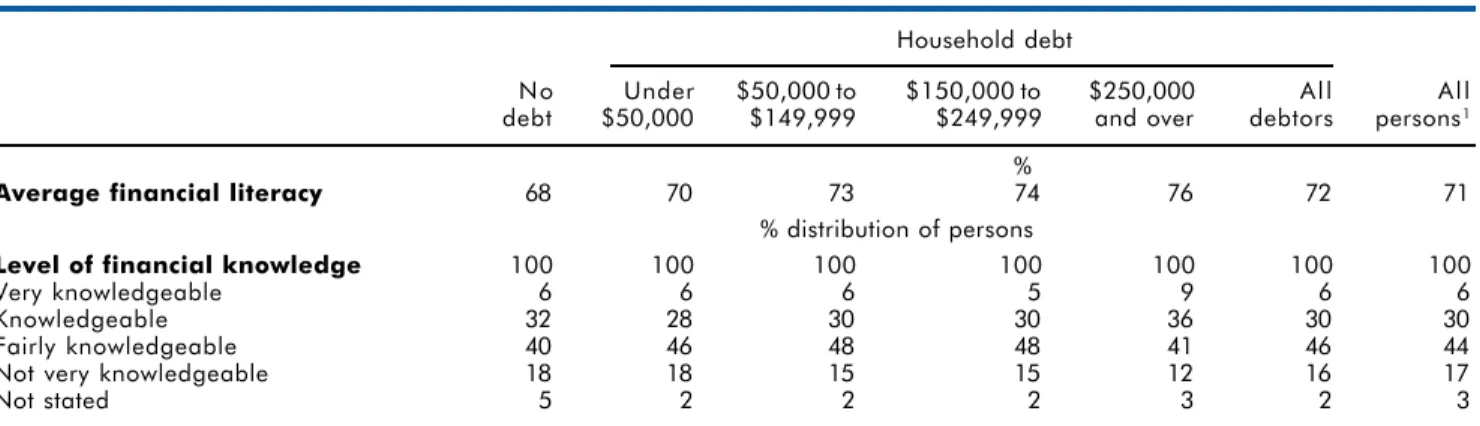
The CFCS measured the financial literacy of survey respondents by asking a series of questions on finan-cial principles and practices, which can be used to test whether the presence, type or amount of debt is cor-related with financial literacy (see Appendix for the questions and answers). The financial literacy score is the sum of correct responses to these questions. In 2009, those who had some kind of debt obtained an average score of 72% on the financial quiz, compared to an average of 68% among those without debt (Table 4). The score was higher among those who had at least $250,000 in debt (representing about 13% of debtors), who averaged 76%, while those who had less than $50,000 in debt averaged 70%.
Because these questions comprise just one method of estimating the overall financial knowledge of individu-als, other measures of financial literacy were exam-ined. One alternative was to examine how respondents perceived their own financial knowledge. About one-half of those owing at least $250,000 reported them-selves as “knowledgeable” or “very knowledgeable” in financial matters, compared to just over one-third Table 3 Gini coefficients of household debt
and income before tax among debtors
Debt Income
outstanding before tax Gini coefficient Total 0.611 0.372 Age Under 45 0.583 0.347 45 to 64 0.614 0.382 65 and over 0.739 0.439 Household type Unattached individuals 0.669 0.387
Married couples only 0.612 0.342
Married couples with children
and/or relatives 0.541 0.326
Lone parents 0.628 0.479
Others 0.710 0.394
Education1
Less than postsecondary 0.635 0.382
Postsecondary: non-university 0.602 0.339 Postsecondary: university 0.572 0.352 Household income before tax Under $50,000 0.691 0.220 $50,000 to $99,999 0.553 0.113 $100,000 and over 0.559 0.228 Region Atlantic 0.560 0.368 Quebec 0.602 0.352 Ontario 0.589 0.364
Manitoba and Saskatchewan 0.585 0.349
Alberta 0.579 0.389
British Columbia 0.632 0.381
Tenure1
Owner without a mortgage 0.747 0.408
Owner with a mortgage 0.485 0.329
Renter 0.693 0.391
1. Excludes those with missing information on this characteristic. Source: Statistics Canada, Canadian Financial Capability Survey, 2009.
Household debt in Canada
Table 4 Financial literacy across categories of household debt
Household debt
No Under $50,000 to $150,000 to $250,000 All All
debt $50,000 $149,999 $249,999 and over debtors persons1
%
Average financial literacy 68 70 73 74 76 72 71 % distribution of persons
Level of financial knowledge 100 100 100 100 100 100 100
Very knowledgeable 6 6 6 5 9 6 6
Knowledgeable 32 28 30 30 36 30 30
Fairly knowledgeable 40 46 48 48 41 46 44
Not very knowledgeable 18 18 15 15 12 16 17
Not stated 5 2 2 2 3 2 3
1. Excludes those who did not answer the CFCS debt module.
Source: Statistics Canada, Canadian Financial Capability Survey (CFCS), 2009.
of other borrowers. These results, together with the higher scores obtained for high debtors, suggest that higher debt is in some way correlated with financial literacy.
However, the association between debt and financial literacy may not be straightforward. For example, it may be that high debtors are more knowledgeable about finances since they tend to have higher incomes (Keown 2011). Any examination of the link between household debt and financial literacy should therefore control for other factors that potentially correlate with financial knowledge.10 This can be done by estimating
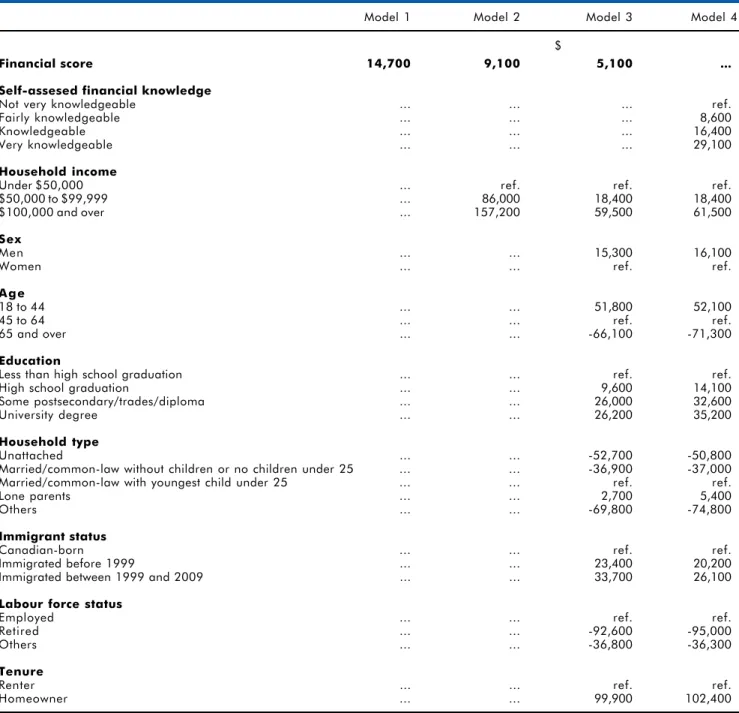
a Tobit model, with household debt as a dependent variable and financial literacy variables as independent variables. One advantage of the Tobit model is that it estimates the outcome within a specified range. This is important because the debt distribution is left-censored (meaning that no one can report “negative” debt amounts). Hence, the Tobit model accounts for the fact that a significant portion of the population is “left censored” (i.e., people without any debt). All results are expressed in additional debt dollars that an indi-vidual would incur if the independent variable increased by one unit (or, in the case of dummy variables, by how much debt levels vary from the reference category).
When only the financial scores and geographical controls are included in the model (Table 5, Model 1) the estimates suggest a relationship between debt and financial literacy since each unit increase in the financial score variable was associated with a $14,700 increase
in debt. However, when household income was included as a variable, the strength of the relationship was reduced (Model 2) to $9,100 with each additional point in the financial score variable. When a full set of controls was included (Model 3), the relationship between financial scores and debt became even weaker—to $5,100 per additional point.11
In fact, other variables also had a strong relationship with higher debt levels. Home ownership and house-hold income were both associated with higher debt levels. The debt of homeowners was estimated to be $100,000 above that of renters; similarly, the debt level of those who had at least $100,000 in household income was nearly $60,000 above that of people who had less than $50,000 in household income. An asso-ciation with higher levels of debt was also found among younger individuals, recent immigrants, highly educated people and employed individuals. Con-versely, lower levels of debt were found among older individuals, retired people, and people in families without children.12
Another model was estimated using self-assessed financial knowledge variables instead of financial test scores (Table 5, Model 4). In line with the test results, this model revealed a positive relationship between debt and individuals’ own assessment of their financial knowledge. Those who said they were knowledgeable about managing household finances held more debt than those who said they were not very knowledge-able. For example, the debt level associated with those who said that they were “very knowledgeable” was
Household debt in Canada
Table 5 Results from estimating a Tobit model of household debt1
Model 1 Model 2 Model 3 Model 4
$
Financial score 14,700 9,100 5,100 ... Self-assesed financial knowledge
Not very knowledgeable ... ... ... ref.
Fairly knowledgeable ... ... ... 8,600
Knowledgeable ... ... ... 16,400
Very knowledgeable ... ... ... 29,100
Household income
Under $50,000 ... ref. ref. ref.
$50,000 to $99,999 ... 86,000 18,400 18,400
$100,000 and over ... 157,200 59,500 61,500
Sex
Men ... ... 15,300 16,100
Women ... ... ref. ref.
Age
18 to 44 ... ... 51,800 52,100
45 to 64 ... ... ref. ref.
65 and over ... ... -66,100 -71,300
Education
Less than high school graduation ... ... ref. ref.
High school graduation ... ... 9,600 14,100
Some postsecondary/trades/diploma ... ... 26,000 32,600
University degree ... ... 26,200 35,200
Household type
Unattached ... ... -52,700 -50,800
Married/common-law without children or no children under 25 ... ... -36,900 -37,000
Married/common-law with youngest child under 25 ... ... ref. ref.
Lone parents ... ... 2,700 5,400
Others ... ... -69,800 -74,800
Immigrant status
Canadian-born ... ... ref. ref.
Immigrated before 1999 ... ... 23,400 20,200
Immigrated between 1999 and 2009 ... ... 33,700 26,100
Labour force status
Employed ... ... ref. ref.
Retired ... ... -92,600 -95,000
Others ... ... -36,800 -36,300
Tenure
Renter ... ... ref. ref.
Homeowner ... ... 99,900 102,400
1. Dependent variable: total household debt. The coefficient denotes the difference in debt between the reference group (ref.) and a given characteristic category. All differences were significantly different at the 0.01 level with the exception of that pertaining to “lone parents” in Model 3.
Note: All models also controlled for provincial differences.
Household debt in Canada
Table 6 Percentage of total respondents by attributes on financial variables
Household debt
No Under $50,000 to $150,000 to $250,000 All All
debt $50,000 $149,999 $249,999 and over debtors persons1
%
Good or very good at...
Keeping track of money 72 66 69 67 68 67 69
Making ends meet 82 75 77 77 80 77 78
Shopping around to get best products 59 61 65 66 69 64 62
Staying informed on financial issues 51 44 48 48 55 47 49
Agree with the following statements
I enjoy dealing with financial matters 43 39 43 45 49 42 42
I trust professional advisors 52 60 62 62 59 61 58
I get advice from friends and family 40 47 43 47 45 46 44
I got a clear idea of financial
products needed 76 72 74 73 78 74 74
I keep a close watch on financial affairs 83 82 82 82 84 82 82
I know enough about investments
to make right choices 58 49 54 53 61 53 54
I always research my choices thoroughly 73 71 72 74 78 73 73
Ever regretted financial decision 36 45 50 50 58 49 45
Received financial advice for...
Retirement planning 17 21 29 29 30 25 23
Children’s education 3 8 12 14 18 12 9
Estate planning 6 5 7 9 12 7 7
Insurance 8 15 19 25 27 19 15
Tax planning 10 11 16 17 23 15 13
General financial planning 22 24 30 31 37 29 26
Didn’t use any advice 63 55 48 44 40 50 54 1. Excludes those who did not answer the CFCS debt module.
Source: Statistics Canada, Canadian Financial Capability Survey (CFCS), 2009.
$29,100 higher than that for those who said they were “not very knowledgeable.” The results were very simi-lar to Model 3 for other variables.
Financial perceptions and attitudes
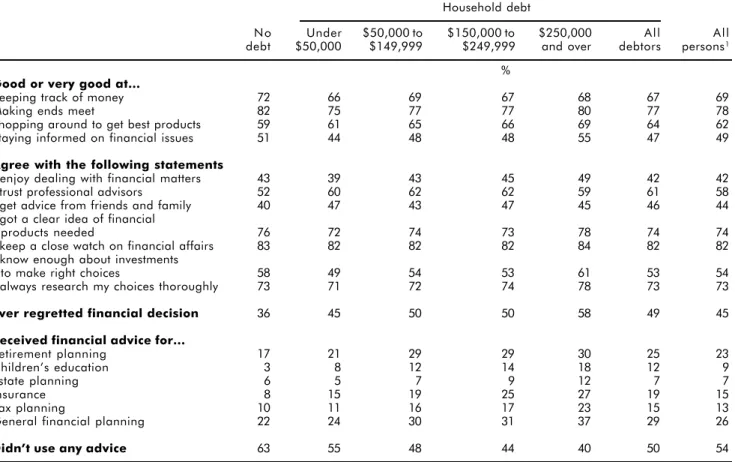
The CFCS also included questions to gauge the finan-cial perceptions and attitudes of Canadians (Table 6). Questions asked whether the respondent was “good or very good” at keeping track of money, making ends meet, shopping around to get the best financial prod-ucts, and staying informed on financial issues. The respondents were also asked whether they agreed with a series of statements meant to gauge their interest and attitude vis-à-vis financial matters. Finally, they were asked whether they received financial advice, and whether they ever made a financial decision they later regretted.
Borrowers with the highest levels of household debt (at least $250,000) were more likely to respond that they were good or very good at shopping around to get the best financial products (like loans and insur-ance rates) and staying informed on financial issues. In addition, they were also more likely to say that they “enjoyed financial matters,” “had a clear idea of finan-cial products needed,” “knew enough about invest-ments to make the right choices,” and “always researched their choices thoroughly”—thereby sug-gesting that high levels of debt may be associated with a greater interest in finances. On the other hand, 58% of individuals with at least $250,000 in household debt also reported that they had made a financial decision that they later regretted, compared to 45% of those with less than $50,000 in household debt and 36% of those with no debt at all.
Household debt in Canada
With regard to financial advice, individuals with debt of at least $250,000 were also more likely to seek financial advice on financing children’s education (18% versus 8% for those with debt less than $50,000), insurance (27% versus 15%), tax planning (23% versus 11%) and general financial planning (37% versus 24%). They were also less likely to report that they didn’t seek any advice at all, although 40% said they didn’t receive advice (compared to 63% among non-debtors).
Financial attitudes may also be correlated with other sociodemographic characteristics. Logit models were estimated to study the association between debt and key financial attitude variables: whether they regretted making some decisions, and whether they received financial advice (data not shown). As the descriptive results suggested, higher levels of debt corresponded to a higher likelihood of receiving financial advice and with financial regrets—even when other variables (like household income and education) were taken into account.
Conclusion
Increases in aggregate household debt burdens since the 1980s have renewed interest in household debt and underscored the risks to household balance sheets due to rising interest rates or falling asset prices. Given this situation, understanding the characteristics of borrow-ers, particularly those with higher levels of debt, facili-tates a greater understanding of the risks in the household sector. In particular, since holding debt of-ten involves a set of choices, understanding whether people with high levels of debt have corresponding levels of financial literacy is important.
As noted in earlier studies, the incidence and level of household debt are higher in certain population groups: younger homeowners, young families with children, the better-educated, and those with higher household incomes. Indeed, over 60% of household debt was held by those under 45 years of age, and nearly one-half was held by couples with children. Debt, however, was not equally distributed within
groups. Although they held a small portion of the total, household debt was more unequally distributed in populations that are considered more economically vulnerable, such as the less-educated, unattached indi-viduals and renters. This is consistent with previous research, which showed that these groups were more likely to experience financial insecurity (Hurst 2011).
Conversely, debt was more equally distributed among the better-educated, couples with children, people with higher household incomes, and mortgagees.
Although previous research found little evidence of a relationship between high debt ratios and financial lit-eracy (Hurst 2011), this study found that both financial literacy and self-assessed financial knowledge were as-sociated with higher absolute debt levels, even when other characteristics had been taken into account. How-ever, other characteristics—like home ownership and household income—were also strongly associated with higher debt loads. In addition to having better finan-cial knowledge, people with a larger household debt load (defined as those who had at least $250,000 in household debt) were more likely to perceive them-selves as good financial managers, and were more likely than others to seek financial advice on a variety of financial matters.
Notes
1. For other definitions of financial literacy used in recent literature, see Remund (2010). Also, the October 2011 issue of the Journal of Pension Economics and Finance
contains papers discussing financial literacy for a number of countries around the world.
2. This is consistent with estimates found in other reports (Sauvé 2011).
3. Marshall (2011) also finds higher levels of debt among high-income seniors. Higher levels of collateral assets and favourable lending conditions may also influence the borrowing practices of high-income households. 4. Among homeowners without a mortgage, their debt
was mostly related to lines of credit and credit cards. 5. Not all individuals have equal access to credit markets as
financial lenders ration credit. This also helps explain why lower-income groups and renters have smaller debt loads than others.
6. The 2009 CFCS collected information on indebtedness but not on amounts outstanding on the six types of consumer debt specified above.
7. A Gini coefficient is a measure of statistical dispersion generally used to measure the inequality of a distribution. The value of the Gini coefficient always lies between 0 and 1. A value closer to 1 indicates greater concentration (more inequality). Since the Gini coefficient is insensitive to the size of the variable of interest, it can be used to compare the dispersion of household debt relative to household income.
Household debt in Canada
Appendix CFCS financial quiz questions
A unique feature of the Canadian Financial Capability Survey is a series of 14 questions that were designed to test respondents’ knowledge of financial principles and practices. The questions and answers are the following:
1 . If the inflation rate is 5% and the interest rate you get on your savings is 3%, will your savings have at least as much buying power in a year’s time?
a) Yes b) N o
2 . A credit report is... ?
a) A list of your financial assets and liabilities b) A monthly credit card statement
c ) A loan and bill payment history d) A credit line with a financial institution
3 . Who insures your stocks in the stock market?
a) The National Deposit Insurance Corporation b) The Securities and Exchange Commission c ) The Bank of Canada
d) No one
4 . True or false...
By using unit pricing at the grocery store, you can easily compare the cost of any brand and any package size.
a) True b) False
5 . If each of the following persons had the same amount of take home pay, who would need the greatest amount of life insurance?
a) A young single woman with two young children b) A young single woman without children
c ) An elderly retired man, with a wife who is also retired
d) A young married man without children
6 . If you had a savings account at a bank, which of the following statements would be correct con-cerning the interest rate that you would earn on this account?
a) Sales tax may be charged on the interest that you earn
b) You cannot earn interest until you pass your 18th birthday
c ) Earnings from savings account interest may not be taxed
d) Income tax may be charged on the interest if your income is high enough
7 . Inflation can cause difficulty in many ways. Which group would have the greatest problem during periods of high inflation that lasts several years?
a) Young working couples with no children b) Young working couples with children c ) Older working couples saving for retirement d) Older people living on fixed retirement income
8 . Lindsay has saved $12,000 for her university expenses by working part-time. Her plan is to start university next year and she needs all of the money she saved. Which of the following is the safest place for her university money?
a) Corporate bonds b) Mutual Funds
c ) A bank savings account d) Locked in a safe at home e ) Stocks
9 . Which of the following types of investment would best protect the purchasing power of a family’s savings in the event of a sudden increase in inflation?
a) A twenty-five year corporate bond
b) A house financed with a fixed-rate mortgage c ) A 10-year bond issued by a corporation d) A certificate of deposit at a bank
10. Under which of the following circumstances would it be financially beneficial to borrow money to buy something now and repay it with future income?
a) When something goes on sale
b) When the interest on the loan is greater than the interest obtained from a savings account
c ) When buying something on credit allows someone to get a much better paying job
d) It is always more beneficial to borrow money to buy something now and repay it with future income
11. Which of the following statements is not correct about most ATM (Automated Teller Machine) cards?
a) You can get cash anywhere in the world with no fee b) You must have a bank account to have an ATM card c ) You can generally get cash 24 hours-a-day d) You can generally obtain information concerning
your bank balance at an ATM machine
12. Which of the following can hurt your credit rating?
a) Making late payments on loans and debts b) Staying in one job too long
c) Living in the same location too long
d) Using your credit card frequently for purchases
13. What can affect the amount of interest that you would pay on a loan?
a) Your credit rating b) How much you borrow
c) How long you take to repay the loan d) All of the above
14. Which of the following will help lower the cost of a house?
a) Paying off the mortgage over a long period of time b) Agreeing to pay the current rate of interest on the
mortgage for as many years as possible
c) Making a larger down payment at the time of purchase
d) Making a smaller down payment at the time of purchase
Answers
1) b 4) a 7) d 10) c 13) d
2) c 5) a 8) c 11) a 14) c
Household debt in Canada
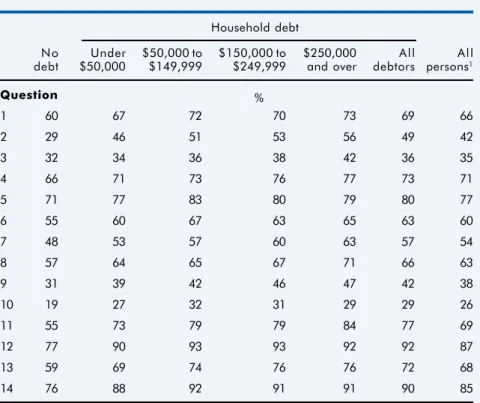
Table 7 shows the proportion of those who correctly answered questions within debt-size categories.
For some of the 14 questions, the dif-ference between categories of debt size was not very large but differences were larger for other categories. For in-stance, 56% of those in the highest category of debt size (at least $250,000) correctly answered Question 2 on the credit report, while only 46% of those with lower debt levels (less than $50,000) did so. Question 7 on inflation also showed relatively large differences in the proportions of cor-rect answers given between the larger and lower debt groups (63% versus 53%), as did Question 11 on ATM machines (84% versus 73%). Other questions showing notable differences between higher and lower debtors included Question 3 about the insur-ance of stocks, Question 8 about the safety of placements, Question 9 about options to protect the loss of purchas-ing power, and Question 13 about the factors influencing the interest rate of a loan. In all cases, the high debtors fared better than those with lower levels of debt. More information about the CFCS financial capability questions can be found in McKay (2011).
Table 7 Proportion who correctly answered financial quiz question
Household debt
No Under $50,000 to $150,000 to $250,000 All All
debt $50,000 $149,999 $249,999 and over debtors persons1
Question % 1 60 67 72 70 73 69 66 2 29 46 51 53 56 49 42 3 32 34 36 38 42 36 35 4 66 71 73 76 77 73 71 5 71 77 83 80 79 80 77 6 55 60 67 63 65 63 60 7 48 53 57 60 63 57 54 8 57 64 65 67 71 66 63 9 31 39 42 46 47 42 38 10 19 27 32 31 29 29 26 11 55 73 79 79 84 77 69 12 77 90 93 93 92 92 87 13 59 69 74 76 76 72 68 14 76 88 92 91 91 90 85
1. Excludes those who did not answer the CFCS debt module.
Source: Statistics Canada, Canadian Financial Capability Survey (CFCS), 2009.
Appendix CFCS financial quiz questions (concluded)
8. Accordingly, Hurst (2011) found that individuals in these categories were more likely to have a higher total debt-service ratio, a higher debt-to-pre-tax household income ratio, and a higher debt-to-asset ratio, even after accounting for all other socioeconomic characteristics. Hurst limited his population to those under age 65. 9. See Department of Finance Canada (2010) for a
discus-sion on the importance of financial literacy.
10. In addition, there is a possibility of causality between debt and financial literacy but the direction of causality is not clear. Debt may motivate borrowers to become more knowledgeable about their finances. Alternatively, increased financial capability may affect the type or level of debt. This paper does not attempt to draw any causal inferences but focuses on associations.
11. A referee pointed out that questions 9 and 10 on the financial quiz could have more than one correct answer. Additional models were estimated by recalculating the financial score in two ways: (a) by having multiple correct
answers for those two questions; and (b) by excluding those two questions. The conclusions did not change. 12. Models were also estimated using quartiles of financial
scores instead of numbers, and quartiles of income instead of the three groups. The conclusions did not change.
References
Brighton, J.W. and J.A. Connidis. 1982. Consumer Bank-rupts in Canada . Ottawa. Policy Research, Analysis and Liaison Directorate, Policy Coordination Bureau, Consumer and Corporate Affairs Canada. 126 p. Browning, Martin and Thomas F. Crossley. 2001. “The life-cycle model of consumption and saving.” The Jour-nal of Economic Perspectives. Vol. 15, no. 3. Summer. p. 3-22.
h t t p : / / p u b s . a e a w e b . o r g / d o i / p d f p l u s / 1 0 . 1 2 5 7 / jep.15.3.3 (accessed March 2, 2012).
Household debt in Canada
Chawla, Raj K. 2011. “The distribution of mortgage debt in Canada.” Perspectives on Labour and Income. Vol. 23, no. 2. Summer. Statistics Canada Catalogue no. 75-001-X. p. 1-12.
http://www.statcan.gc.ca/pub/75-001-x/2011002/pdf/ 11429-eng.pdf (accessed March 2, 2012).
Department of Finance Canada. 2010. Canadians and Their Money: Building a Better Financial Future. Report of Recommendations on Financial Literacy. Catalogue no. F2-198/2011E-PDF. Ottawa. Task Force on Finan-cial Literacy, Department of Finance Canada. 106 p. http://publications.gc.ca/collections/collection_2011/ fin/F2-198-2011-eng.pdf (accessed March 2, 2012). Friedman, Milton. 1957. A Theory of the Consumption Function. Princeton, New Jersey. Princeton University Press. 259 p.
Gerardi, Kristopher, Lorenz Goette and Stephan Meier. 2010. Financial Literacy and Subprime Mortgage Delinquency: Evidence from a Survey Matched to Administrative Data. Federal Reserve Bank of Atlanta Working Paper Series. Working Paper 2010-10. April. Federal Reserve Bank of Atlanta. 54 p.
http://www.frbatlanta.org/documents/pubs/wp/ wp1010.pdf (accessed March 2, 2012).
Hurst, Matt. 2011. “Debt and family type in Canada.”
Canadian Social Trends. No. 91. Summer. Statistics Canada Catalogue no. 11-008-X. p. 38-47.
http://www.statcan.gc.ca/pub/11-008-x/2011001/arti-cle/11430-eng.pdf (accessed March 2, 2012).
Keown, Leslie-Anne. 2011.“The financial knowledge of Canadians.” Canadian Social Trends. No. 91. Summer. Statistics Canada catalogue no. 11-008-X.
http://www.statcan.gc.ca/pub/11-008-x/2011001/arti-cle/11413-eng.htm (accessed March 2, 2012).
Marshall, Katherine. 2011. “Retiring with debt.”
Perspectives on Labour and Income. Vol. 23, no. 2. Sum-mer. Statistics Canada Catalogue no. 75-001-X. p. 1-12. http://www.statcan.gc.ca/pub/75-001-x/2011002/pdf/ 11428-eng.pdf (accessed March 2, 2012).
McKay, Stephen. 2011. Understanding Financial Capability in Canada: Analysis of the Canadian Financial Capability Survey. Research paper prepared for the Task Force on Financial Literacy. University of Birmingham, United Kingdom. 47 p.
http://publications.gc.ca/collections/collection_2011/ fin/F2-213-2011-eng.pdf (accessed March 2, 2012). Modigliani, Franco and Richard Brumberg. 1954. “Util-ity analysis and the consumption function: An interpre-tation of cross-section data.” Post-Keynesian Economics.
Kenneth K. Kurihara (ed.). New Brunswick, New Jersey. Rutgers University Press. p. 388-436.
Remund, David L. 2010. “Financial literacy explicated: The case for a clearer definition in an increasingly com-plex economy.” The Journal of Consumer Affairs. Vol. 44, no. 2. Summer. p. 276-295.
http://onlinelibrary.wiley.com/doi/10.1111/j.1745-6606.2010.01169.x/pdf (accessed March 2, 2012). Sauvé, Roger. 2011. The Current State of Canadian Family Finances: 2010 Report. Vol. 12. February. Ottawa. The Vanier Institute of the Family. 44 p.
http://www.vifamily.ca/media/node/783/attachments/ familyfinance2010.pdf (accessed March 2, 2012). Schwartz, Saul. 1999. “The empirical dimensions of consumer bankruptcy: Results from a survey of Cana-dian bankrupts.” Osgoode Hall Law Journal. Vol. 37, nos. 1 & 2. p. 83-125.
h t t p : / / w w w . o h l j . c a / a r c h i v e / a r t i c l e s / 37_12_schwartz_ed.pdf (accessed March 2, 2012). Statistics Canada. 2011. “Table 2: Household sector in-dicators – Not seasonally adjusted.” National balance sheet accounts. The Daily. December 13. Statistics Canada catalogue no. 11-001-XIE.
http://www.statcan.gc.ca/daily-quotidien/111213/ t111213a2-eng.htm (accessed March 2, 2012).
TD Economics. 2011. Assessing the Financial Vulnerabil-ity of Households Across Canadian Regions. Special Report. February 9. Toronto. 8 p.
http://www.td.com/document/PDF/economics/spe-cial/td-economics-special-db0211-householddebt.pdf (accessed March 2, 2012).