CENTRAL MANCHESTER UNIVERSITY HOSPITALS NHS
FOUNDATION TRUST
Report of: Director of Patient Services/Chief Nurse
Paper prepared by: Deputy Director of Nursing (Quality)
Date of paper: June 2012
Subject: Annual Complaints Report 2011/2012
Purpose of paper: To provide the Trust Board with the complaints management performance for the year 2011/12
Executive Summary
The Trust adheres to the statutory instrument 309 which requires NHS bodies to provide an annual report on its complaints handling, which must be made available to the public. This report provides an overview of the Trust’s Patient Advice and Liaison Service (PALS) and complaint activity between the 1st April 2011 and the 31st March 2012.
The PALS service received 2432 contacts during the year which is a reduction of 11% compared to the previous year. Most of these contacts receive a timely resolution to their concerns through the PALS service liaising with the appropriate teams. Royal Manchester Children’s Hospital (RMCH) received the highest number of PALS queries but saw a reduction of 22% compared to the previous year. The Division of Specialist Medicine saw a considerable rise in the number of concerns raised. For the second year PALS did not see Red rated cases being raised by patients or relatives. Key themes raised were broadly consistent with previous years.
The Trust received 705 written complaints in year which required a Chief Executive response; this is an 8% reduction on the previous year. For the third year running RMCH received the highest number of complaints but saw a reduction of 15%. Cases graded as red have again remained low, and the number of amber rated cases has reduced.
Whilst the national standard response time of 25 working days was removed in 2009 the Trust has retained the internal default standard as a quality marker. Agreement has been reached with commissioners that we will agree any extension to the response with the complainant, however complaint response times have deteriorated (by 9%) to 84% compared to 93% last year. Complaint themes have remained consistent however, concerns relating to staff attitude in both PALS contacts and complaints have increased, these had fallen in the previous year.
The number of meetings held with patients and or their relatives has again increased, 105 compared to 80 the previous year.
referred to them in year; however one case relating to the Community Services which predates the Trust responsibility for these services has been upheld, this will be noted in the PHSO report of this year.
The Trust can identify a number of significant improvements made as a result of actions taken from complaint investigations. The Complaint Review Group has continued to meet monthly and is continuing to refine the complaints process whilst providing a robust assurance mechanism.
This report provides information for planned improvements to the complaints process for the year 2012/2013 and also sets out the progress made by both the Divisions and the PALS and complaints team, who work in partnership to meet the needs of patients and their families to ensure that complaints are used to improve services.
The Board of Directors is asked to note the content of this report and in line with statutory requirements give approval for it to be published on the Trust’s internet.
1. Introduction
1.1 The Trust adheres to the statutory instrument 309 which came into effect in April 2009. These require NHS bodies to provide an annual report on its handling and consideration of complaints, a copy of which must be available to the public. This report provides an overview of the Trust’s PALS and complaint activity between the 1st April 2011 and the 31st March 2012.
1.2 The Patient Advice and Liaison Services (PALS) is a well established brand within the Trust and across the NHS that patients, the public, staff and external organisations know they can approach in responding to health service queries and concerns. PALS provide a well used and cost effective service that has the flexibility to respond to ‘real time’ queries and concerns. This is complemented by the complaints service that liaises with and supports complainants, the Divisions and external agencies to provide thorough, concise written responses to complaints on behalf of the Chief Executive. 1.3 During this period 2011/12 the PALS service has continued to be delivered from the Manchester Royal Infirmary Outpatient Department and the Royal Manchester Children’s Hospital’s Family Support Centre. These locations are well signposted and known by regular visitors to the Trust and staff, making it easy for people to access the service.
2. PALS Activity
2.1 The PALS service received 2432 contacts during the year; this is a positive 11% decrease in contacts from 2010/11 and an overall reduction of 14% since 2009/10. Whilst the Trust recognises that an increase in contacts can indicate that patients and the public have confidence in contacting the service. The current decrease points to increased local resolution by operational staff at the time concerns are raised, removing the person’s need to seek PALS intervention.
2.2 Table 1 provides a breakdown of the number of PALS contacts per division. The Division of Medicine no longer exist as a stand alone division following its reorganisation in 2010.
Table 1 - PALS Contact
Division 2009/10 2010/11 2011/12
Not stated/General Enquiry 104 34 39
Clinical Scientific Services 54 94 72
Corporate Services 169 172 99
Dental Hospital 132 117 99
Division Of Medicine 606 157 -
Division of Medicine and Community Services n/a 167 203 Division of Specialist Medical Services n/a 199 348
Division Of Surgery 408 451 456
Manchester Royal Eye Hospital 427 408 297
Royal Manchester Children’s Hospital 714 725 567
Saint Mary's Hospital 205 202 252
2.3 Although the Royal Manchester Children’s Hospital generated the highest number of contacts there has been a positive decrease in the number of contacts in year and, the Division’s numbers are 22% down on 2010/11 figures. The Division of Specialist Medical Services saw a 43% increase on the previous year. The Division’s of Medicine and Community Services and Saint Mary's PALS contacts increased by 18% and 20% respectively.
2.4 Key issues emanating from these 3 Division’s centre on appointment delays and cancellations; communication with patients or their relatives, and treatment and procedure. The factors within the concerns are often multi-faceted but generally reflect reorganisation of administration processes, and rearranged clinics whilst clinical staff are being recruited.
2.5 Table 2 below gives a breakdown of the top 5 categories from the Division of Specialist Medical Services. A more detailed analysis of the contacts indicate that patients and/or their supporters raised concerns about bed availability in the Programmed Investigation Unit (PIU); delays in receiving test results and cancellation of their outpatient appointment. Also linked to concerns was insufficient communication with the patient or their relative and general nursing care. The Division of Specialist Medical Services staff work extremely well with PALS in obtaining a satisfactory resolution to concerns in order to support patients.
Table 2 – PALS Enquiries
PALS – Enquires No.
Consent/Communication/Confidentiality 105
App, Delay/Cancellation (OP) 96
Treatment/Procedure 75
Clinical Assessment (Diag/Scan) 37
Positive Experience 36
2.6 The embedding of new processes and systems within services particularly notable within the Royal Manchester Children’s Hospital and also Trust wide for the Division’s which have transferred into new facilities, has contributed to the reduction in PALS contacts. For RMCH issues such as facilities, outpatient appointments, cancelled appointments and car parking have particularly reduced.
2.7 General Enquiries and the Division of Surgery figures have remained relatively stable, whilst there has been a marked reduction in contacts in respect of Clinical Scientific Services (24%), Corporate Services (43%), the Dental Hospital (16%), and Manchester Royal Eye Hospital (27%). As stated, the reduction for the Eye Hospital has been due to resolving patient feedback issues predominantly associated with the move to the new hospital site.
Graph 1
PALS Contacts Per Month
0 50 100 150 200 250
Apr il
May June Ju ly
Aug ust
Sep tem
ber Oct
obe r
No vem
ber De
cem ber
Janu ray
Feb ruar
y Mar
ch
Month
N
u
m
b
e
r
2.9 PALS contacts by risk rating
2.9.1 PALS continue to grade contacts Green, Amber or Red based on the initial discussion with the enquirer. The PALS team refer to an adapted risk matrix to assist their grading of the concerns. Table 3 below denotes the risk category assigned to each contact, the score is reviewed by PALS at the end of their involvement to ensure it has accurately reflected the issues identified.
2.9.2 For the second consecutive year no red graded cases were brought to PALS attention by patients or their relatives. This has been very encouraging as it indicates that these concerns are rare and demonstrate a stronger reporting and understanding about incidents and complaints when correlated to feedback from Risk Management.
Table 3
Category 2009/10 2010/11 2011/12
Not Stated 13 0 0
Green 2424 2284 2155
Amber 374 445 277
Red 8 0 0
Total 2819 2729 2432
2.10 PALS cases by enquirer
2.10.1 The predominate enquirers to PALS were patients’ relatives followed closely by the patient’s themselves (table 4).
Table 4
Enquirer Type 2009/10 2010/11 2011/12
Not Stated 186 115 77
Patient 1183 1099 1046
Relative 1331 1405 1177
Carer Not stated Not stated 11
Hospital Staff 46 40 46
External Agency 73 70 63
Members of Parliament Not stated Not stated 12
Total 2819 2729 2432
2.10.2 Table 5 lists the age ranges and genders of the patients involved in the PALS contacts. The number of contacts received for the 0>18 age group reflects the volumes received for RMCH. The sections where the age and gender have not been captured relate to contacts that do not directly involve a patient and have not provided information that would indicate their gender.
2.10.3 The numbers received for the age range19>79 remain relatively stable, further scrutiny of PALS and complaints patient profiling will take place during 2012/13 to improve data capture and inform the Trust of any concealed themes.
Table 5
Age groups
Number Gender
0 > 18 531 Male 1147 19>29 285 Female 1278 30>39 295 Not known 7
40>49 287 50>59 229 60>69 295 70>79 283 80>89 147 90>99 30
100+ 1
Age not captured (not patients)
49
Total 2432
2.10.4 Table 6 provides the ethnic backgrounds of the patients referred to within the contacts.
Table 6
Category Number
Any Other Ethnic Group 30
Asian or Asian British : Bangladeshi 8
Asian or Asian British : Indian 30
Asian or Asian British : Other Asian 19 Asian or Asian British : Pakistani 84 Black or Black British : Black African 14 Black or Black British : Black Caribbean 28 Black or Black British : Other Black 9 Chinese or Other Ethnic Group Chinese 2
Mixed : Other Mixed 13
Mixed : White & Asian 7
Mixed : White & Black African 6 Mixed : White & Black Caribbean 13
Not Stated 629
White : British 1456
White : Irish 45
White : Other White 39
Total 2432
2.11 Reason for PALS contact
23.11.1 Table 7 provides the leading themes why people contacted PALS over the past three years as follows;
Table 7
Category 2009/10 2010/11 2011/12
Communication 772 640 795
Appointment Delay/Cancellation 695 616 549
Treatment / Procedure 569 559 722
Violence, Discrimination, Inappropriate Behaviour (inc. Staff attitude)*
296 182 6
Infrastructure, Staffing Environment 147 138 -
Attitude of Staff - - 217
Positive Experience - - 205
*Category updated removing staff attitude to make it a stand alone subject for 2011/12 2.11.2 The majority of the categories have remained the same; of note PALS have received an increasing number of contacts in which patients and the public have asked PALS to pass on their thanks for the positive experience they received at the Trust. This has led the category’s entry to the top 5 for the first time.
3.1 The Trust received 705 written complaints for the year 2011/12, in which the complainant requested a Chief Executive response. This is 8% decrease and reflects the trend captured in PALS regarding improved responses and management of patients and visitors dissatisfaction at the time they are raised. Table 8 lists a breakdown over the past three years.
Table 8
Year 2009/2010 2010/2011 2011/12
Complaints Received 749 767 705
3.1.1 The age ranges and genders of the patients involved in the complaints are captured in table 9.
Table 9 Age groups
Number Gender
0 > 18 169 Male 297
19>25 46 Female 389
26>40 126 Not known 18
41>60 143 61>70 64 71>80 57 81>90 31
91+ 8
Age not captured 61
Total 705
3.1.2 Table 10 contains the ethnic origins of the patients represented within the complaints.
Table 10
Category Number
Any Other Ethnic Group 6
Asian or Asian British : Bangladeshi 1
Asian or Asian British : Indian 5
Asian or Asian British : Other Asian 5 Asian or Asian British : Pakistani 24 Black or Black British : Black African 4 Black or Black British : Black Caribbean 11 Black or Black British : Other Black 3 Chinese or Other Ethnic Group Chinese 2
Mixed : White & Black African 1 Mixed : White & Black Caribbean 1
Not Stated 312
White : British 293
White : Irish 10
White : Other White 15
Total 705
3.2 Table 11 represents the number of complaints received per Divisions; there have been some minor fluctuations with the number of complaints received by each Division. Similar to the PALS data the Royal Manchester Children’s Hospital has received the highest number of complaints, in comparison to the other Divisions; however, they have had an overall reduction of 15% in the total number of complaints received.
Table 11
Divisions 2009/2010 2010-11 2011-12
RMCH 238 173 147
Clinical Scientific Services 21 26 18
Corporate Services 26 25 15
Dental Hospital 17 22 27
Division Of Medicine 152 23 -
Division of Medicine and
Community Services n/a 88 103
Division of Specialist Medical
Services n/a 62 64
Division Of Surgery 100 133 138
Manchester Royal Eye Hospital 85 83 58
Saint Mary's Hospital 110 101 114
External - 31 21
Total 749 767 705
3.3 Complaint risk ratings
3.3.1 Complaints continue to be categorised by PALS to ensure a proportionate response is provided to the issues raised. These are provided in table 12. The majority of cases continue to be rated Green and there has been a positive reduction in the number graded as Amber by 29%. Whilst the number of cases assessed as Green has remained relatively static red graded complaints have remained low.
Table 12
Category 2009/10 2010/11 2011/12
Not Stated 14 27 19
GREEN 276 421 433
AMBER 432 341 244
3.4.1 The Trust has retained the internal default standard response time of 25 working days, in addition to negotiating a timely final response date with the complainants and the respective Division(s), which is in proportion the issues raised within their complaint.
3.4.2 PALS produce a weekly performance report to monitor the progress of every complaint within the Trust, and works with the respective Divisions in the delivery of their complaints responses.
3.4.3 Adhering to the response date and providing a high quality response in the allocated time frame continues to present a challenge for some Divisions, however the Royal Eye Hospital and Dental Hospital along with Corporate Services have consistently performed well. PALS continue to explore various methods of meeting the timescales agreed with the complainants.
3.4.4 The Trust can renegotiate the response deadline with complainants; this has assisted in maintaining the overall Trust response times. Disappointingly, however the Trust overall performance times dipped by 9% during 11/12.
Table 13
Target 2009/2010 2010-2011 2011/12
Achievement of target response time against agreed timescale
749 (72.5%) 767 (93%) 705 (84%)
3.4.5 Table 14 provides the Divisional response rates. It is important to note that the patient journey often involves several Divisions including diagnostic and support service. For example, although Clinical Scientific Services led on 18 cases they contributed to a further 90 cases. The impact of investigating concerns across services and departments can build delays into the responses.
Table 14
Divisions Percentage
responded to within agreed time
period
Number of Complaints over the agreed
date
RMCH 87% 19/147
Clinical Scientific Services 87% 3/18
Corporate Services 100% -
Dental Hospital 100% -
Division of Medicine and Community Services
93% 7/103
Division of Specialist Medical Services
80% 13/64
3.6 Complaint themes
3.6.1 The top three main themes for complaints are detailed in table 15; these have been consistent with the previous year however the number of times they have been referred to within complaints has increased. In addition, complaints relating to staff attitude have increased.
Table 15
Category 2009/2010 2010/2011 2011/12
Clinical Assessment (Diag/Scan) 201 147 320
Treatment / Procedure 189 175 287
Consent/Comms/Confidentiality 159 121 236
3.6.2 Table 16 outlines the number of concerns directly related to attitude of staff from PALS contacts and Complaints, which have risen by 17% from the previous year.
Table 16
Attitude of Staff 2010/2011 2011/12
PALS 153 217
Complaints 47 123
Total 200 240
3.7 Complaints received from Members of Parliament Table 17
Division 2009/2010 2010/11 2011/12
Clinical Scientific Services 0 2 1
Corporate Services 5 0 0
Dental Hospital 1 1 0
Division Of Medicine 7 0 n/a
Division of Medicine and Community
Services n/a 6 0
Division of Specialist Medical Services n/a 4 1
Division Of Surgery 1 2 5
Royal Manchester Children’s Hospital 10 14 12
Manchester Royal Eye Hospital 0 6 4
St Marys Hospital 4 2 1
Total 28 37 24
3.7.1 The above table displays the number of complaints received from the individual complainants Member of Parliament, who had brought the complaint on behalf of their constituents. As with the general trend the numbers of MP letters have reduced this time year by 35% on the previous year’s figures.
3.8.1 In 2011/12 the Trust held 105 meetings with patients and/or their relatives; this is a 24% increase on 2010/11. Complaint meetings remain a constructive method for staff both to listen to and feedback to patients and their relatives experience and concerns. The scheduling of a timely meeting continued to present a challenge for the organisation however, often because of clinician availability. The Divisions have wholeheartedly engaged in this process due to the general satisfactory outcomes for the complainants and staff.
4. Independent Review of the Complaints Process
4.1 The Parliamentary and Health Service Ombudsman (PHSO) represents the second and final stage of the NHS complaints process. The Trust works closely with the PHSO offices to respond to issues raised to them by complainants.
4.2 In 2011/12 the PHSO received 71 enquires about the Trust, and requested information in relation to 21 of those cases for further assessment. For two cases the Trust agreed to undertake interventions; this is when the Trust agrees to carry out actions identified by the PHSO as an alternative to a full investigation in order to resolve a complaint.
4.3 One case was closed after the complainant withdrew their complaint, and the PHSO closed another case because they were unable to investigate further due to the inability to locate the health records. The case will be referred back to the PHSO when the notes are located. The PHSO are still in the process of considering one case.
4.4 The Trust also responded to a complaint that had been fully upheld by the PHSO. This related to an incident which occurred in 2009 within Central Manchester Community Services. The PHSO decision to fully uphold the case was reached in October 2011, because the Trust had taken over responsibility for Community Services by that time we were required to act on the recommendations, which were successfully completed in February 2012. Regrettably, this case will show against the Trust in the PHSO 2011/12 annual report.
4.5 The remaining 15 cases were not upheld by the PHSO, no further actions were required. This continues to demonstrate that the Trust’s thorough investigations and responses whether via a meeting or written response are to a high standard.
4.6 Table 18 denotes the Divisions where the PHSO cases emanated from and their grading by the Trust. It is important to note that several Divisions can be involved in cases.
Table 18
Division 2011/12 Green Amber Red
Clinical Scientific Services 2 0 2 0
Corporate Services 1 0 1 0
Services
Division of Specialist Medical Services 3 1 2 0
Division of Surgery 5 0 5 0
Manchester Royal Eye Hospital 3 1 1 1
Royal Manchester Children’s Hospital 1 0 1 0
Saint Mary's Hospital 4 1 3 0
4.7 The rationale for a complainant to refer their case to the PHSO is not based entirely on the seriousness of their case, as different factors such as the management of the complaint itself can add to a person’s dissatisfaction and loss of confidence in the response.
4.8 PHSO cases are monitored on a weekly basis through the PALS Key Performance Indicator process, and actions are supervised through the divisional governance systems.
5. Service Improvements as a result of learning from complaints
5.1 It is crucial that the Trust embeds learning from complaints within its organisational memory through the service improvements identified from outcomes of investigations. The Divisions are accountable for implementing service improvements as a result of lessons learned from patient feedback which is monitored through the governance systems. Below are just a few examples of improvements undertaken this year:
5.1.2 Examples of changes implemented in the Divisions as a result of complaints • Improved system within ENT outpatient department to minimise waiting times,
also to enhance the patient experience in the department 2 televisions have been installed. The management team also organised for the WRVS trolley to visit the department.
• GP referrals are now referred in directly to MAU/15 rather than accessing the Trust via the Emergency Department, which was a common complaint by patients previously. The new referral pathway aims to reduce delays to being seen by a clinician, avoids delays in a busy Emergency Department and improves the patient experience.
• The Trust is currently in the process of arranging the installation of an onsite ATM machine. This is following comments from patients and visitors regarding the lack of close access to banking facilities.
• Implementation of a secondary checking process for appointment letters. Following a complaint in which an appointment letter was not received by the patient, causing a delay in treatment, the team in the orthotic department reviewed procedures and implemented a system whereby all appointments made would be cross checked against all letters generated.
• UDH have implemented a system of text messaging and voicemail reminder system for outpatient appointments, this has led to reduction in DNA rates also. • Development of Adolescent Intravenous Sedation Service as a result of parent’s
complaints about length of waiting times.
• Implementation of new telephone management system to improve accessibility for patients.
5.3.1 A number of complaints throughout 2011-12 have led to Retail Catering Outlets introducing payment by credit and debit cards; the possibility of cash back facility is being explored for the future.
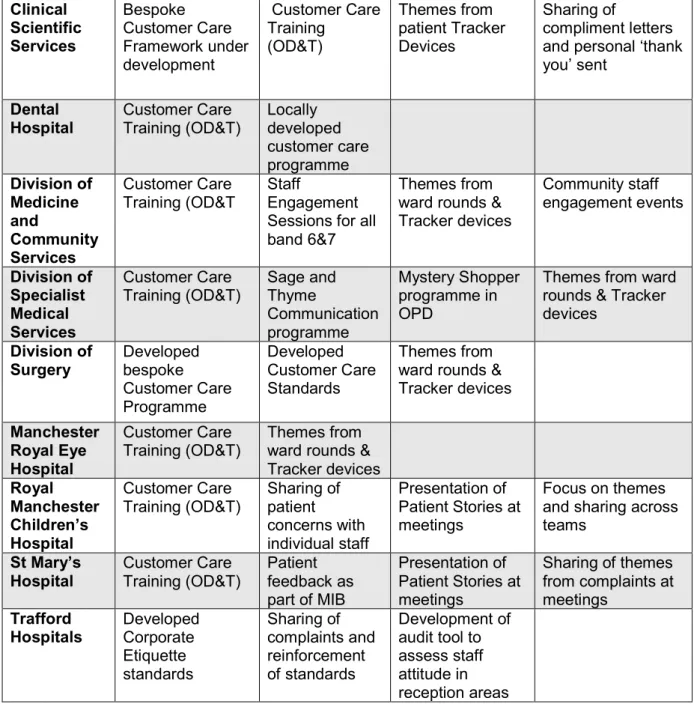
5.3.2 The Divisions have engaged in year in a number of activities in year in line with the increased number of complaints related to staff attitude. This have been a positive response to the identification of themes in year, Table 19 below is an example of some of the initiatives.
Table 19 Clinical Scientific Services Bespoke Customer Care Framework under development Customer Care Training (OD&T) Themes from patient Tracker Devices Sharing of compliment letters and personal ‘thank you’ sent Dental Hospital Customer Care Training (OD&T) Locally developed customer care programme Division of Medicine and Community Services Customer Care Training (OD&T Staff Engagement Sessions for all band 6&7
Themes from ward rounds & Tracker devices Community staff engagement events Division of Specialist Medical Services Customer Care Training (OD&T) Sage and Thyme Communication programme Mystery Shopper programme in OPD
Themes from ward rounds & Tracker devices Division of Surgery Developed bespoke Customer Care Programme Developed Customer Care Standards Themes from ward rounds & Tracker devices Manchester Royal Eye Hospital Customer Care Training (OD&T) Themes from ward rounds & Tracker devices Royal Manchester Children’s Hospital Customer Care Training (OD&T) Sharing of patient concerns with individual staff Presentation of Patient Stories at meetings
Focus on themes and sharing across teams St Mary’s Hospital Customer Care Training (OD&T) Patient feedback as part of MIB
Presentation of Patient Stories at meetings
Sharing of themes from complaints at meetings Trafford Hospitals Developed Corporate Etiquette standards Sharing of complaints and reinforcement of standards Development of audit tool to assess staff attitude in reception areas
6. Demonstrating compliance with legislative requirements
• PHSO feedback continues to be supportive of the Trust’s processes and performance with complaints management.
• Monitoring of complaint processes against level 3 NHSLA standards is continuing
• The Complaint Review Group, chaired by a Non Executive Director and supported by Associate Medical Director continues to meet monthly. In 2011/12 it held 10 meetings with the Division’s with the recommendations made by the group used to build upon the quality of the complaints and the management processes.
7. Ongoing Developments to the Complaint Process
Areas for development in 2012/2013
• Build upon complaints management training for staff in particular Trafford colleagues to support their integration to the Trust.
• Review the setting of timescales for responses with complainants to ensure that this is realistic based on the complexity of the complaint
• Continue to explore a more structured timeframe in which to provide meetings between complainants and Trust staff.
• Develop the dissemination of feedback from the Complaints Review Group into PALS and Divisional complaints management processes.
• Strengthen central and divisional complaints management processes to minimise the need to request extensions.
• Strengthen assurance by including a governor/lay representative in the complaints review panel
• Take patient stories from complaints to the clinical effectiveness scrutiny committee
8. Conclusion
The Board of Directors is asked to note the content of this report, and in line with statutory requirements give approval for it to be published on the Trust’s internet site.