Density Wave Probes Cuprate Quantum Phase Transition
Tatiana A. Webb,1 Michael C. Boyer,2,3 Yi Yin,1,*Debanjan Chowdhury,3 Yang He,1 Takeshi Kondo,4,† T. Takeuchi,4,‡ H. Ikuta,4,§ Eric W. Hudson,5Jennifer E. Hoffman,1,¶ and Mohammad H. Hamidian1,**
1Department of Physics, Harvard University, Cambridge, Massachusetts 02138, USA 2
Department of Physics, Clark University, Worcester, Massachusetts 01610, USA
3Department of Physics, Massachusetts Institute of Technology, Cambridge, Massachusetts 02139, USA 4
Department of Crystalline Materials Science, Nagoya University, Nagoya 464-8603, Japan 5Department of Physics, Pennsylvania State University, University Park, Pennsylvania 16802-6300, USA
(Received 18 November 2018; published 1 May 2019)
In cuprates, the strong correlations in proximity to the antiferromagnetic Mott insulating state give rise to an array of unconventional phenomena beyond high-temperature superconductivity. Developing a complete description of the ground-state evolution is crucial to decoding the complex phase diagram. Here we use the structure of broken translational symmetry, namely,d-form factor charge modulations in ðBi;PbÞ2ðSr;LaÞ2CuO6þδas a probe of the ground-state reorganization that occurs at the transition from truncated Fermi arcs to a large Fermi surface. We use real space imaging of nanoscale electronic inhomogeneity as a tool to access a range of dopings within each sample, and we definitively validate the spectral gap Δ as a proxy for local hole doping. From the Δ dependence of the charge modulation wave vector, we discover a commensurate-to-incommensurate transition that is coincident with the Fermi-surface transition from arcs to large hole pocket, demonstrating the qualitatively distinct nature of the electronic correlations governing the two sides of this quantum phase transition. Furthermore, the doping dependence of the incommensurate wave vector on the overdoped side is at odds with a simple Fermi-surface-driven instability.
DOI:10.1103/PhysRevX.9.021021 Subject Areas: Strongly Correlated Materials, Superconductivity
I. INTRODUCTION
In cuprates, high-temperature superconductivity lies between an undoped antiferromagnetic (AFM) insulator and a metal at high hole doping (p). In proximity to the AFM insulator, the strong electronic correlations give rise to a complex phenomenology, including a large spectral gapΔthat opens aboveTcand ak-space structure lacking a conventional Fermi surface (FS) but described by open arcs
[1,2]. Both gap and arcs are widely considered hallmarks of this underdoped region of the phase diagram and have drawn significant attention aiming to uncover their origin(s) [3]. However, at a doping near optimal superconductivity, the Fermi arcs undergo an abrupt transition to a “large” pocket consistent with a conventional area proportional to 1þp [4–7]. A crucial challenge remains to identify the appropriate ground state(s) that underlie the theoretical framework onbothsides of this transition.
On the overdoped side, long thought to be a Fermi liquid, several recent reports of anomalous behavior call into question the conventional interpretation [4,8–12]. The observations of resistivity linear in temperature [8,9] in Bi-based and La-based families challenge the expectations of standard Fermi-liquid theory, and in MBE-grown La2−xSrxCuO4compounds, there are reports of mysterious symmetry breaking [11] and anomalous scaling of the superfluid density with critical temperature[10,12], although the latter finding remains controversial[13,14]. Furthermore, resonant inelastic x-ray experiments on Tl-, Y- [15], and La-based[16]compounds revealing spin fluctuations have been interpreted in terms of significant electron correlations, and there are now theoretical proposals [17,18] for how overdoped compounds may retain certain characteristic features of Fermi-liquid-like behavior, while exhibiting
*
Present address: Physics Department, Zhejiang University, Hangzhou, 310027, China.
†Present address: ISSP, University of Tokyo, Kashiwa, Chiba
277-8581, Japan.
‡Present address: Toyota Technological Institute, Nagoya
468-8511, Japan. §
Present address: Department of Materials Physics, Nagoya University, Nagoya 464-8603, Japan.
¶
[email protected] **[email protected]
Published by the American Physical Society under the terms of the Creative Commons Attribution 4.0 International license. Further distribution of this work must maintain attribution to the author(s) and the published article’s title, journal citation, and DOI.
fractionalization in the presence of strong stripe fluctuations. Additional experiments are necessary to understand the overdoped compounds, and in particular to clarify the extent to which the effects of strong correlations may persist through the FS transition.
In nearly all cuprate families, charge order in the form of disordered charge modulations have been reported in underdoped compounds, with detection terminating at [19] or before [6,20] the doping where the FS transition occurs. In ðBi;PbÞ2ðSr;LaÞ2CuO6þδ, Bi2201, however,
charge modulations extend into the overdoped regime [21,22]. These modulations reflecting an ordering insta-bility of the electronic system therefore serve as a doping-dependent fingerprint of underlying electronic interactions, not just in the underdoped regime, but across the FS transition [Fig. 1(a)]. In the Bi2201 phase diagram, the FS transition occurs just below optimal doping[23], while the spectral gap persists in the presence of the large FS [21,25,26]. Penget al.[22]recently investigated the charge modulation structure across the closing of the gap in the far-overdoped region, but it remains crucial to clearly define how the wave vectorQDW evolves across the FS transition
[Fig. 1(a)]. Existing measurements in this doping range [27–29]exhibit large scatter and doping coverage insuffi-cient to clearly establish theQDWtrend on the underdoped side. Furthermore, with the exception of Ref. [30], the measurements did not take into account the electronic inhomogeneity within these samples, even though the influence of annealing suggests that the bulk-averaged
¯
QDW is sensitive to disorder[22]. Specifically, examining ¯
QDW in Fig. 1(a), it is unclear (1) if a single doping-dependent incommensurate trend should be drawn through all of the measurements fromp¼0.11to 0.23 and (2) how the charge modulation structure in this range relates to the commensurate modulation observed in a lightly doped compound near the insulating state[31].
Here, we use the spatial dependence of the Bi2201 density wave (DW) as a probe of the parent states in both Fermi-arc and large FS regions. We find that the FS transition marks the boundary between two distinct ground states that give rise to commensurate and incommensurate charge modulations, respectively. Furthermore, concurrent mapping of the DW and FS demonstrates that conventional Fermiology is insufficient to explain the overdoped evo-lution ofQDW.
II. INHOMOGENEOUS FERMI-SURFACE TRANSITION
Within a single Bi-based cuprate crystal, an average doping of p holes per unit cell produces a highly inho-mogeneous spatial distribution resulting in large variations in the local electronic properties[30,34–39]. In a scanning tunneling microscope, the local electronic density of states is typically measured by the spatially resolved differential conductancegðr; E¼eVÞ≡dI=dVðr; VÞ, whereV is the sample bias andIðr; VÞ is the tunneling current. Binning and averaging the local spectra by gap sizeΔðrÞ, as shown in Figs. 1(b) and 1(c), demonstrates the variation of the spectrum over a large field of view. Previous work has shown that smallerΔ corresponds to higher hole concen-tration, both locally within each sample [34,36,37] and globally from sample to sample [40]. Thus, the same spectrum can be found locally in samples with different globalp, and the overlappingΔdistributions from the four samples studied in this work, UD25K, UD32K, OPT35K, 0.1
0.2 0.3
Q
DW
(r
.l.u.)
UD32K
Δ(r)
10 nm
(b)
10 meV 100 meV
Bias (mV)
dI
/
dV
(a.u.)
–100 –50 0 50 100
Δ OD15K
OPT35K UD32K
UD25K
Count
0
4 20 0
0
8 60
Δ (meV)
0.05 0.10 0.15 0.20 0.25
10 20 30
T
(K)
AFM SC
Fermi arcs Large FS
p
(a)
(d)
0 0
Ref. [22] Ref. [27] Ref. [28] Ref. [29] Ref. [31] This work
X-ray STM
0
(c)
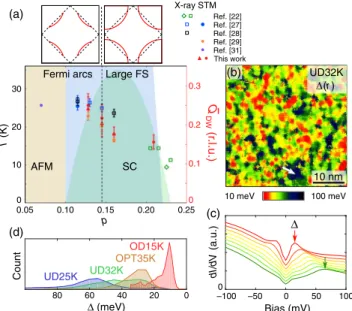
FIG. 1. Using local electronic inhomogeneity and charge modulations to probe the Bi2201 phase diagram. (a) Phase diagram for Bi2201 in the region of the superconducting dome (green shading). With increasing p at low temperature, the appearance of sharp antinodal quasiparticles (insets) indicative of a large normal-state Fermi surface occurs just below optimal doping (dashed line [21]), while the spectral gap persists into overdoped compounds (blue shading, with boundary marking the closing of the gap, as measured by ARPES[25]and NMR[26]). The data points mark existing sample-average measurements of the charge modulation wave vectorQ¯DWin Bi2201 from x-ray
scattering (green [22], blue[27], and black [28]open symbols) and STM (blue[27], orange[29], and purple[31]filled symbols). Red triangles and circles are the sample-average measurements of thed-form-factor charge modulations in thexand ydirections, respectively, from this work, with p determined from Ando’s conversion[32], as described in the Supplemental Material[33]. The green squares and diamond are the annealed and as-grown samples, respectively, from Penget al.[22]. (b) The local spectral gapΔ(shown for UD32K) measured as the local minimum in the second derivative of the empty-state differential conductance spectrum measured at each point. The white arrow marks the same location as in Fig. 2(h) to highlight a region of large Δ contributing to the Fermi-arc QPI in Fig. 2(f). (c) Differential conductance spectra from UD32K averaged over spatial regions binned byΔand offset vertically for clarity. (d) Distributions ofΔ within the UD25K, UD32K, OPT35K, and OD15K samples. The histograms are normalized to have equal areas.
and OD15K [Fig. 1(d)], allow us to move continuously from underdoped (UD) to overdoped (OD) in the phase diagram using spatial masking[30]to hone in on a single local doping within a larger field of view (Appendix B).
To validate the use of local doping to construct the Bi2201 phase diagram, we demonstrate that the evolution of the FS withΔmimics that of bulk samples withp. We calculate the ratio mapZðr; EÞ≡gðr; EÞ=gðr;−EÞ, which enhances Bogoliubov quasiparticle interference (QPI), and eliminates artifacts associated with the tip-sample junction setup[41]. The normal-state FS can be inferred from QPI in the superconducting state as follows [42–44]. The QPI signal is dominated by wave vectors connecting regions of high density of states, i.e., extrema in the Bogoliubov dispersionEðkÞ ¼
ffiffiffiffiffiffiffiffiffiffiffiffiffiffiffiffiffiffiffiffi ϵ2
kþ jΔkj2
q
, whereϵkis the normal-state band dispersion, andΔk is the momentum-dependent superconducting gap. For a given angle, extrema inEðkÞ are given byϵk ¼EF(normal-state Fermi energy); thus, the Bogoliubov QPI dispersion traces out the normal-state FS. In particular, it is well established that the q4ðEÞchannel [Fig.2(a)] traces out2kF[19,21,44], in excellent agreement with the normal-state FS measured by ARPES[44,45]. The q4wave vectors—extracted as a function ofΔby selecting
a range of Δ values in ΔðrÞ to mask the ZðrÞ data (Appendix B)—together describe a single evolution of the momentum-space electronic structure extending across
all samples [Figs. 2(a)–2(e)]. Regions with a small gap [Δ¼19meV, Fig. 2(e)] exhibit QPI tracing out a large normal-state FS: The Bogoliubov quasiparticles near the antinodes at the edge of the Brillouin zone kx;y¼ π=a [Fig. 2(a)] generate scattering with q4 wave vectors that extend out toqx;y¼ 2π=a. Moving to largerΔ[Fig.2(d)], theq4 trajectory shrinks, consistent with decreasing hole concentration, and the full evolution of the FS size inferred from the QPI (Fig. S3 in the Supplemental Material[33]) confirms thatΔis well correlated to doping, in agreement with previous observations [30,34,38].
For largerΔ, the absence of observable QPI nearqx;y¼
2π=a (Fig. S1 in the Supplemental Material [33]) is consistent with a normal-state Fermi arc that lacks sharp antinodal (AN) quasiparticles [19,21]. Quantitatively, the intensity of the AN QPI in the UD32K sample [Fig.4(a)] decreases with increasingΔ before settling at a constant value indistinguishable from the background, indicating the transition occurs at Δ≈50meV, which we label Δ. Spatially dividing the data into regions of Δ>Δ and <Δ[Figs.2(f)and2(g)] shows that QPI associated with a large FS and Fermi arcs both exist within the sample, such that one can move on the phase diagram from one side of the transition to the other spatially. This spatial division emphasizes that the electronic structure is determined on length scales similar to theΔcorrelation length. The FSp
q T K
0.0 1.0
0.0 1.0 Low High
0.0 1.0
0.0 1.0 0.0 1.0
0.0 0.5
–0.5 Arcs Large FS
kx 10 nm
Δ < Δ*
Δ > Δ*
(f) (g)
qx qy
p
q4 1 r.l.u. = 2 /a
ky
qx qy
UD32K UD32K
OD15K OPT35K UD32K UD25K
(h)
(a) = 79 meV (b) = 59 meV (c) = 39 meV (d) = 19 meV (e)
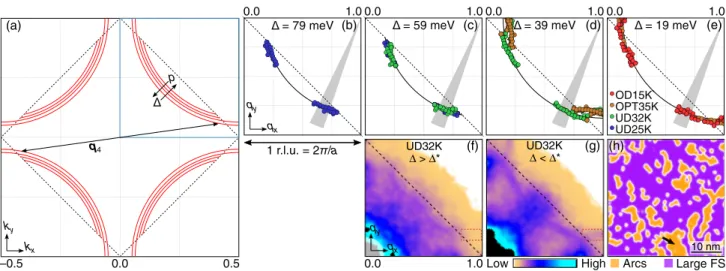
FIG. 2. A continuous doping axis from local electronic inhomogeneity. (a) Fermi-surface evolution with local doping over the range of Δandpstudied here. The double-headed arrow indicates an exampleq4 scattering vector. The blue box marks the quadrant that is shown for the QPI panels. (b)–(e) The QPI evolution with the local gap is shown by data points marking the peak positions extracted from gap-maskedZðqÞfor all four samples. Refer to AppendixCand the Supplemental Material[33]Fig. S1. On each panel, data are compiled from masked regions with average Δwithin a 4 meV range, centered at the indicated value. The black lines are circles determined by the average radius of the near-nodal data within a fixed angular range indicated by gray shading. ForΔ>Δ, points are extracted only for regions inside the dashed line, as the intensity of antinodal QPI is negligible. (f) UD32K QPI from maskingZðrÞby the yellow regions in (h) withΔprimarily greater thanΔ. QPI from near-nodal quasiparticles is strong, but antinodal QPI (red dashed box) is not visible. (g) UD32K QPI from maskingZðrÞby the purple regions in (h) withΔprimarily less thanΔ. QPI extends out to qx;y¼1r:l:u: (red dashed box), indicating the presence of antinodal quasiparticles arising out of the antinodal normal-state Fermi
surface. The gap-maskedZðqÞin (f) and (g) is integrated from 10 to 25 meV, fourfold symmetrized, and smoothed with a Gaussian filter of width 0.015 r.l.u. to reduce the appearance of noise. (h) Spatial division of UD32K into regions withΔprimarily greater than (yellow) or less than (purple) Δ (AppendixD). The arrow in (h) marks the same location as in Fig.1(b) to highlight a region of largeΔ contributing to the Fermi-arc QPI. Allkandq axes are in reciprocal lattice units (1r:l:u:¼2π=a).
evolution of the cuprate phase diagram is therefore repro-duced locally as a function ofΔ, with the transition from Fermi arcs to large FS occurring atΔ≈50meV.
III. COMMENSURATE-TO-INCOMMENSURATE TRANSITION
We now determine the doping dependence of the charge modulation wave vector QDW as a function of Δ to look for signatures of the change in ground state at Δ. We examineDðrÞ, thed-form-factor (dFF) component[46]of
P
0<ε<Egðr;εÞ=
P
−E<ε<0gðr;εÞ∼Iðr; EÞ=Iðr;−EÞ, where the integration over an energy range larger than the typical
Δfor each sample, enhances the DW signal[47]. In all four samples, the amplitude of the Fourier transformDðqÞhas broad peaks atðQDW;0Þandð0;QDWÞnear the charge
modulation wave vectors that have been observed by previous experiments, indicating clearly that a dFF DW exists in all (Fig. S5 in the Supplemental Material[33]). We employ the demodulation phase residue minimization technique of Mesaros et al. [48] to make QDW measure-ments robust against the strong disorder apparent from the broad shape of the DW peaks.
Comparing Figs.3(a)–3(c)to Figs.3(d)–3(f)reveals that thedFF DW exhibits distinct evolutions for small and large spectral gap regions. From 16 to 48 meV,QDW increases
from 0.15 to 0.23 r.l.u., matching the change in wave vector that has been measured by resonant x-ray techniques from p≈0.20to near-optimal doping[22,27,28]and consistent with an evolving incommensurate wave vector. However, fromΔ≈50meV toΔ≈85meV, no significant increase is observed [Figs.3(a)–3(c)]. The constant value ofQDWnear
0.25 r.l.u. suggests a dominant commensurate instability. In fact, the entireQDWðΔÞevolution [Fig. 4(b)] is consistent
with a commensurate-to-incommensurate transition at a location indistinguishable fromΔ. The dashed line show-ing the expected broadenshow-ing of the underlyshow-ing commensu-rate- (yellow) to-incommensurate (purple) trend describes the data accurately (Supplemental Material[33]Sec. SX). Furthermore, the coincident changes in Fermiology and DW commensurability strongly suggest the presence of a quan-tum phase transition atΔ.
A. Commensurate density wave
The observed wave vector in the Fermi-arc state (Δ>Δ) is consistent with a commensurate four-unit-cell charge modulation. The averageQ¯DWfrom UD25K, which
lies almost entirely on the underdoped side of the transition, is 0.25(3) and 0.24(3) r.l.u. for the x and y directions, respectively, where the errors represent the estimated stan-dard deviation of spatial variations across the entire field of view. Resonant x-ray experiments [27] have reported a doping-dependentQ¯DWin this same doping range, down to
p¼0.115. However, this apparent discrepancy can be understood by considering (1) the FS transition occurs near p¼0.14[21], and beyond this point, we also observe an incommensurate wave vector, (2) the local inhomogeneity could plausibly induce a doping dependence ofQ¯DWeven in samples with averagep below the transition, and (3) the strongly disordered structure of charge modulations limits the precision with which the value ofQDW(andQ¯DW) can be
determined unambiguously [48]. For the samples studied here, ignoring local doping variations and taking the average
¯
QDWvalue for each sample hides the kink at the FS transition
and produces a trend of decreasingQ¯DWwith doping similar to previous reports [Fig.1(a)]. Furthermore, while our data do not rule out a small doping dependence, recent experi-ments on Bi2212[48–50]and very underdoped Bi2201[31] are also consistent with a Q¼0.25r:l:u: commensurate DW within the Fermi-arc regime arising from proximity to the Mott insulating state.
B. Incommensurate density wave
What is the mechanism for the incommensurate QDW observed for Δ<Δ? Previous work interpreted the monotonically decreasing QDW as evidence of a FS instability that follows the growing FS hole pocket[30]. In this picture, there are two natural candidates forQDW: (1)QANthat connects nested antinodal segments of the FS and (2)QAFZBthat connects the points where the FS crosses the antiferromagnetic zone boundary (AFZB), the hot spots
x
q r.l.u.
(a)
(f) (e)
(d)
(c) (b)
0.5
-0.5 0.0 -0.5 0.0 0.5-0.5 0.0 0.5
qx
qy
= 85 meV = 66 meV = 52 meV
= 48 meV = 31 meV = 16 meV
= 0.25 y
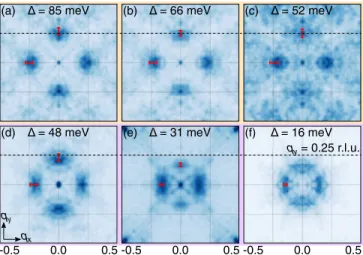
FIG. 3. d-form-factor charge modulations. Examples of gap-maskedDðqÞwhere the indicatedΔis the average value within each masked area. The data are symmetrized along theqxandqy
directions, and Gaussian smoothed with a 0.01 r.l.u. width. (a)–(c) Data withΔ>Δ(Fermi-arc regime). (d)–(f) Data with Δ<Δ(large FS regime). The thin gray lines have a spacing of 0.25 r.l.u. to facilitate comparison to the Fermiology in Fig.2. The red symbols markQDWdetermined forxandymodulation
directions, where the bar length indicates the estimated standard deviation of spatial fluctuations within each masked area. No measurement of QDW is made for qy modulations in
OD15K (f), as the wave vector is not sufficiently well defined. The panels correspond to data from UD25K (a)–(c), UD32K (d), OPT35K (e), and OD15K (f).
for ðπ;πÞ spin fluctuations. Both QANðΔÞ andQAFZBðΔÞ
are shown in Fig.4(b). For the largestp(smallestΔ),QDW
becomes similar to these Fermiology-derived wave vectors. However, upon decreasingp towards the transition,QDW
grows more rapidly than the FS evolves. This unexpected discrepancy betweenQDWand Fermiology constitutes our
second major finding.
IV. DISCUSSION
Whereas most recent theories for charge modulations in the cuprates have aimed to explain an incommensurate DW in the presence of Fermi arcs, here we discuss (1) a
commensurate DW in the presence of Fermi arcs and (2) an incommensurate DW occurring in the presence of the large FS. This leads to two important distinctions. First, in the Fermi-arc regime, strong interactions are expected, and the associated renormalization can affect a hot-spot (HS) wave vector, QHS. For an instability of the large FS,
however, it is nota priori clear that there should be any influence of correlations on such aQHS. This first distinction
reconciles our conclusion with Ref.[27]’s interpretation that ¯
QDW is Fermiology driven [51]. We note that additional factors, such as coupling to the lattice, may affect the observedQDW. Second, theoretical studies have found that the dominant charge-density wave (CDW) instability of the large FS in the presence of exchange interactions has a wave vector along theðq;qÞdirection rather thanð0;qÞor ðq;0Þ, and the presence or absence of antinodal states is important in stabilizing the former or latter orientation, respectively[52]. It is therefore significant that the orienta-tion of the charge modulaorienta-tions does not change atΔ.
To search for information about the nature of the transition at Δ, we consider that generically in CDW systems, a discontinuity or sharp jump inQDWoccurs at a
commensurate-to-incommensurate transition [53]. From this work, we cannot distinguish between a continuous QDWor one with a small jump, as shown by the yellow and
purple trends in Fig. 4(b) [see also Fig. S10(j) in the Supplemental Material[33]]. To extract this information,
Δ and the incommensurate Q
DWðΔÞ would need to be
determined with reduced uncertainties. However, if present, a continuousQDW, which generically requires fine-tuning,
would imply a mechanism-derived constraint on the posi-tion ofΔnot explained by existing theoretical models of the Fermi-surface transition.
Ubiquity across underdoped compounds has widely been cited to motivate studying charge modulations as a route to understanding Fermi-arc physics and the mechanism behind high-Tc superconductivity in cuprates. However, the rela-tionship among these three phenomena has remained an open question. The coincidence of the DW and FS tran-sitions observed here establishes an intimate link between the DW and the presence of Fermi arcs, and furthermore suggests that the same interactions which generate the commensurate instability may also be responsible for the arc phenomenology.
In summary, we report three concrete observations: (1) There is a commensurate-to-incommensurate transition ofQDWat a doping consistent with that of the FS transition,
(2) on the underdoped side, QDW is consistent with a
commensurate four-unit-cell modulation, and (3) on the overdoped side, the doping dependence ofQDWis stronger
than that of the FS size.
ACKNOWLEDGMENTS
The authors thank Subir Sachdev, Patrick A. Lee, Andrej Mesaros, B. J. Ramshaw, Simon Verret, Milan Allan,
20 0
60 40
100 80
0.10 0.15 0.20 0.25 0.30
QDW
(r
.l.u.)
Normalized QPI intensity
0.50 0.75 1.00 1.25
Δ*
Δ (meV)
QAN
QAN
QAFZB UD25K UD32K OPT35K OD15K
(iv) (a)
(b)
Δ = 30 meV
QAFZB
(ii)
(iii)
qy qx kx ky
Δ = 63 meV
(i)
Low High
FIG. 4. Simultaneous DW and FS transitions. (a) Intensity of AN QPI in UD32K determined at five locations [red lines in the insets (iii),(iv)] and normalized to the intensity of near-nodal QPI (AppendixE).Δ indicates the approximate location where the AN QPI becomes indistinguishable from the background noise. The thick shaded lines are guides to the eye. Insets (i),(ii) show the approximate Fermi-surface structure inferred from two examples of the gap-masked ZðqÞ (iii),(iv) without and with AN QPI. (b) Wave vector (QDW) of thedFF charge modulations
in thex(triangles) andy(circles) directions, extracted from gap-maskedDðrÞ. Refer to Fig. S9 in the Supplemental Material[33] for the standard deviation ofQDWfor each value ofΔ. The thick
shaded lines indicate the commensurate-to-incommensurate trend underlying the dashed line, which includes the expected effect of Gaussian smoothing (σ¼12meV) in Δ due to the resolution of the masking technique (Fig. S10 in the Supple-mental Material [33]). The gray and black lines indicate the Fermiology-driven candidate wave vectors, as indicated sche-matically in the insets and based on the circular Fermi-surface models shown in Figs.2(a)–2(e).
J. C. S´eamus Davis, Makoto Hashimoto, Maude Lizaire, and Louis Taillefer for helpful discussions. This work was supported by the Gordon and Betty Moore Foundation’s EPiQS Initiative through Grant No. GBMF4536 and the National Science Foundation under Grant No. DMR-1341286. D. C. is supported by a postdoctoral fellowship from the Gordon and Betty Moore Foundation under the EPiQS initiative Grant No. GBMF-4303 at MIT.
APPENDIX A: STM DATA
Differential conductance maps were collected in scan-ning tunneling microscopes at 6 K with the following tip-sample junction setup conditions: 100 mV and 100 pA for OD15K, −100mV and 400 pA for OPT35K, −200mV and 400 pA for UD32K, and −150mV and 400 pA for UD25K. The measurements used a lock-in technique with 2, 10, 5, and 5 mV bias modulations, respectively. Data were corrected for artificial distortions due to instrument drift to register the simultaneously recorded topography to a perfect lattice [54].
APPENDIX B: GAP-MASKING TECHNIQUE The gap mapΔðrÞis calculated by finding the position of the local minimum in the second derivative of the empty-state differential conductance for the spectrum at each pixel r, ingðr; EÞ, where Gaussian smoothing in energy reduces errors from noise in the data. The gap masks are then generated by dividing the values ofΔinto bins with equal counts. The mask for binb,MbðrÞhas a value of 1 ifΔðrÞ is in b, or zero otherwise. In order to reduce periodic structure in the masks arising from the atomic corrugation or the charge modulations[30], a bilateral filter is applied to
ΔðrÞ before generating the masks.
To obtain clear images in momentum transferq space, we use an additive masking technique, where for each bin b, we look for the change in Fourier-transform amplitude when adding b into the field of view. The additive masks therefore include bins summed up to a bin b: M1;bðrÞ ¼
Pb
j¼1MjðrÞ. To avoid introducing arti-facts from spatial structure of the masks, we apply Gaussian smoothing to the mask, with a spatial resolution of 1=w. The filtered masks M1;bðrÞ ¼GwðrÞ M1;bðrÞ can now have any value in the range [0,1], whereGwis the Gaussian filter, and * indicates convolution. This filtering imposes a spatial resolution of the masks and implies a spread in the Δ distribution within each mask (Fig. S10 in the Supplemental Material [33]).
To explain the additive masking technique, we describe how the images in Fig. 3 are generated. The additive masks are applied to the DðrÞ map in real space: Da;bðrÞ ¼Ma;bðrÞDðrÞ. To visualize the charge order peaks from bin b, we take the difference of the absolute values of the Fourier transforms, including and not includ-ing binb. The additive masking can either add upΔvalues
from small to large (forward, fw) or in the reverse direction (backward, bw). For these two cases, the gap-maskedDðqÞis
Dfwb ðqÞ ¼D1;bðqÞ−D1;b−1ðqÞ; ðB1Þ Dbwb ðqÞ ¼Db;NðqÞ−Dbþ1;NðqÞ; ðB2Þ whereN is the total number of bins, andDa;bðqÞis a real number, the amplitude of the Fourier transform. Unless otherwise specified, functions ofq refer to amplitudes of Fourier transforms. The panels of Fig. 3 have Gaussian smoothing applied with width 0.01 r.l.u. to reduce the appearance of noise.
The QPI shown in the insets of Fig.4areZfwb ðqÞgenerated from ZðrÞ using this same technique. Additional gap-masked QPI from UD32K in Fig. S1 in the Supplemental Material [33] shows the evolution of the Fermi-surface structure across the full range ofΔwithin the sample. These QPI images have Gaussian smoothing applied with width 0.015 r.l.u. and are fourfold symmetrized.
For the analysis of the Fermi-surface structure, we use overlapping bins, i.e.,
Zfwb ðqÞ ¼Z1;bðqÞ−Z1;b−nðqÞ; ðB3Þ Zbwb ðqÞ ¼Zb;NðqÞ−Zbþn;NðqÞ ðB4Þ in order to measure the QPI wave vectors at finer-spaced intervals of Δ with more variations in the masks. The integerndetermines the overlap between subsequent bins.
The average value of the gap for bin bis then
Δfw
b ¼
P
rΔðrÞ½M1;bðrÞ−M1;b−nðrÞ
P
r½M1;bðrÞ−M1;b−nðrÞ
; ðB5Þ
Δbw
b ¼
P
rΔðrÞ½Mb;NðrÞ−Mbþn;NðrÞ
P
r½Mb;NðrÞ−Mbþn;NðrÞ
; ðB6Þ
wheren¼1 for distinct as opposed to overlapping bins. Here, we useN¼19for UD25K, 31 for UD32K, 31 for OPT35K, and 21 for OD15K, withn¼4andw¼0.20r:l:u: For DðqÞ in Fig. 3, we use N¼9 with n¼1 for UD25K, UD32K, and OPT35K, and N¼21with n¼4 for OD15K. For OD15K, only the data for binsb¼5, 9, 13, 17, and 21 are plotted in Fig. 4(b) to present data from distinct bins, as are used on the other three samples. The mask smoothing parameter w is chosen to include the resolution Λ of determining QDW (Appendix F):
w¼Λ¼0.10r:l:u: for UD25K, w¼Λ¼0.10r:l:u: for UD32K,w¼Λ¼0.04r:l:u:for OPT35K, andw¼ ðΛ−2þ 0.20r:l:u:−2Þ−1=2 withΛ¼0.04r:l:u: for OD15K.
APPENDIX C: FERMI-SURFACE STRUCTURE FROM GAP-MASKED QPI
ZðqÞis integrated over the low-energy layers to capture the full dispersion of the Bogoliubov quasiparticles from 1.5 to 9 meV for OD15K, 5 to 5 meV for OPT35K, 10 to 25 meV for UD32K, and 5 to 15 meV for UD25K.
For each Δ bin, the QPI wave vectors, as shown in Fig. 2, are extracted from the positions of peaks in one-dimensional cuts through Zfw
b ðqÞ and Zbwb ðqÞ and are shown in Fig. S1 of the Supplemental Material [33] for UD32K. To quantitatively determine the size of the Fermi surface, the wave vectors from all samples are binned together, as shown in Fig. 2. A circular hole pocket is determined from the average radius of the data in the range
θ¼0.105πto0.145π, whereθis defined in Fig. S1 of the Supplemental Material [33], and the range is selected because this near-nodal QPI is consistently measured across the Fermi-surface transition (unlike the antinodal QPI) and is least influenced by nearby scattering channels or the DW signal. The evolution of the Fermi-surface radius is shown in Fig. S3 of the Supplemental Material[33]and explicitly demonstrates thatΔ tracks the local doping.
APPENDIX D: FERMI-ARC AND LARGE-FERMI-SURFACE QPI
To generate Figs. 2(f) and 2(g), we locate the bin b, which has the largest average gap value below 49 meV, the average of Δ estimates based on forward and backward masked data shown in Fig. 4(a) and Fig. S4(b) of the Supplemental Material [33]. Bins b≤b primarily have
Δ<Δ, and b > b primarily Δ>Δ. This division is only approximate due to the Gaussian smoothing of the masks (Fig. S10 in the Supplemental Material [33]). To probe QPI from the two regimes divided byΔ, Figs.2(f) and2(g)showZbþ1;NðqÞ, andZ1;bðqÞ, respectively. Note that in this case, there is no subtraction after applying the Fourier transform. Figure 2(h) shows M1;bðrÞ, where the color scale interpolates between 0.0 (yellow) and 1.0 (purple). Because the masks used to obtain Figs.2(f) and 2(g) are related by Mbþ1;NðqÞ ¼1−M1;bðqÞ, the
yellow and purple indicate the regions primarily contri-buting to the Fermi arc and large-Fermi-surface QPI, respectively.
APPENDIX E: INTENSITY OF AN QPI IN UD32K In order to quantify the disappearance of the AN QPI, which is apparent directly in the data (Fig. S1 in the Supplemental Material [33]), we measure the intensity at cuts spaced at regular angular intervals, as shown in Fig. S4 of the Supplemental Material [33]. The cuts are averaged over a transverse width of 0.07 r.l.u. and a length deter-mined by the QPI radius (twice the FS radius)0.06r:l:u: To compare QPI intensities from different bins, the inten-sities of the cuts are normalized by the average intensity of
five cuts closer to the nodal QPI [dashed red lines in Fig. S4(a) of the Supplemental Material[33]]. Figure4(a) tracks this normalized intensity for five cuts near the antinode [red lines in Fig.4(a)insets iii and iv].
APPENDIX F: EXTRACTING QDW FROMdFF
CHARGE MODULATION
We follow the procedure described by Mesaroset al.[48], where QDW is determined as the wave vector which minimizes the demodulation residueRQ¼
ffiffiffiffiffiffiffiffiffiffiffiffiffiffiffiffiffiffiffiffiffiffiffiffiffiffi jRx
Qj2þjRyQj2
q
over the field of view. In the case of a strongly disordered density wave, this measurement has a more clearly defined interpretation than fitting peaks of the Fourier-transformed data. Both techniques are compared in Sec. SVIII of the Supplemental Material [33]. A detailed explanation of demodulation residue can be found in Ref. [48]. In this section, we extend the technique for application to masked regions of the data’s field of view.
DðrÞis demodulated by the reference wave vectorQin
˜
ΨQðqÞ ¼exp
−q2 2Λ2
˜
ψðqþQÞ; ðF1Þ
where ψ˜ðqÞ ¼D˜ðqÞ over a domain which isolates the charge order peak, D˜ is the complex-valued Fourier transform of DðrÞ, and Ψ˜Q, ψ˜ are complex-valued func-tions. The Gaussian cutoff imposes a spatial resolution of1=Λ.
The QDW measurement proceeds in each bin b by
integrating the residue only over the masked region: Rαb;Q½Ψ ¼
Z
d2rMbðrÞRe½ΨQð−i∂αÞΨQ; σ2¼
R
d2rMbðrÞ
P
α½ΨQð−i∂αÞΨQ2 R
d2rMbðrÞjΨQj2 ; ðF2Þ where α is either x or y, ΨQðrÞ is the inverse Fourier transform ofΨ˜QðqÞ, and with Q¼QDW,σ estimates the
standard deviation of spatial fluctuations in the modulation wave vector.
For this analysis, we use w¼0.0as the mask smooth-ing parameter for UD25K, UD32K, and OPT35K, with
Λ¼0.10, 0.10, and 0.04 r.l.u., respectively. For OD15K, we use w¼0.20r:l:u: and Λ¼0.04r:l:u: The samples with smaller wave vector require a smallerΛforQDWto be robust against the choice ofΛ.
[1] P. A. Lee, N. Nagaosa, and X.-G. Wen, Doping a Mott Insulator: Physics of High-Temperature Superconductivity, Rev. Mod. Phys.78, 17 (2006); B. Keimer, S. A. Kivelson, M. R. Norman, S. Uchida, and J. Zaanen,From Quantum
Matter to High-Temperature Superconductivity in Copper Oxides,Nature (London)518, 179 (2015).
[2] M. R. Norman, H. Ding, M. Randeria, J. C. Campuzano, T. Yokoya, T. Takeuchi, T. Takahashi, T. Mochiku, K. Kadowaki, P. Guptasarma, and D. G. Hinks,Destruction of the Fermi Surface in Underdoped High-Tc Superconduc-tors, Nature (London) 392, 157 (1998); K. M. Shen, F. Ronning, D. H. Lu, F. Baumberger, N. J. C. Ingle, W. S. Lee, W. Meevasana, Y. Kohsaka, M. Azuma, M. Takano, H. Takagi, and Z.-X. Shen, Nodal Quasiparticles and Anti-nodal Charge Ordering inCa2−xNaxCuO2Cl2,Science307,
901 (2005); K. Tanaka, W. S. Lee, D. H. Lu, A. Fujimori, T. Fujii, Risdiana, I. Terasaki, D. J. Scalapino, T. P. Devereaux, Z. Hussain, and Z.-X. Shen, Distinct Fermi-Momentum-Dependent Energy Gaps in Deeply Underdoped Bi2212, Science314, 1910 (2006); A. Kanigel, M. R. Norman, M. Randeria, U. Chatterjee, S. Souma, A. Kaminski, H. M. Fretwell, S. Rosenkranz, M. Shi, T. Sato, T. Takahashi, Z. Z. Li, H. Raffy, K. Kadowaki, D. Hinks, L. Ozyuzer, and J. C. Campuzano,Evolution of the Pseudogap from Fermi Arcs to the Nodal Liquid,Nat. Phys.2, 447 (2006); A. Kanigel, U. Chatterjee, M. Randeria, M. R. Norman, S. Souma, M. Shi, Z. Z. Li, H. Raffy, and J. C. Campuzano, Protected Nodes and the Collapse of Fermi Arcs in High-TcCuprate Superconductors,Phys. Rev. Lett.99, 157001 (2007). [3] The word pseudogap has been variously used to describe
both spectral gap and Fermi-arc phenomena; here we note the distinction between these phenomena.
[4] M. Plat´e, J. D. F. Mottershead, I. S. Elfimov, D. C. Peets, R. Liang, D. A. Bonn, W. N. Hardy, S. Chiuzbaian, M. Falub, M. Shi, L. Patthey, and A. Damascelli,Fermi Surface and Quasiparticle Excitations of Overdoped Tl2Ba2CuO6þδ, Phys. Rev. Lett.95, 077001 (2005).
[5] B. Vignolle, A. Carrington, R. A. Cooper, M. M. J. French, A. P. Mackenzie, C. Jaudet, D. Vignolles, C. Proust, and N. E. Hussey,Quantum Oscillations in an Overdoped
High-TcSuperconductor,Nature (London)455, 952 (2008).
[6] S. Badoux, W. Tabis, F. Lalibert´e, G. Grissonnanche, B. Vignolle, D. Vignolles, J. B´eard, D. A. Bonn, W. N. Hardy, R. Liang, N. Doiron-Leyraud, L. Taillefer, and C. Proust,
Change of Carrier Density at the Pseudogap Critical Point of a Cuprate Superconductor, Nature (London)531, 210 (2016).
[7] C. Collignon, S. Badoux, S. A. A. Afshar, B. Michon, F. Lalibert´e, O. Cyr-Choini`ere, J.-S. Zhou, S. Licciardello, S. Wiedmann, N. Doiron-Leyraud, and L. Taillefer, Fermi-Surface Transformation across the Pseudogap Critical Point of the Cuprate SuperconductorLa1.6−xNd0.4SrxCuO4,Phys.
Rev. B95, 224517 (2017).
[8] A. Legros, S. Benhabib, W. Tabis, F. Lalibert´e, M. Dion, M. Lizaire, B. Vignolle, D. Vignolles, H. Raffy, Z. Z. Li, P. Auban-Senzier, N. Doiron-Leyraud, P. Fournier, D. Colson, L. Taillefer, and C. Proust,UniversalT-Linear Resistivity and Planckian Dissipation in Overdoped Cuprates, Nat. Phys.15, 142 (2019).
[9] R. A. Cooper, Y. Wang, B. Vignolle, O. J. Lipscombe, S. M. Hayden, Y. Tanabe, T. Adachi, Y. Koike, M. Nohara, H. Takagi, C. Proust, and N. E. Hussey,Anomalous Criticality in the Electrical Resistivity ofLa2−xSrxCuO4,Science323,
603 (2009).
[10] I. Bozovic, X. He, J. Wu, and A. T. Bollinger,Dependence of the Critical Temperature in Overdoped Copper Oxides on Superfluid Density,Nature (London)536, 309 (2016). [11] J. Wu, A. T. Bollinger, X. He, and I. Bozovic,Spontaneous
Breaking of Rotational Symmetry in Copper Oxide Super-conductors,Nature (London)547, 432 (2017).
[12] F. Mahmood, X. He, I. Božović, and N. P. Armitage,
Locating the Missing Superconducting Electrons in the Overdoped Cuprates La2−xSrxCuO4, Phys. Rev. Lett. 122, 027003 (2019).
[13] N. R. Lee-Hone, J. S. Dodge, and D. M. Broun,Disorder and Superfluid Density in Overdoped Cuprate Supercon-ductors,Phys. Rev. B96, 024501 (2017).
[14] N. R. Lee-Hone, V. Mishra, D. M. Broun, and P. J. Hirschfeld,
Optical Conductivity of Overdoped Cuprate Superconduc-tors: Application toLa2−xSrxCuO4,Phys. Rev. B98, 054506
(2018).
[15] M. Le Tacon, M. Minola, D. C. Peets, M. M. Sala, S. Blanco-Canosa, V. Hinkov, R. Liang, D. A. Bonn, W. N. Hardy, C. T. Lin, T. Schmitt, L. Braicovich, G. Ghiringhelli, and B. Keimer, Dispersive Spin Excitations in Highly Overdoped Cuprates Revealed by Resonant Inelastic X-Ray Scattering,Phys. Rev. B88, 020501(R) (2013). [16] M. P. M. Dean, G. Dellea, R. S. Springell, F. Yakhou-Harris,
K. Kummer, N. B. Brookes, X. Liu, Y. J. Sun, J. Strle, T. Schmitt, L. Braicovich, G. Ghiringhelli, I. Božović, and J. P. Hill, Persistence of Magnetic Excitations in
La2−xSrxCuO4from the Undoped Insulator to the Heavily Overdoped Non-Superconducting Metal, Nat. Mater. 12, 1019 (2013).
[17] D. F. Mross and T. Senthil,Theory of a Continuous Stripe Melting Transition in a Two-Dimensional Metal: A Possible Application to Cuprate Superconductors,Phys. Rev. Lett. 108, 267001 (2012).
[18] D. F. Mross and T. Senthil, Stripe Melting and Quantum Criticality in Correlated Metals,Phys. Rev. B86, 115138 (2012).
[19] K. Fujita, C. K. Kim, I. Lee, J. Lee, M. H. Hamidian, I. A. Firmo, S. Mukhopadhyay, H. Eisaki, S. Uchida, M. J. Lawler, E.-A. Kim, and J. C. Davis, Simultaneous Tran-sitions in Cuprate Momentum-Space Topology and Elec-tronic Symmetry Breaking,Science344, 612 (2014). [20] S. Badoux, S. A. A. Afshar, B. Michon, A. Ouellet, S.
Fortier, D. LeBoeuf, T. P. Croft, C. Lester, S. M. Hayden, H. Takagi, K. Yamada, D. Graf, N. Doiron-Leyraud, and L. Taillefer, Critical Doping for the Onset of Fermi-Surface Reconstruction by Charge-Density-Wave Order in the Cuprate Superconductor La2−xSrxCuO4, Phys. Rev. X 6,
021004 (2016).
[21] Y. He, Y. Yin, M. Zech, A. Soumyanarayanan, M. M. Yee, T. Williams, M. C. Boyer, K. Chatterjee, W. D. Wise, I. Zeljkovic, T. Kondo, T. Takeuchi, H. Ikuta, P. Mistark, R. S. Markiewicz, A. Bansil, S. Sachdev, E. W. Hudson, and J. E. Hoffman, Fermi Surface and Pseudogap Evolution in a Cuprate Superconductor,Science344, 608 (2014). [22] Y. Y. Peng, R. Fumagalli, Y. Ding, M. Minola, S. Caprara,
D. Betto, M. Bluschke, G. M. De Luca, K. Kummer, E. Lefrançois, M. Salluzzo, H. Suzuki, M. Le Tacon, X. J. Zhou, N. B. Brookes, B. Keimer, L. Braicovich, M. Grilli, and G. Ghiringhelli, Re-entrant Charge Order in
Overdoped ðBi;PbÞ2.12Sr1.88CuO6þδ Outside the Pseudo-gap Regime,Nat. Mater.17, 697 (2018).
[23] To the authors’knowledge, the FS transition in Bi2201 near p¼0.14 has been reported only by scanning tunneling microscopy[21], but Kondoet al.’s ARPES measurements [compare Figs.3(e)and3(f)of Ref.[24]] also show that the spectral weight in the sharp quasiparticle peak at the antinode vanishes between the optimally doped and under-doped UD23K compounds.
[24] T. Kondo, R. Khasanov, T. Takeuchi, J. Schmalian, and A. Kaminski, Competition between the Pseudogap and Superconductivity in the High-Tc Copper Oxides,Nature
(London)457, 296 (2009).
[25] T. Kondo, Y. Hamaya, A. D. Palczewski, T. Takeuchi, J. S. Wen, Z. J. Xu, G. Gu, J. Schmalian, and A. Kaminski,
Disentangling Cooper-Pair Formation above the Transition Temperature from the Pseudogap State in the Cuprates, Nat. Phys.7, 21 (2011).
[26] G.-Q. Zheng, P. L. Kuhns, A. P. Reyes, B. Liang, and C. T. Lin, Critical Point and the Nature of the Pseudogap of Single-Layered Copper-Oxide Bi2Sr2−xLaxCuO6þδ, Phys.
Rev. Lett.94, 047006 (2005).
[27] R. Comin, A. Frano, M. M. Yee, Y. Yoshida, H. Eisaki, E. Schierle, E. Weschke, R. Sutarto, F. He, A. Soumyanarayanan, Y. He, M. Le Tacon, I. S. Elfimov, J. E. Hoffman, G. A. Sawatzky, B. Keimer, and A. Damascelli,
Charge Order Driven by Fermi-Arc Instability in
Bi2Sr2−xLaxCuO6þδ,Science343, 390 (2014).
[28] Y. Y. Peng, M. Salluzzo, X. Sun, A. Ponti, D. Betto, A. M. Ferretti, F. Fumagalli, K. Kummer, M. Le Tacon, X. J. Zhou, N. B. Brookes, L. Braicovich, and G. Ghiringhelli,Direct Observation of Charge Order in Underdoped and Opti-mally DopedBi2ðSr;LaÞ2CuO6þδby Resonant Inelastic X-Ray Scattering,Phys. Rev. B94, 184511 (2016).
[29] W. D. Wise, M. C. Boyer, K. Chatterjee, T. Kondo, T. Takeuchi, H. Ikuta, Y. Wang, and E. W. Hudson, Charge-Density-Wave Origin of Cuprate Checkerboard Visualized by Scanning Tunnelling Microscopy, Nat. Phys. 4, 696 (2008).
[30] W. D. Wise, K. Chatterjee, M. C. Boyer, T. Kondo, T. Takeuchi, H. Ikuta, Z. Xu, J. Wen, G. D. Gu, Y. Wang, and E. W. Hudson, Imaging Nanoscale Fermi-Surface Variations in an Inhomogeneous Superconductor, Nat. Phys.5, 213 (2009).
[31] P. Cai, W. Ruan, Y. Peng, C. Ye, X. Li, Z. Hao, X. Zhou, D.-H. Lee, and Y. Wang,Visualizing the Evolution from the Mott Insulator to a Charge-Ordered Insulator in Lightly Doped Cuprates,Nat. Phys.12, 1047 (2016).
[32] Y. Ando, Y. Hanaki, S. Ono, T. Murayama, K. Segawa, N. Miyamoto, and S. Komiya, Carrier Concentrations in
Bi2Sr2−zLazCuO6þδSingle Crystals and Their Relation to the Hall Coefficient and Thermopower, Phys. Rev. B 61, R14956 (2000).
[33] See Supplemental Material at http://link.aps.org/ supplemental/10.1103/PhysRevX.9.021021 for additional information.
[34] I. Zeljkovic, Z. Xu, J. Wen, G. Gu, R. S. Markiewicz, and J. E. Hoffman,Imaging the Impact of Single Oxygen Atoms on Superconducting Bi2þySr2−yCaCu2O8þx, Science 337,
320 (2012).
[35] K. McElroy, D.-H. Lee, J. E. Hoffman, K. M. Lang, J. Lee, E. W. Hudson, H. Eisaki, S. Uchida, and J. C. Davis,
Coincidence of Checkerboard Charge Order and Antino-dal State Decoherence in Strongly Underdoped Super-conductingBi2Sr2CaCu2O8þδ,Phys. Rev. Lett.94, 197005 (2005).
[36] Y. Fei, K. Bu, W. Zhang, Y. Zheng, X. Sun, Y. Ding, X. Zhou, and Y. Yin, Electronic Effect of Doped Oxygen Atoms in Bi2201 Superconductors Determined by Scanning Tunneling Microscopy,Sci. China Phys. Mech. Astron.61, 127404 (2018).
[37] K. McElroy, J. Lee, J. A. Slezak, D.-H. Lee, H. Eisaki, S. Uchida, and J. C. Davis,Atomic-Scale Sources and Mecha-nism of Nanoscale Electronic Disorder inBi2Sr2CaCu2O8þδ, Science309, 1048 (2005).
[38] A. Piriou, N. Jenkins, C. Berthod, I. Maggio-Aprile, and Ø. Fischer,First Direct Observation of the Van Hove Singu-larity in the Tunnelling Spectra of Cuprates,Nat. Commun. 2, 221 (2011).
[39] G. Kinoda, H. Mashima, K. Shimizu, J. Shimoyama, K. Kishio, and T. Hasegawa, Direct Determination of Local-ized Impurity Levels Located in the Blocking Layers of
Bi2Sr2CaCu2Oy Using Scanning Tunneling Microscopy/ Spectroscopy,Phys. Rev. B71, 020502(R) (2005). [40] N. Miyakawa, P. Guptasarma, J. F. Zasadzinski, D. G.
Hinks, and K. E. Gray, Strong Dependence of the Super-conducting Gap on Oxygen Doping from Tunneling Mea-surements onBi2Sr2CaCu2O8−δ,Phys. Rev. Lett.80, 157 (1998); P. J. White, Z.-X. Shen, C. Kim, J. M. Harris, A. G. Loeser, P. Fournier, and A. Kapitulnik, Rapid Suppression of the Superconducting Gap in Overdoped
Bi2Sr2CaCu2O8þδ,Phys. Rev. B54, R15669(R) (1996); J. M. Harris, Z.-X. Shen, P. J. White, D. S. Marshall, M. C. Schabel, J. N. Eckstein, and I. Bozovic,Anomalous Super-conducting State Gap Size versusTcBehavior in Underdoped
Bi2Sr2Ca1−xDyxCu2O8þδ, Phys. Rev. B 54, R15665(R)
(1996); H. Ding, J. R. Engelbrecht, Z. Wang, J. C. Campu-zano, S.-C. Wang, H.-B. Yang, R. Rogan, T. Takahashi, K. Kadowaki, and D. G. Hinks,Coherent Quasiparticle Weight and Its Connection to High-TcSuperconductivity from Angle-Resolved Photoemission,Phys. Rev. Lett.87, 227001 (2001); S. Hüfner, M. A. Hossain, A. Damascelli, and G. A. Sawatzky,Two Gaps Make a High-Temperature Supercon-ductor?,Rep. Prog. Phys.71, 062501 (2008).
[41] K. Fujita, I. Grigorenko, J. Lee, W. Wang, J. X. Zhu, J. C. Davis, H. Eisaki, S. Uchida, and A. V. Balatsky,Bogoliubov Angle and Visualization of Particle-Hole Mixture in Super-conductors,Phys. Rev. B78, 054510 (2008).
[42] Q.-H. Wang and D.-H. Lee, Quasiparticle Scattering Interference in High-Temperature Superconductors,Phys. Rev. B67, 020511(R) (2003).
[43] J. E. Hoffman, K. McElroy, D.-H. Lee, K. M. Lang, H. Eisaki, S. Uchida, and J. C. Davis,Imaging Quasiparticle Interference in Bi2Sr2CaCu2O8þδ, Science 297, 1148 (2002).
[44] K. McElroy, R. W. Simmonds, J. E. Hoffman, D.-H. Lee, J. Orenstein, H. Eisaki, S. Uchida, and J. C. Davis,Relating Atomic-Scale Electronic Phenomena to Wave-Like Quasi-particle States in Superconducting Bi2Sr2CaCu2O8þδ, Nature (London)422, 592 (2003).
[45] T. Hanaguri, Y. Kohsaka, J. C. Davis, C. Lupien, I. Yamada, M. Azuma, M. Takano, K. Ohishi, M. Ono, and H. Takagi,
Quasiparticle Interference and Superconducting Gap in
Ca2xNaxCuO2Cl2,Nat. Phys. 3, 865 (2007).
[46] K. Fujita, M. H. Hamidian, S. D. Edkins, C. K. Kim, Y. Kohsaka, M. Azuma, M. Takano, H. Takagi, H. Eisaki, S.-I. Uchida, A. Allais, M. J. Lawler, E.-A. Kim, S. Sachdev, and J. C. S. Davis, Direct Phase-Sensitive Identification of a
d-Form Factor Density Wave in Underdoped Cuprates, Proc. Natl. Acad. Sci. U.S.A.111, E3026 (2014). [47] M. H. Hamidian, S. D. Edkins, C. K. Kim, J. C. Davis, A. P.
Mackenzie, H. Eisaki, S. Uchida, M. J. Lawler, E.-A. Kim, S. Sachdev, and K. Fujita,Atomic-Scale Electronic Struc-ture of the Cuprated-Symmetry Form Factor Density Wave State,Nat. Phys.12, 150 (2016).
[48] A. Mesaros, K. Fujita, S. D. Edkins, M. H. Hamidian, H. Eisaki, S.-I. Uchida, J. C. S. Davis, M. J. Lawler, and E.-A. Kim,Commensurate4a0-Period Charge Density Modula-tions throughout theBi2Sr2CaCu2O8þxPseudogap Regime,
Proc. Natl. Acad. Sci. U.S.A.113, 12661 (2016). [49] Y. Zhang, A. Mesaros, K. Fujita, S. D. Edkins, M. H.
Hamidian, K. Ch’ng, H. Eisaki, S. Uchida, J. C. S. Davis, E. Khatami, and E.-A. Kim,Machine Learning in
Electronic Quantum Matter Imaging Experiments,arXiv: 1808.00479.
[50] H. Zhao, Z. Ren, B. Rachmilowitz, J. Schneeloch, R. Zhong, G. Gu, Z. Wang, and I. Zeljkovic, Charge-Stripe Crystal Phase in an Insulating Cuprate,Nat. Mater.18, 103 (2019).
[51] Reference [27] concludes that Q¯DW is explained by
a FS instability, apparently in contradiction to the findings reported herein. However, Ref.[27]models an incommen-surate Q¯DW in the presence of Fermi arcs, where the
renormalization associated with the arc phenomenology generates aQHS significantly larger thanQAFZB.
[52] D. Chowdhury and S. Sachdev,Density-Wave Instabilities of Fractionalized Fermi Liquids,Phys. Rev. B90, 245136 (2014).
[53] P. Bak, Commensurate Phases, Incommensurate Phases and the Devil’s Staircase, Rep. Prog. Phys. 45, 587 (1982).
[54] M. J. Lawler, K. Fujita, J. Lee, A. R. Schmidt, Y. Kohsaka, C. K. Kim, H. Eisaki, S. Uchida, J. C. Davis, J. P. Sethna, and E.-A. Kim,Intra-Unit-Cell Electronic Nematicity of the High-TcCopper-Oxide Pseudogap States,Nature (London) 466, 347 (2010).
![FIG. 4. Simultaneous DW and FS transitions. (a) Intensity of AN QPI in UD32K determined at five locations [red lines in the insets (iii),(iv)] and normalized to the intensity of near-nodal QPI (Appendix E)](https://thumb-us.123doks.com/thumbv2/123dok_us/8492903.2269038/5.918.80.444.65.472/simultaneous-transitions-intensity-determined-locations-normalized-intensity-appendix.webp)
