ANALYSE THIS
PREDICT THAT
How institutions compete and win with data analyticsForeward 4
1.0 Executive summary 5
2.0 Major competitive growth forces 8
2.1 From the information age, to the personalisation age 8
2.2 The network effect - protection or opportunity 9
2.3 Cloud - it’s not new technology, it’s new business models 11
2.4 Cognitive technologies that educate themselves, support expression 12 2.5 Competitive growth model - where to enter, adapt or be exponentially out-competed 14
3.0 The data analytics industry and consumer research 18
3.1 Methodology 18
3.2 Asia pacific financial institution and service provider competitive readiness study 18
3.2.1 Attributes of analytical competitors 18
3.2.2 Assessing the degree of analytical competitiveness 20
3.2.3 Level of strategic importance 21
3.2.4 Expectation on improving results 21
3.2.5 Level of investment 22
3.2.6 Departmental stakeholders 22
3.3 Analytics-enabled consumer experience study 24
3.3.1 Concept description and perceived banking experience 24
3.3.2 Appeal and impact of concepts 27
3.3.3 Incremental appeal 28
3.3.4 Impact of concepts on retention 30
3.3.5 Impacts of concepts on acquisition 31
4.0 Technology for the analytics-driven business in a smart connected world 33
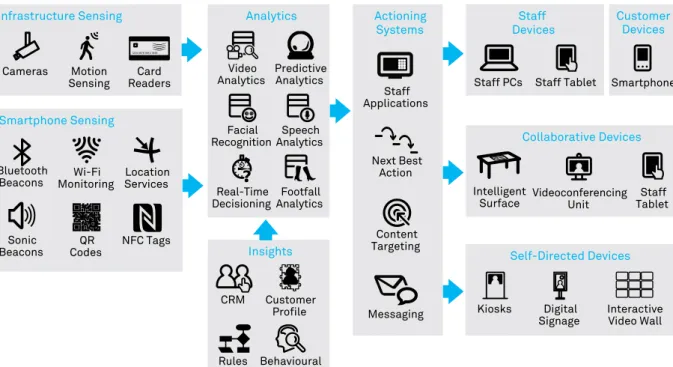
4.1 The consumer environment - a smart connected world 33
4.2 The financial service provider environment - data infrastructure analytics and actioning 36
4.2.1 Key infrastructure technologies 38
4.2.2 Key analytics technologies 39
4.2.3 Key technologies for actioning insights 40
4.3 Analytics-enabled experiences 41
4.3.1 Experience 1: ‘Contact.Me’ 41
4.3.2 Experience 2: ‘Branch.Me’ 44
4.3.3 Experience 3: ‘Digital.Me’ 46
5.0 Conclusions 52
6.0 About the author 53
7.0 Acknowledgements 54
Welcome to Telstra’s latest financial services industry thought
leadership report: Analyse This, Predict That.
This report considers how institutions compete and win with data analytics. While our core needs for money – to save, spend, borrow, invest – may not have changed much over the centuries, the way we interact with financial institutions has, and continues to drastically change. To date, this has been largely due to disruption caused by the ‘three-Ds’, being:
1. Demographic changes; 2. Digital technologies; and
3. Design of the customer experience. These are topics that I have
comprehensively researched over the past six years and presented in previous reports. This report, the ninth in my series, adds a ‘4th D’ into the mix – data.
This report argues that data, as an accelerant of disruption, is setting the financial services industry on a new competitive trajectory.
Just think of Google, Amazon, and PayPal or – more specifically to the world of finance – Capital One or Progressive Insurance in the US.
It’s clear that organisations that use analytics extensively and systematically are rapidly thinking and out-executing their competitors. Traditional players are swiftly coming to the realisation that they must prepare to adapt their settings for this new competitive landscape – as is evidenced by the speed at which this topic is climbing higher on the corporate strategic agenda.
We are now witnessing the first wave of start-ups and established information services players challenging traditional models with propositions such as peer-to-peer lending, mobile payments, and personal financial management service propositions. At the heart of all these examples is the creative application of data analytics – a catalyst that is providing innovative new ways to satisfy customers’ centuries-old core needs. This study concentrates on data
analytics. The report examines, firstly, the major forces in play and how these are re-shaping the competitive environment. Secondly, we report on how financial services institutions are adjusting their strategies and capabilities for this transformation.
We then present research on consumer attitudes toward a range of interactions that can be enabled through data analytics, and analyse the impact these would have on their relationship with their financial services providers. Lastly, we present a vision for a smart connected financial services world. Here, we both explain the key technological developments and discuss the role that next generation digital communication and media technologies can play in helping your organisation map out its journey.
This research was only made possible by the many generous contributions and insights from numerous leaders within the financial services industry, for which I sincerely thank you.
Rocky Scopelliti
Group General Manager - Industry Centre of Excellence Telstra Global Enterprise Services
This is particularly relevant in the Asia Pacific region, which is predicted to be home to two thirds of the world’s middle class by 2030 – a staggering 3.2 billion people1. This region is also predicted to
overtake North America as the largest wealth management market in the world by 20152.
Data analytics bring new risks to financial institutions, particularly around the appropriate use of data. Data analytics will require a new consumer engagement model – one that ensures that analytics enhance value whilst also reinforcing the trust that consumers place in their financial institutions.
Business models, operational structures and markets are being disrupted and contested by non-traditional and start-up players unconstrained by proprietary systems, processes and technologies, and able to compete ingeniously with democratised data and open sourced models. These players understand that digital has irrevocably changed how customers expect to engage financial services. Institutions from the 20th
century that choose not to adapt, but to rely on what worked in the past, can expect to be comprehensively out-competed.
1. Major Forces Shaping Digital
Competition and Growth
There are four key forces altering the competitive growth trajectory of the financial services industry: Personalisation, Network Effects, Cloud Business Models and Open Source Artificial Intelligence based Technologies.
The intensity of competition has, and is anticipated to increase exponentially, as the convergence of digital proliferation and inter-generational wealth transfer makes traditional financial services markets increasingly attractive for new players. We are now seeing these new entrants venturing into the financial services market with increasing regularity. Global investment in FinTech ventures clearly illustrates this trend, with investment tripling from US$928 million in 2008 to US$2.97 billion in 2013. Indeed, FinTech investment is outgrowing overall venture capital growth by a factor of four, with nearly a third going into ventures focused on data analytics and personal financial management. The epicentre market for disruptive innovation includes Generations X and Y, who today are responsible for more than half of all spending and borrowing in Australia (a pattern likely to be similar in most developed nations). We’ve developed a Competitive Growth Model that highlights where to enter, adapt or be significantly out-competed (see Section 2 – Major Competitive Growth Forces).
2. Strategic Market Gaps Exist –
these can either be Closed by
Incumbents or Exploited by
New Entrants
There’s a major gap between the
strategic priority of incumbents and their readiness to execute. New entrants are already exploiting that gap. Financial institutions are now making a significant investment in transforming themselves into analytical competitors to close the gap.
We studied 43 financial institutions across the Asia Pacific region. The results indicate a significant gap of 68% in the organisational readiness of institutions to compete on analytics, with only 32% perceiving that they are on the verge of, or ready to compete, using data analytical capability. Further, there was a 17% strategic priority gap identified, with only 83% reporting a commitment to data analytics from their CEO and leadership team. These gaps explain the significant investments – averaging 6% of an organisation’s budget in FY14 – being allocated for data analytics projects, with expectations of a resulting performance improvement averaging approximately 6.3%. Clearly, growth is the major incentive for such an investment, with 68% of Sales and Marketing departments now driving the data analytics strategy, requirements and investment programs (see Section 3 – Asia Pacific Financial Institution and Service Provider Competitive Readiness Study).
1.0 EXECUTIVE
SUMMARY
In a Smart Connected World, data analytics are having a
profound impact on the competitive growth trajectory of the
financial services industry.
3. Data Analytics – The Catalyst for
Altering Consumer Perceptions
Analytics-enabled financial services, and the experiences these capabilities provide, have the capacity to alter the perceptions of consumers across the Asia Pacific region, as well as to support strategies to acquire, engage or retain customers – whether executed through a branch, contact centre or digital consumer channel.
Our study involved over 3,100 consumers across Australia, Singapore, Malaysia, Indonesia and Hong Kong. The results indicate that in all countries, each of the five digital analytics-enabled service concepts researched achieved high appeal levels, and the nine experience metrics tested demonstrated positive perceptual impacts for each concept. Specifically:
• The results clearly show the value of a personalised digital banking experience (e.g. tools, insights, alerts, recommendations, notifications on saving, spending, borrowing or investing) across the Asia Pacific region, with this concept ranked in the top two most appealing in all Asian markets. Demand for personalisation extends to the branch, with the personalised in-branch experience (e.g. recent interactions, history, context) also ranked in the top three concepts.
• Across all five concepts, consumers indicated that ‘Knows me and my financial situation, irrespective of how I use the bank or financial institution’ and ‘Access to banking experts when I need them through my preferred way to interact with them’ experiences achieved strong positive results.
• When it comes to maximising appeal, interestingly, in all countries, the personalised in-branch experience concept appears in the top three concepts. This finding may contradict the suggestion by some commentators that the in-branch experience is dying and will eventually be replaced by the
online mode. Instead, it suggests that with personalisation, it can remain a fundamental part of what makes a financial services provider appealing to consumers in the Asia Pacific region.
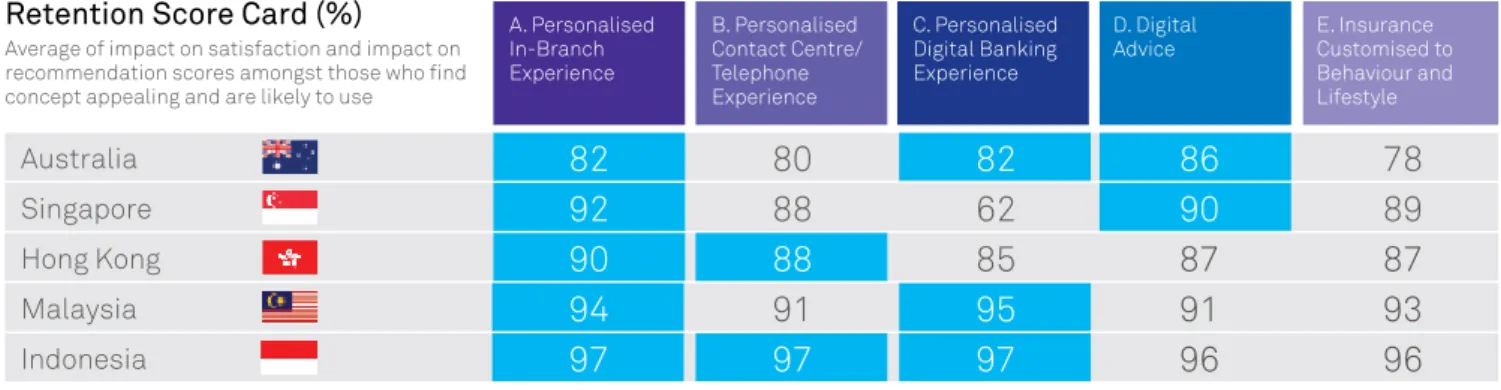
• When it comes to retention, in Australia, the digital advice concept (e.g. virtual/digital advice access to experts via video, chat, social media) has the greatest impact on customer retention, with a retention factor (satisfaction and advocacy) of 86%. Within the Singaporean, Indonesian and Hong Kong markets, those who would use the personalised in-branch experience gave it a retention value of 92%, 97% and 90% respectively. Malaysian consumers who would use the personalised digital banking service gave it a 95% retention score.
• When it comes to acquisition, digital advice, again, is featured. For Australians, the digital advice concept had the highest acquisition impact (consideration and switching) at 80%. For Singapore, it was 88%, Hong Kong 86%, and Indonesia 93%. In Malaysia, this ranked third at 88%.
• Mobile banking is now heavily penetrated across the region. Hong Kong leads the way with 68% of the population using smartphones to access financial services, followed by Indonesia 64%, Singapore 63%, Malaysia 53% and lastly Australia at 42%.
These results illustrate the significant potential impact of analytics on the design and execution of personalisation strategies, digital tools, insights and advice across channels to acquire, engage and retain customers. However, as these digital services would be enabled by large-scale analytics, it is now becoming clear that modern financial services providers need to have well-developed analytical information gathering capabilities (see Section – 3.3 Analytics-Enabled Concepts and Experiences: Asia Pacific Consumer Experience Study).
4. Pervasive Connectivity and
Intelligence for the Analytics-Driven
Business
The Smart Connected World where everyone and everything is connected, intelligent and measured.
The emerging consumer environment is marked by high-speed connectivity and pervasive distributed intelligence, and features a better awareness of the consumer’s context than ever before. By 2020, it is predicted that:
• 95% of people in the developed world will be connected to the Internet – up from 77% today;
• There will be 4-10 connected devices for every person on the planet; and
• 140 sensors per person. Intelligence is being built into an expanding range of devices, as well as infrastructure and the environment. Analytics will remove friction from businesses and consumers’ lifestyles and deliver substantial operational economic and lifestyle benefits (see Section 4 – Technology for Analytics-Driven Business in a Smart Connected World).
1.0 EXECUTIVE
SUMMARY (CONT.)
5. Valued Analytics-Enabled
Customer Experiences
Cloud technologies connected by high-bandwidth, low-latency networks make the infrastructure and expertise required to harness advanced analytics much more accessible. They create a step change in the ability of financial service institutions (both traditional providers and disruptive new entrants) to deliver the highly personalised, highly contextual, analytics-driven experiences customers now expect.
The combination of the four key forces mentioned in Key Finding 1 Major Forces Shaping Digital Competition and Growth and the democratisation of analytic capability poses a threat to traditional financial service providers. But it also creates a limited window of opportunity for those incumbents who are prepared to move swiftly and embrace this new world. By doing so, they will also be able to exploit their existing advantages over the newer entrants: namely, their unique position of trust, strong customer relationships with Gen X and Y and
multiple touch points. We show three analytics-driven customer experiences to highlight how embracing an analytics-driven approach can help channels to evolve:
• Contact.Me: Combines and extends the vision of a personalised contact centre and intelligent personal assistant, blending an intelligent personalised virtual financial assistant with a physical (but remote) relationship manager through an engaging and consistent interface.
• Branch.Me: Turns the branch into an environment for identifying visitors and understanding their intent and engagement preferences so that branch staff (and even branch infrastructure) can deliver personally optimised content and interactions.
• Digital.Me: Shows how providers can combine analysis of saving, spending, borrowing and investing behaviours with social analytics and broader market analytics to create online and mobile tools that help customers more effectively manage and use financial services.
This vision of a truly analytics-driven customer experience is underpinned by secure and highly scalable storage of customer data connected to a wide range of specialised analytics services (often hosted on high-performance cloud platforms) by high-speed, low-latency networks (see Section 4 – Technology for Analytics-Driven Business in a Smart Connected World).
This report explores the financial services sector’s analytics capabilities, and how players may use analytics to win in a competitive growth environment. This has been based on the extensive Telstra research in the Asia Pacific region, and contributions from industry leaders in different fields and industries.
Digital technology has irrevocably changed how customers expect to engage financial services. Institutions from the 20th century that choose not to adapt, but to rely on what worked in the past, can expect to be comprehensively out-competed.
These forces are:
1. The Age of Personalisation – how the convergence of digital proliferation and changing demographics has fundamentally changed customer expectations from simple access to information to the intelligent application of that information;
2. The Network Effect – how new entrants in multi-sided markets can move and scale quickly, and how incumbents can either adapt leveraging the complexity of the market to protect themselves, or be exponentially out-competed;
3. Cloud Business Models – we propose shifting the conversation from thinking about cloud in a computing sense, to thinking about cloud as a business model; and
4. Open Sourced Artificial Intelligence based Technologies – we discuss how next generation cognitive systems are coming online faster and with much greater intensity. Such systems are positioned to help solve problems that have never been solved before. We then bring these forces together into a Competitive Growth Model3 that depicts
their inter-relationships and provides the framework for how financial institutions should consider their strategic options. Davenport and Harris (2007), in their research, defined analytics as ‘the extensive use of data, statistical and quantitative analysis, explanatory and predictive models and fact-based management to drive decisions and actions. Analytics are a subset of what has come to be called business intelligence: a set of technologies and processes that incorporates the collection, management and use of data to understand and analyse business performance’4. Meanwhile, Siegel (2013),
in his research on predictive analytics defines it as ‘technology that learns from experience (data) to predict the future behaviour of individuals in order to drive better decisions’5. These definitions have
been adopted in this report.
2.1 From the information age,
to the personalisation age
‘Information about
transactions, at some
point in time, will become
more important than the
transaction themselves.’
Walter Wriston,former Chairman and CEO of Citigroup
Much of the innovation that occurred in the 20th century financial services
industry was about providing access to money. For example, credit cards gave consumers a chance to pay without needing the cash on hand, while automatic tellers gave 24-hour access to cash. The most important attribute for institutions in this model was trust; primarily trust that the money placed with them would be returned when needed.
The early 21st century has been about
access to information. Consumer marketing and services have collided with financial products through loyalty schemes, tailored interest rate offers and integration of financial management tools with regular banking products. Increasingly, information is gaining value in its own right. Whether it is simple information (in terms of rapid market data) or complex (such as advice from a professional based on detailed analysis of an individual’s situation), consumers are increasingly willing to assign value to data and information in its own right. This shift in behaviour runs in parallel with the assumption by consumers that institutions will treat their personal information with both care and respect – care in terms of protecting it from abuse, and respect in terms of not abusing the privileged access that the individual is allowing by agreeing to use the institution’s banking, insurance or investment products.
Institutions that have a wider, more valuable relationship with the customer can leverage that relationship to discount the cost of collecting valuable data in the future – providing them with a significant competitive advantage.
The Future of Financial Advice reforms introduced in Australia in 2013 reflect, among other things, a move towards unbundling information and insight from products. Arguably, such a shift would have been unthinkable a generation ago, but has been made possible by the public’s increasingly sophistication approach towards the value of information. If the rapid evolution of social media and the explosion of information shared through it is anything to go by, future generations may be even more relaxed about unbundling information.
The Internet reinforced reluctance on the part of consumers to pay for information that they are used to getting for free. Similarly, they have greater expectation of recompense (in some form or other) for the value of the information that they share with institutions. A good example of actually paying customers can be found in the collection of up-to-date contact information. An insurance company wanted to ensure the accuracy of customer details and ran an experiment. Three randomised groups of customers received forms in the mail to update their details together with a pre-paid envelope. The first group were simply asked ‘please’. The second group were offered a nominal fridge magnet as a ‘thank-you’. The third was offered a more substantial financial incentive.
2.0 MAJOR COMPETITIVE
GROWTH FORCES
We begin the discussion by considering how analytics will
impact four major competitive growth forces, and how these
will redefine the environment in which tomorrow’s financial
service providers will compete and grow.
The results were surprising. While the first group (with no returned value) had a poor response rate, the second and third groups had little to separate them in terms of return rates. The conclusion was that customers put a value on their relationship with the insurer, which provided a part-payment for the information, with only a small incremental payment required to realise that value. In light of that conclusion, institutions that have a wider, more valuable relationship with the customer can leverage that relationship to discount the cost of collecting valuable data in the future – providing them with a significant competitive advantage.
2.2 The Network Effect – Protection
or Opportunity
‘Peer-to-peer lenders
like SocietyOne are very
well placed to offer more
creditworthy Australian
borrowers a better deal and
give more investors direct
access to attractive new
fixed income asset classes.
This is why peer-to-peer
lending works.’
Matt Symons, CEO SocietyOne
Financial services relationships range in nature from highly transactional through to highly consultative and collaborative, involving many participants (e.g. the consumer, merchants, traders, banks, schemes, their families, employers, financial advisers, brokers, regulators and third parties). The buyers pay in a variety of forms, including access to their money, future promises of interest and access to markets through their buying activities. Financial services products are, in fact, usually best described in terms of networks, with all of the actors connected together through ecosystems with complex business rules. Economists might describe this as a ‘two-sided market’ (see Figure 1).
Figure 1: Illustration of Two-Sided Markets
Source: Deloitte Research and Telstra Research, 2014
PAYMENTS
PEER-TO-PEER
COMPARISON SITES
2.0 MAJOR COMPETITIVE
GROWTH FORCES (CONT.)
A two-sided market is a sophisticated relationship between buyers and sellers. The market’s nature is to have a group of customers who have a many-to-many relationship with a group of providers (who may themselves also be customers). In the middle is the facilitating organisation, in this case a financial institution, thus creating a ‘multi-sided platform’. Examples of two-sided markets, or organisations providing multi-sided platforms, are the major credit card companies, social networks or – more contemporarily – peer-to-peer lenders. In each case, these platforms provide a network benefit that amplifies as the number of participants increases, as demonstrated by the rapid growth of organisations such as Lending Club, Prosper in the rapidly growing peer-to-peer market, and PayPal in the payments market (see Charts 1 and 2).
As scale is such a significant advantage for multi-sided market platforms, consolidation tends to occur very quickly. For example, Alibaba (China’s equivalent to Amazon), became a US$16 billion lender in less than three years and China’s largest seller of money market funds in only seven months6. While
there are periods of innovation when lots of new entrants join the market, the winners quickly emerge and are either acquired or begin to do the acquiring. This is a turbulent period for incumbents, as they need to make the right bets to ensure their scale advantage puts them in a position to be doing the acquiring rather than risk losing market share and potentially being acquired or eliminated. A recent example of this is Australia’s Westpac Banking Corporations new venture capital fund taking an equity stake in Sydney based peer-to-peer lender SocietyOne.
Whilst new entrants in multi-sided markets can move and scale quickly, incumbents can also adapt by leveraging the complexity of the market and their understanding of its nuances. However, a player that chooses not to adapt, relying on the complexity of the network to protect them, can be rapidly out-competed.
Chart 1: Combined Peer-to-Peer Issued Loans January 2014 by Lending Club and Prosper (Billions US Dollars)
Chart 2: PayPal Annual Mobile Payments Volume 2008-13 (Millions US Dollars) Source: Lending Memo
Whilst new entrants in multi-sided markets can move and scale quickly, incumbents can have the advantage of understanding both the complexity and nuances of the market.
Source: Statista 5000
0
2008
25 141 750
4000
14000
27000
2009 2010 2011 2012 2013
10000 15000 20000 25000 30000 4.5 2.5 B ill io ns 3.5 1.5 4.0 2.0 3.0 0.5 1.0 0.0 D ec 07 D ec 08 D ec 09 D ec 10 D ec 11 D ec 12 Ju n 08 Ju n 09 Ju n 10 Ju n 11 Ju n 12 Ju n 13 D ec 13 Lending Club Prosper
2.3 Cloud – it’s not new technology,
it’s new business models
‘Ultimately, the cloud is
the latest example of
Schumpeterian creative
destruction: creating
wealth for those who
exploit it; and leading to the
demise of those that don’t.’
Joe Weinman, Senior Vice President at Telx and author of Cloudonomics: The Business Value of Cloud ComputingBut what of the innovative ideas and products sitting on top of these multi-sided platforms? Many of these will be delivered in app-centric services that help simplify consumers’ lives by synchronising data, simplifying contact, integrating online purchases, accessing and aggregating content. To say consumers have adopted this approach is a wild understatement. Consumers will typically quickly embrace a simple way to manage their banking or investment (particularly superannuation) products in a similar way.
The common attribute of these services is data. Almost every action taken by a consumer using cloud services generates masses of data that can be used to augment the existing customer data that financial institutions already hold – often substantially increasing its value.
Smart institutions will use this data and analytics on it to help consumers simplify their lives by anticipating their needs and creating value-added services that support the increasingly dynamic lifestyles we choose. The smartest institutions will take a leaf from the leading technology companies and encourage their customers to curate their own data to improve its accuracy, and the accuracy of the associated insights derived from it. The customer wins by receiving a more personalised service and the organisation wins by improving the quality of predictions applied to the broader market as well as the individual. The competitive market for customers means that everyone is looking for an edge, something to bundle or a new way to add value. With cloud, the third party becomes a service that can participate in the client experience and derive value from it while leaving the client relationship intact. An example of this is the Commonwealth Bank of Australia’s Property Guide – this augmented reality app is powered by realestate. com.au and rpdata.com and bundles property information into a value added application for consumers searching for real estate.
It is likely that we will see an increase in financial institutions partner with third parties such as retailers to provide an integrated online experience. Why would a customer want to go all the way through to an online store if all they want to do is repeat a purchase they made in a previous month? Their credit card statement on the Internet banking portal is the ideal place they could go to repeat the purchase. Done properly, this could be a true cloud service with a seamless set of rich shopping applications embedded.
Everyone is looking for an edge. With cloud, a third party can participate in the client experience and derive value from it while leaving the original client relationship intact.
While change is a challenge to incumbents (who have scale), cloud computing provides an exciting opportunity to create an agile
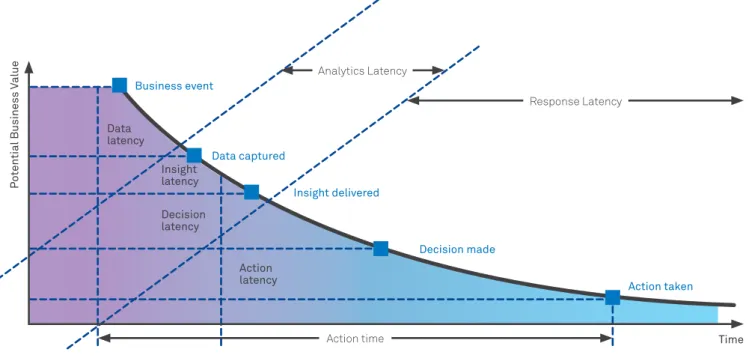
organisation with an extended ecosystem into other industries, and to launch products in response to new entrants almost as quickly as they appear. The ability to source data, analyse it and respond to the resulting insights will become a distinguishing characteristic of banks competing digitally. Importantly, cloud affords enterprises with the necessary agility to reduce the latency and associated risks associated with the lifecycle from the opportunity event through to taking action (see Figure 2).
Figure 2: The steps involved in taking action to respond to business events
Source: TIBCO
2.0 MAJOR COMPETITIVE
GROWTH FORCES (CONT.)
2.4 Artificial Intelligence Cognitive
technologies that educate
themselves, support expression and
deliver expertise, continue to evolve
‘Analyse the past, consider
the present and visualise
the future.’
Thomas J. Watson, Senior – IBM Chairman 1914-1956
When John Von Neumann started work in the 1940s on what has become the blueprint of all modern computers he imagined that computers could solve any problem. Von Neumann was a mathematician. He saw the world through a mathematician’s eyes, believing anything could be modelled with mathematical precision using the language of mathematical symbolism.
Unsurprisingly, he built his computers based on mathematical ideals, programmatic logic, and defined rules. For over 60 years, this is what we have come to know of computing.
Unfortunately, what we have come to know of life is far less structured, organised, absolute, or even logical. Just take a look at how we communicate. Our language is full of innuendos, subtleties, idiosyncrasies, synonyms, metaphors and complex concepts for expressing abstract ideas. Why is it that noses run? Can houses really burn up as they burn down? Our communication with each other is ambiguous, illogical and very imprecise. And yet, it also turns out to be very effective. The paradox of the human condition is that it is our ability to reason, infer, and extrapolate from our interactions with others that makes us so efficient at affecting results with each other. Our minds are especially adept at producing and consuming information in this imprecise form.
As a consequence, our world is flooded with this messy, imprecise, and yet amazingly useful information – in the form of words, pictures, video, and audio recordings. In fact, 80% of all the digital information in the world is in the form of this unstructured information. Everything else is beyond the reach of traditional computing, leaving the vast richness of unstructured data to the limitations of what can be unlocked by the human mind. Given that 90% of the world’s data was created in the past two years7, this is
an exceptionally tall task.
However, with the advent of Cognitive Systems, that is changing. When IBM’s Watson bested the two grand champions (Ken Jennings and Brad Rutter) in the U.S. game show Jeopardy!, it represented a historic milestone and proof point that computers could go beyond what Von Neumann had envisioned. It was a system that read, understood, learned and, arguably, began to reason.
Analytics Latency
Response Latency
Time Data
latency
Business event
Data captured
Insight latency
Decision latency
Action latency
P
ot
ential
Business V
alue
Action time Insight delivered
Decision made
Consider a financial question that needs to be resolved and the complexity of that question. Consider this wealth management example:
Steve, a financial planner, conducted a quarterly financial review with a client today. He is 38-years old, married, father of two (12 and 14) and has a moderate-risk investment tolerance. His goals continue to be aligned with his children’s education and retirement. He is currently heavily weighted towards small-cap growth funds, including a 24% stake in International Small-Cap mutuals. He also has a 14% portfolio stake in a property fund that specialises in retirement properties that is in its 3rd year, and is showing signs of being sold out to a well-funded investment group. This client captured losses last year that significantly reduced his income tax burden, but is not likely to repeat that against the broad market gains he’s enjoyed this year with his current allocation. He’s looking to explore shifting more of his holdings into tax-sheltered municipal bonds. However, he is suspicious of the stability of large municipalities, given the recently reported bankruptcy of a large city in that region.
Steve asks, what alternative bond funds would address my clients concern and align to his long-term goals?
Many of the more important questions we ask are really quite complex – involving contextual history, judgments, priorities, assumptions, observations, assessment, pre-conditions, and so forth, as a preface to the actual question we want to ask. And that preface can be full of jargon, technical elements, relative values, grammatical devices, and subtleties that are significant to the disciplines of the domain. But the use of the language can convey far more significant information that any enumerated list of structured data could ever offer – all of which is germane to answering the question.
And, of course, to find an answer to the question also requires the evaluation of complex ideas, knowledge, art and science captured in enormous reams of literature. The task of reading the thousands of reports, articles, papers, journals, studies, books, blogs, forums, and web pages that are produced every day (over 2.5 quintillion bytes or about 170 newspapers for every man, women, and child on the planet8) – even when
narrowed to just those sources that are relevant to our discipline – is practically impossible.
This is the significance of a cognitive system: to be able to understand the language as well as we do ourselves, be able to read mountains of literature to find answers in seconds, and learn from the experience getting smarter with each action, outcome and new piece of information.
To understand this better it is worth delving deeper in to what defines a cognitive system. For example, IBM’s Watson is a system that is able to learn its behaviour through education; that supports forms of expression that are more natural for human interaction; whose primary value is its expertise; and that continues to evolve as it experiences new information, new scenarios, and new responses; and does so at enormous scale. We refer to these as the ‘four-Es’ of cognitive systems.
Access to information often leads to new insights for the user that enables them to discover risks and opportunities that might otherwise be elusive.
Today, Watson is able to command the language of the domain, from which it can answer questions, becoming the perfect assistant, coach, or concierge. That has the power of enabling users to find important information for their job – information that would otherwise be too hard to find in the river of literature flooding in to their work every day. More so, access to this information often leads to new insights for the user that enables them to discover risks and opportunities that might otherwise be elusive. Banks such as DBS Bank in Singapore, Citi in the USA, ANZ in Australia and Nedbank in South Africa have been early pioneers with Watson in financial services.
2.0 MAJOR COMPETITIVE
GROWTH FORCES (CONT.)
2.5 Competitive Growth Model
– where to enter, adapt or be
exponentially out-competed
‘Frankly, I am more
concerned about those
two guys in a garage than
the competitors I already
know about.’
Jeff Bezos – Amazon.com founder
We now bring these four competitive forces together into a model to explain their inter-relationships while also taking into account the impact of technology proliferation and inter-generational wealth transfer on the financial services landscape.
The intensity of competition has increased significantly – a trend that will only accelerate as digital proliferation and inter-generational wealth transfer make traditional markets attractive for new entrants.
We are now seeing new entrants venturing into the financial services market with increasing regularity. Indeed, the competitive forces outlined almost
invite entrants from non-traditional industries, who can leverage their cloud-enabled data holdings and the analytics capabilities they have developed (see Chart 3).
Chart 3: Competitive Growth Model
Definitions
Save Total Deposits
Spend Amount spent (last four weeks) on credit and debit cards (i.e. does not include cash or direct payments)
Borrow Total amount outstanding on all loans and amount intending to carry forward on credit card
Invest Total direct investments, managed investments, property investments (excluding primary residence) and superannuation
Source: Roy Morgan and Telstra Research, February 2014
Today’s competitive forces almost invite entrants from non-traditional industries, who can leverage their cloud-enabled data holdings and their analytics capabilities, to enter the market.
Save
Borrow Spend
Invest Age
0.4% 7.6%
0.2%(z) 20.2%
1.7% 22.2%
1.4% 10.7%
14-20 (Z) 21-34 (Y) 35-49 (X) 50+ (boomer, pre-boomer)
27.1% 65%
47.8% 31.8%
33.2%
43%
21.7% 66.2%
2.0 MAJOR COMPETITIVE
GROWTH FORCES (CONT.)
The twin mega-trends of technology proliferation and inter-generational wealth transfer places a new epicentre of disruptive innovation squarely focused on Generations X and Y. This opportunity has attracted new entrants in the form of technology-based start-ups and 21st
century information businesses pursuing adjacent strategies. This point was highlighted in a recent Finextra article (2014) titled ‘Millennials look to tech firms to replace unloved banks’9 referring
to a report on a three-year study of 10,000 people10, some of the key findings
of which were:
• 33% believe they won’t need a bank at all in the future;
• Nearly 50% are looking to tech start-ups to overhaul banking; and,
• 73% would be more excited about a new offering from Google, Amazon, Apple, PayPal or Square than their bank.
In another development, it was reported by the European press that Facebook has sought approval from the Central Bank of Ireland to start a service that would allow users to store money on Facebook and use it to pay and exchange with others11.
These attitudes are coming from generations that today include the greatest number of buyers of financial services. In the near future, inter-generational wealth transfer will also ensure these generations will hold the greatest pool of wealth in most countries. If their needs are unfulfilled, the research suggests they are quite willing to look beyond traditional providers. These non-traditional entrants, referred to by futurist Alvin Toffler as ‘The Micro-Multinational’, are often staffed by teams you can count on both hands and are unencumbered by legacy systems, legacy processes or legacy technologies. These players don’t see themselves as banks, but rather data companies. One such example is Zopa, a peer-to-peer lender founded in 2005 whose CEO, Giles Andrews, tellingly said: ‘The business is not a bank and I’m not a banker, we’re more of a data company’12.
These entrants share some common strategies:
1. Deliver Personalisation through creating digital propositions that are based on meeting the lifestyle needs of customers (as opposed to product orientations). Examples are Movenbank and Simple for digital mobile services;
2. Design Network Platforms to reach connected communities. These have demonstrated explosive growth, moving swiftly from start-up to mass-market relevance. Examples are PayPal in payments and Lending Club in peer-to-peer lending;
3. Operate Cloud Business Models by reducing barriers to scale with agile operations. Examples include Google Wallet for consumer and merchant payment services and Estimize – a service that facilitates aggregation of data from analysts for trading and investments; and
4. Leverage Open Source Artificial Intelligence Based Technologies in open collaboration that promotes universal access and redistribution. Some major financial services incumbents are already responding, including the Spanish bank BBVA, with their recent acquisition of Simple, and the direct investment by Australia’s Westpac, via its new venture capital fund, into SocietyOne. Interestingly, Westpac’s investment reflects a broader trend of global investment in FinTech ventures as captured by CB Insights, which tracks venture capital and emerging industries. Their data shows FinTech investment tripling from US$928 million in 2008 to US$2.97 billion in 2013, outgrowing overall venture capital spending by a factor of four13 (see Chart 4). Key to note
is that nearly a third of this funding in 2013 went into ventures focused on analytics and personal financial management (see Chart 5).
Governments, too, are noting the importance of these new entrants and new models. In a move to encourage greater access to credit, the UK’s Chancellor of the Exchequer invited proposals to establish an independent referrals exchange process so that small businesses turned down for credit by a bank would be automatically referred to other credit providers, such as crowd-funding and peer-to-peer platforms15.
In Australia, in its submission to the Financial System Inquiry, Federal Treasury has requested it consider the scope for promoting services by redesigning product disclosure requirements for the digital age; it suggested innovation to enable the growth of ‘information intermediaries’ that can apply expertise in presenting information in a more effective way. Data analytics are at the heart of how these new entrants are establishing, competing and disrupting. We now consider how ready traditional players are for this new competitive environment, and discuss the transformation
implications.
Nearly a third of FinTech funding in 2013 went into ventures focused on analytics and personal financial management.
Chart 5: FinTech Investment Areas
Sources: Accenture CB Insights, 201314
2008 10%
26% 33% 23%
29% 32% 10%
11% 4% 9%
10% 4% 6%
7% 8% 10%
19% 6%
5%
6% 7% 12% 14%
6% 70%
50% 49% 46%
28% 53%
2009 2010 2011 2012 2013
Banking & corporate finance Capital markets Data analytics Payments Personal finance management
Chart 4: FinTech Financing Activity (US$)
Sources: Accenture CB Insights, 201314
United States Europe Asia-Pacific Other Global Investment
0 0
200
2000
50 500
250
2500
100 1000
300
3000 450
150
1500 350
3500 500
Deal v
olume
In
ves
tments (SM)
Firstly, we gain an understanding of the strategic importance, competitive readiness and maturity of financial insitutions in the Asia Pacific region and how any transformation may affect them. Secondly, through new consumer research, we look to gain an understanding of what analytics-enabled experiences consumers value, and their associated business impact.
3.1 Methodology
This section has two parts. In 3.2, we summarise the key findings from a qualitative study conducted by Telstra up to May 2014 from interviews and surveys with 43 C-Level executives from banks, credit unions, insurance providers, payment schemes, trading exchanges and consumer and commercial finance providers across Australia, New Zealand and Asia. The objective of this research was to understand the competitive readiness of institutions, the maturity of their analytics capabilities, and their expectations in terms of their investments and the returns on this investment.
In Section 3.3, we present the key findings from a quantitative study, commissioned by Telstra, of consumers in five countries: Australia, Singapore, Malaysia, Indonesia and Hong Kong. The objective of this research was to understand attitudes towards current financial services providers in local markets and determine the current digital behaviour of consumers. Additionally, we wanted to gauge local perceptions of five analytics-enabled experiences and assess the potential impact of these on current behavioural patterns.
This study consisted of 3,106 surveys with a sample of consumers who have at least one of the following products for personal use: general transaction/ savings account, home loan, credit card, high interest account, term deposit, personal loan or investment (e.g. unit trusts or managed funds). The online surveys were conducted from February to March 2014. The dataset in
each country was weighted to be representative of the total population aged 20-69 years, according to region, age and gender.
3.2 Asia Pacific Financial Institution
and Service Provider Competitive
Readiness Study
‘I wanted to build a
company. I had no money, I
had no business experience
and I had no business idea.
So I was perfectly qualified.
I didn’t want to build a
bank. I wanted to build
a technology company.
Many days I went to work
wondering if it would be my
last day. There were many
near-death experiences
over the first five years.
Our idea involved doing the
business differently and
that was hard to sell.’
Rich Fairbank, CapitalOne CEOThe objective of this study was to understand how institutions viewed current and future levels of readiness to compete analytically. Here we assessed their level of capability maturity, its strategic importance to their organisation, levels of investments, the benefit expectations, and importantly, which group within the organisation is now driving strategy, requirements and investments in analytics. The framework used in section 3.2.1 and 3.2.2 was developed and published by Davenport & Harris (2007) and applied to the sample.
3.2.1 Attributes of Analytical Competitors
Davenport & Harris (2007) define an analytical competitor as ‘an organisation that uses analytics extensively and systematically to think and out-execute the competition’. Based on their study, they found that the most analytically sophisticated and successful organisations had four common
characteristics:
1. Analytics supported a strategic, distinctive capability;
2. The approach to, and management of, analytics was enterprise-wide; 3. Senior management was committed to
the use of analytics; and 4. The company made a significant
strategic bet on analytics-based competition.
3.0 THE DATA ANALYTICS INDUSTRY
AND CONSUMER RESEARCH
Having now considered some of the competitive and growth
forces at play – and the importance of personalisation, the
network effect, cloud business models and open source
technologies – we now turn our attention to evaluating
financial institutions, their customers and the opportunities
for transformation.
Figure 3: Four Pillars of Analytical Competition
Source: Reproduced with permission from Harvard Business School Publishing Corporation and Telstra Research, 2014
32% 49% 83% 16%
D
is
ti
n
ct
iv
e c
ap
ab
ili
ty
E
n
te
rp
ri
se
-w
id
e a
n
al
yt
ic
s
S
en
io
r ma
na
gem
en
t c
om
m
it
m
en
t
La
rg
e-sc
ale
a
mb
it
io
n
Importantly, they describe each of these characteristics as being broadly equivalent in terms of importance for defining an analytical competitor. The characteristics were not independent of each other, but should rather be viewed as four pillars supporting an organisation’s analytical capability.
Increasingly, analytics is being seen as an enterprise-wide issue, rather than being the sole province of one line of business.
Our study of financial institutions confirms these characteristics, but identified a 17% gap with only 83% reporting to have senior management commitment to data and analytics. This was reflected structurally too, with 49% of respondents reporting an enterprise-wide approach to analytics – thus indicating a shift from the capability being managed by a single or multiple line(s) of business to being organisation-wide through a centre of excellence (see Figure 3).
3.0 THE DATA ANALYTICS INDUSTRY
AND CONSUMER RESEARCH (CONT.)
3.2.2 Assessing the Degree of Analytical Competitiveness
Davenport & Harris (2007) also detail a maturity model that outlines five stages on the path that an organisation follows – from having virtually no analytical capabilities (Stage 1) to being an analytical competitor (Stage 5). Figure 4 summarises these stages.
Figure 4: The Five Stages of Analytical Competition
Organisation: • Flies blind
• Asks what happened to business
• Focused on getting accurate data to improve operations • No analytical
performance measures in place IT:
• Data quality low • Multiple data
definitions • Poor integration of
data and analytics into systems
Organisation: • Opportunity-driven
usage
• Asks what can it do to improve analytical capability • Uses analytical
capability to improve one or more functional activities
• Measures ROI on individual applications IT:
• Collects transactional data efficiently • Lacks right data for
decision making
Organisation: • Begins efforts to
integrate data and analytics • Asks what’s
happening now • Can extrapolate
trends
• Uses analytics to improve distinctive capabilities • Measures are based
on future performance and market value IT:
• Proliferation of business intelligence tools and data warehouse • Data remains
unintegrated, non standardised and inaccessible data and analytics
Organisation: • Enterprise wide
perspective • Able to use analytics
for point advantage • Knows what to do to
get to next level, but not quite there yet • Asks how analytics
can help innovate and differentiate • Builds broad
analytical capability • Measures analytics as
drivers to improve business performance and create value IT:
• High quality data • Enterprise wide
analytics plan, IT processes and governance • Some embedded or
automated analytics
Organisation: • Enterprise wide
analytical capability generating big performance results and sustainable competitive advantage • Asks what’s next,
what’s possible, how to stay ahead of game • Is an analytical master
fully competing on analytics
• Measures success by how analytics are the primary driver of performance and value creation IT:
• Fully fledged analytic architecture that is enterprise wide, fully automated and integrated into processes and highly sophisticated
STAGE 1
Analytically ImpairedSTAGE 2
Localised AnalyticsSTAGE 3
Analytical AspirationsSTAGE 4
Analytical CompanySTAGE 5
Analytical Competitor27%
46%
17%
5%
5%
The results of our study indicate that, to this point in time, 5% of financial institutions across Asia Pacific consider themselves to be analytical competitors (Stage 5). This result was consistent with the study by Davenport & Harris, who identified that analytical competitors in their US study were from information-intensive services firms – four of whom were financial services firms. Of interest in our study was that one of these organisations was an online-only institution born in the 21st century;
another was a 20th century institution
that had transformed.
The results indicate that approximately one in three (27%) are on the verge of competing analytically (Stage 4). We can expect that these organisations are likely to have already made the large investments in the requisite technology, people and processes and are now progressing to embedding the capability into strategy, products and systems. A survey by Gartner16 found that the Big
Data hype was translating into increased investments in, and adoption of, Big Data technology. The industries furthest along the adoption curve came from the banking sector, with 13% already deployed.
Nearly one in two (46%) respondents perceive themselves as having analytical aspirations, but still require major investments in capability (Stage 3). They are most likely to still be developing strategy rather than capability. They are also likely to be developing business cases to support capability investments across the organisation. This result is consistent with the broader findings of a study by SAP and Bloomberg of 100 banking executives in 2013. That study found that only 46% of banks can analyse external data about customers, only 32% could analyse social media activity, and only 29% could analyse share of wallet17.
Approximately 17% of respondents perceive their capabilities as being more localised (Stage 2). They are more likely to be using analytics to support tactical activity, such as reporting, but do not use the capability to compete. Only a small proportion (5%) perceives their organisations as analytically impaired (Stage 1) (see Figure 4).
The overall results indicate a significant gap of 68% in the data and analytics and competitive organisational readiness, with only 32% perceiving that they are on the verge of (Stage 4), or ready (Stage 5) to compete using data and analytical capability.
Nearly half the organisations surveyed have analytical
aspirations, but still require major investments in capability. They are most likely to still be developing strategy rather than capability. 3.2.3 Level of Strategic Importance
Respondents were asked where data analytics ranked in their organisation’s strategic priorities for FY14. The result of ‘4th’ was an average across the sample,
but it was reported that it has made a very rapid entry onto the corporate strategic agenda (see Figure 5). In a global retail banking study by PwC, 90% of executives agreed that ensuring they can harness the power of Big Data is one of the six key priorities for leading banks today. Of interest in that same study was that only 20% feel well prepared or are investing to address those priorities18.
Figure 5: Ranking in Top 10 Strategic Priorities
4th
Source: Telstra Research, 2014
3.2.4 Expectation on Improving Results
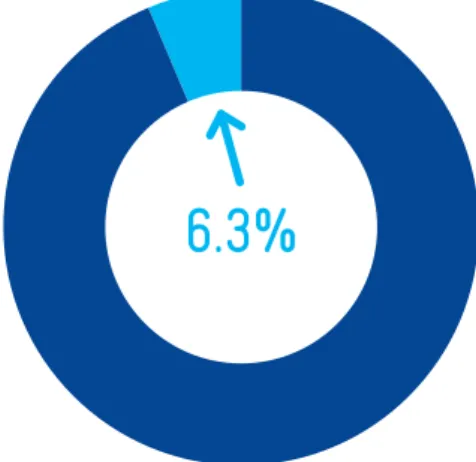
Respondents were asked to what percentage performance improvements they were expecting from the
introduction of analytics capabilities. The result of 6.3% was an average across the sample, and reflects how the majority of institutions reported being Stages 3, 4, and 5 in their degree of competitiveness, with a clear understanding of benefits (see Figure 6).
Figure 6: Results Performance Improvement Expectations (%)
6.3%
Source: Telstra Research, 2014
Companies that invest in Big Data analytics outperformed their peers by 5% in productivity and 6% in profitability.
3.2.5 Level of Investment
Respondents were asked what percentage of their organisation’s budgets was allocated toward analytics projects. The result of 6% again reflects the level of strategic importance and benefit realisation that this area now occupies in the organisational program (see Figure 7). This result is consistent with Ovum’s findings that investment by retail banks is expected to accelerate between 2014-2018, with the growth rate ranging between 5.3% and 6.4%19.
Gartner further reported that 34% of bankers and 26% of insurers have already invested in Big Data, with 24% of bankers and 40% of insurers planning to invest within the next two years. Gartner also noted that 44.7% of organisations across many industries in the Asia Pacific region have ambitious plans to invest over the coming two years20.
In another study by McKinsey and Massachusetts Institute of Technology, it was reported that companies that invest in Big Data analytics outperformed their peers by 5% in productivity and 6% in profitability21.
Figure 7: Data Analytics FY14 Budget Proportion (%)
6%
Source: Telstra Research, 2014
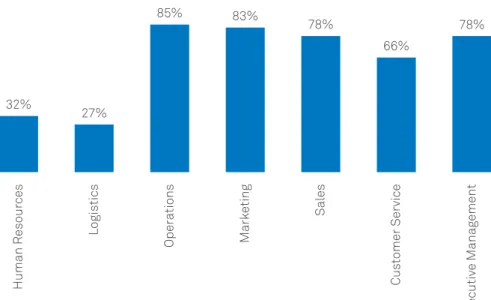
3.2.6 Departmental Stakeholders
Respondents were asked to select which departments were stakeholders in analytics capabilities. What we found was that 66%-85% of respondents are using analytics for sales, marketing and
service-related activity with marketing (at 39% of respondents) now emerging as the clear leader in driving strategy, requirements and investments in this area (see Charts 4 and 5).
32%
27%
85% 83%
78%
66%
78%
Human R
esour
ces
Logis
tics
Oper
ations
Mark
eting Sal
es
Cus
tomer Service
Ex
ecutiv
e Manag
ement
Chart 6: Departments Using Data Analytics (%)
Source: Telstra Research, 2014
3.0 THE DATA ANALYTICS INDUSTRY
AND CONSUMER RESEARCH (CONT.)
The overall results indicate a significant gap of 68% in the readiness of institutions to compete on data analytics, with only 32% perceiving that they are on the verge of competing, or ready to compete, using data analytical capability. Further, there was a 17% strategic priority gap identified with only 83% reporting to have senior management commitment to data analytics. These gaps explain the significant investments (averaging 6% of organisational budget in FY14) being allocated for data analytics projects. Corresponding expectations for performance improvements averaged
approximately 6.3%. Clearly, growth is the major driver of investment, with 68% of Sales and Marketing departments now driving the data analytics strategy, requirements and investment programs.
YES
Operations Marketing Sales Executive Management Other
Chart 7: Department Leading Data Analytics Strategy, Requirements, Investment (%)
Source: Telstra Research, 2014 24%
8% 10%
39%
19%
3.3 Analytics-Enabled Consumer
Experience Study
Respondents across Australia,
Singapore, Malaysia, Indonesia and Hong Kong were asked to evaluate a series of analytics-enabled service concepts. The concepts were shown to respondents in a random sequential order in order to ensure a reliable analysis of all concepts. Descriptions of each concept are provided in 3.3.1.
For each concept, respondents were asked to indicate the level of appeal of that concept, as well as the likelihood of using this service if it were offered by their main financial service provider.
Those who indicated they found the concept appealing and were likely to use it, were also asked to indicate how the concept would impact on their satisfaction levels, likelihood to recommend their provider to friends and family, the impact on consideration when switching financial services provider and the impact on consideration when opening new accounts with their current financial services provider.
As well as these metrics, respondents were also asked about the likely impact of each concept on their perceived banking experience. Nine items were tested as baseline (i.e. ‘pre’) measures prior to the concept evaluation; for example, one of the tested items was: ‘Knows me and my financial situation, irrespective of how I use the bank or financial institution (e.g. in person, in a branch, contact centre or online)’. The full list of items is shown in Table 1. Respondents were asked to indicate how well their main financial institution performed on each item.
During the evaluation of each concept, respondents who had indicated they were likely to use that concept were then asked to rate how well or poorly each concept would deliver on these same experience measures if provided by a financial institution (i.e. a ‘post’ measure). Not all metrics were rated for each concept, only those experiences that were appropriate for that concept. For the analysis of this data, the difference between the pre measure and the post measure was calculated to create an impact score. The impact scores were then averaged out across the five countries to provide a single experience impact score for each of the nine attributes. In this report, we highlight which two experiences are most impacted (across all countries) for each concept.
3.3.1 Concept Descriptions and Perceived Banking Experience
A
Personalised In-Branch Experience
An in-branch experience that is personalised and customised to your needs.
This is a service you would opt-in to use which would allow bank branch staff to receive a notification as soon as you arrive at a branch. This notification would contain information about your recent interactions with the bank and your financial history, allowing the branch staff to offer a more customised and personalised experience in your visit to the branch without you having to explain it.
3.0 THE DATA ANALYTICS INDUSTRY
AND CONSUMER RESEARCH (CONT.)
B
Personalised Contact Centre/ Telephone Experience
A contact centre/telephone experience that is personalised and customised to your needs.
This is a service you would opt-in to use which would allow your call to a bank call centre to be personalised and customised based on the financial products you hold, or have enquired about with that bank. For example, the menu options you hear once you have identified yourself when waiting on the phone would be customised so that you only hear options that are relevant to you.
C
Personalised Digital Banking Experience
Personalised digital banking experiences.This service would allow you to access digital tools and insights to help manage your finances such as saving, spending, borrowing or investing. These tools and insights could include things like calculators, tracking of your spending and savings in real time with relevant ads, alerts, recommendations and notifications sent to you based on your financial behaviour. This service would be accessed online on any device (e.g. a smartphone, tablet or computer).
D
Digital Advice
Integrating banking, financial and insurance services advice.
This service would allow you to access specialist advice on banking, financial and insurance services. This service would offer advice in a number of different ways: virtual/digital advice (e.g. advice accessed using speech/voice recognition technology or online), access to a specialist/expert in person, via video chat or over the phone and advice via social networking with customers who have similar banking and financial services needs to you.
E
Insurance Customised to Behaviour and Lifestyle
Insurance customised to your behaviour and lifestyle.
Insurance where your premium is calculated according to your specific usage patterns. Because you are only paying for what you use, the key benefit of this concept is that it will result in a fairer premium.
EXAMPLES
• Comprehensive motor insurance where your premium is calculated based on how often you use your car, how far you drive, and where you drive or park your car. This information is accurately captured by a GPS type device installed in your car and transmitted back to your insurer.
• Private health insurance where your premium is calculated according to your specific lifestyle, such as how often you exercise and receive medical check-ups. This information may be captured via an application (app) you install on your smartphone or another device.
• Home and contents insurance where your premium is calculated according to the monitoring devices installed on windows and doors throughout your home. This information is accurately captured by a monitoring device installed in your home and transmitted back to your insurer.
• Life insurance where your premium is calculated and adjusted according to your lifestyle - for example whether or not you use public transport, exercise regularly and receive medical check-ups. This information may be captured via an application (app) you install on your smartphone or another device.
3.0 THE DATA ANALYTICS INDUSTRY
AND CONSUMER RESEARCH (CONT.)
1. Provides easy-to-understand, digital explanations of products
6. Provides information that helps me achieve my goals, such as saving, spending, borrowing or investing 2. Access to banking experts when I need them, through my preferred way of interacting with them
7. Knows me and my financial situation, irrespective of how I use the bank or financial institution (e.g. in person in a branch, via a contact centre or online)
3. Proactively recommends products and services that are relevant to me with enough information on the product for me to make decisions
8. Provides me with tools and insights to help me manage and control my finances, specifically saving, spending, borrowing and investing
4. Provides information on products in an engaging way
9. Alerts me when something relating to my finance occurs that I need to know about 5. Provides information in a way that is easy for me to access
Table 1: Perceptions of Banking Experiences
The following section outlines the research findings of the concept evaluation. Please note that throughout the analysis, the scores in Asian countries are consistently higher than those in the Australian market. While this is the case, it does not necessarily mean that all of these concepts will perform better in these Asian online markets than in the Australian market, as there could be several reasons for this, two of which include:
1. Cultural factors can encourage some respondents to indicate more positively when evaluating potential market concepts; and
2. The Internet may be less integrated into the general population in some Asian markets. As a result, the online population in these countries may represent a more ‘early adopter’ orientation than in more mature markets such as Australia, where the online population is now considered to be broadly representative of the total population. This will result in Asian consumers being more open to trying new market concepts.
As such, specific results should always be viewed in the context of all concepts within each country (i.e. what is the highest ranked concept as opposed to the lowest ranked concept in Australia?) rather than across countries.
3.3.2 Appeal and Impact of Concepts
Each of the five digital service concepts achieved high appeal levels in all countries.
Chart 8 shows the appeal ratings for each concept by the individual countries, as well as the experiences most affected for each concept, across all countries.
Chart 8: Appeal and Experience Perception Impact by Country
Australia
Hong Kong
Singapore
Malaysia
Indonesia
Access to banking experts when I need them through my preferred way to interact with them Proactively recommends products and services that are relevant to me Knows me and my financial situation, irrespective of how I use the bank or financial institution
Provides me with tools and insights to help me manage and control my finances, specifically saving, spending, borrowing and investing
Perceptions Changed
43
60
56
60
78
38
58
62
70
86
28
51
45
57
78
50
50
61
61
78
41
57
57
64
82
Appeal Score Card
(%) (total population)
Impact on Experiences with Financial Institutions
A. Personalised In-Branch Experience
B. Personalised Contact Centre/ Telephone Experience
C. Personalised Digital Banking Experience
D. Digital
Advice E. Insurance Customised to Behaviour and Lifestyle
Indicates top two experiences per concept Indicates two highest concepts per country
Source: Telstra Research, 2014