FREQUENTLY ASKED
QUESTIONS
2 NATIONAL KIDNEY FOUNDATION
MEASUREMENT OF KIDNEY FUNCTION
4
1) What is GFR? 4
2) How is GFR measured? 4
3) What does GFR indicate? 4
4) Why measure GFR as an index of kidney function? 4
5) Why are GFR estimates adjusted for body surface area? 5
6) How does age affect GFR? 5
7) What is the difference between creatinine clearance and GFR? 5
8) What is the currently recommended method to estimate GFR? 5
9) What is the Cockcroft-Gault formula? 5
10) What is the MDRD Study equation? 5
11) What is the CKD-EPI equation? 6
12) Why are there different estimated levels of GFR for African Americans,
males and females, and people of different ages? 6
13) Are there terms for races or ethnic groups other than African Americans? 7
14) Are calculators available for the CKD-EPI or MDRD Study equations? 7
15) Why do some laboratories only report numerical values when estimated GFR is <60 mL/min/1.73 m2? 7
16) What are the problems associated with using estimating equations? 7
17) Can serum creatinine alone be used to estimate kidney function? 8
18) What are the problems associated with the use of serum creatinine as a filtration marker? 8
19) What factors affect creatinine generation? 9
20) What factors affect creatinine secretion? 9
21) What is the impact of calibration and inter-laboratory variation of serum creatinine
assays on the estimation of GFR? 9
22) What factors affect the creatinine assays? 9
23) What was the effect of standardization of the creatinine assay on GFR estimates? 10
24) Are there any times when a 24-hour urine collection for creatinine clearance should be performed? 10
25) What is cystatin C? 10
26) Is cystatin C a more accurate filtration marker than creatinine? 10
27) Can cystatin C be used to estimate GFR? 11
28) Why are GFR estimates at higher levels of estimated GFR less accurate? 11
29) What problems are caused by the non-steady state of filtration markers after a change in GFR? 11
3 FREQUENTLY ASKED QUESTIONS ABOUT GFR ESTIMATES
INTERPRETATION OF GFR ESTIMATES
12
30) To which populations does the MDRD Study equation apply? 12
31) To which populations or individuals does the MDRD Study equation not apply? 12
32) To which populations does the CKD-EPI equation apply? 12
33) To which populations does the CKD-EPI equation not apply? 12
34) How do the CKD-EPI, MDRD Study, and Cockcroft-Gault equations differ? 12
35) If the Cockcroft-Gault equation is less accurate, why is it still used? 13
36) How can GFR estimates be used to detect CKD? 13
37) How should mildly reduced GFRs in patients without kidney damage be interpreted? 13
38) What course of action should be taken for a suspected false-positive test of eGFR <60 mL/min/1.73 m2? 14
39) What clearance measurements should be performed? 14
40) How can GFR estimates be used to detect progression? 14
41) Do some drugs affect the accuracy of GFR estimates? 14
42) How should estimates of GFR or creatinine clearance be used when dosing medications? 15
43) Should adjusted or unadjusted estimated GFR be used when dosing medications? 15
44) Can the estimating equations for GFR be used in acute kidney injury (acute renal failure)? 15
45) Can GFR estimates be used in hospitalized patients? 15
CHRONIC KIDNEY DISEASE
16
46) What is the public health problem associated with chronic kidney disease? 16
47) What is the definition of CKD? 16
48) What are the stages of CKD? 16
49) What are markers of kidney damage? 17
50) What is the recommended method to screen for proteinuria? 17
51) What are the complications and common comorbidities associated with chronic kidney disease? 17
52) Does the risk of complications increase as kidney disease progresses? 18
53) When should patients with kidney disease be referred to a nephrologist? 18
4 NATIONAL KIDNEY FOUNDATION
MEASUREMENT OF KIDNEY FUNCTION
1) What is GFR?
GFR (glomerular filtration rate) is equal to the total of the filtration rates of the functioning nephrons in the kidney.
2) How is GFR measured?
GFR cannot be measured directly. The urinary or plasma clearance of an ideal filtration marker, such as inulin, iothalamate or iohexol, is the gold standard for the measurement of GFR.1
How-ever, this is cumbersome and not used in clinical practice. Instead, serum levels of endogenous filtration markers, such as creatinine, have tradi-tionally been used to estimate GFR, along with urinary measurements in some cases. However, serum creatinine alone is not an adequate marker of kidney function.
3) What does GFR indicate?
GFR is usually accepted as the best overall index of kidney function. A clinician or medical labora-tory can estimate GFR from a person’s serum creatinine level and some or all of the following variables: gender, age, weight, and race.
• In most healthy people, the normal GFR is 90 mL/min/1.73 m2 or higher.
• A result of 60–89 mL/min/1.73 m2 without
kidney damage may be normal in some people (such as the elderly, infants).
• A result of 60–89 mL/min/1.73 m2 for three months or more, along with kidney damage (such as persistent protein in the urine), means the person has early kidney disease.
• When GFR is <60 for three months or more, chronic kidney disease (CKD) is present.
4) Why measure GFR as an index of
kidney function?
The level of GFR and its magnitude of change over time are vital to:
• the detection of kidney disease • understanding its severity
• making decisions about diagnosis, prognosis, and treatment
Normal GFR varies according to age, sex, and body size; in young adults it is approximately 120-130 mL/min/1.73 m2 and declines with age.
A decrease in GFR precedes the onset of kidney failure; therefore, a persistently reduced GFR is a specific diagnostic criterion for chronic kidney disease (CKD). Below 60 mL/min/1.73 m2, the
prevalence of complications of CKD increases, as does the risk of cardiovascular disease (CVD). Table 1 lists clinical conditions where assessment of GFR is important.1
TABLE 1: CLINICAL CONDITIONS WHERE ASSESSMENT OF GFR IS IMPORTANT
*
CLINICAL DECISIONS CURRENT LEVEL OF GFR CHANGE IN LEVEL OF GFR
Diagnosis • Detection of CKD
• Evaluation for kidney donation
• Detection of AKI
• Detection of CKD progression
Prognosis • Risk of CKD complications
• Risk for CVD • Risk for mortality
• Risk for kidney failure
Treatment • Dosage and monitoring for medications cleared by the kidney
• Determine safety of diagnostic tests or procedures • Referral to nephrologists
• Referral for kidney transplantation • Placement of dialysis access
• Treatment of AKI • Monitoring drug toxicity
Abbreviations: AKI: acute kidney injury; CKD: chronic kidney disease; CVD: cardiovascular disease.
*Reprinted with permission from the American Society of Nephrology via the Copyright Clearance Center. Stevens LA, Levey AS. J Am Soc Nephrol. 2009;20:2305-2313.
5 FREQUENTLY ASKED QUESTIONS ABOUT GFR ESTIMATES
5) Why are GFR estimates adjusted for body
surface area?
Kidney function is proportional to kidney size, which is proportional to body surface area. A body surface area of 1.73 m2 is the normal mean
value for young adults. Adjustment for body sur-face area is necessary when comparing a patient’s estimated GFR to normal values or to the levels defining the stages of CKD.
6) How does age affect GFR?
GFR declines gradually with age, even in people without kidney disease. However, there appears to be substantial variation among individuals and the reasons for decline are not known. Although the age-related decline in GFR was formerly considered part of normal aging, decreased GFR in the elderly is an independent predictor of adverse outcomes, such as death and cardiovas-cular disease. In addition, decreased GFR in the elderly requires adjustment in drug dosages, as with other patients with CKD.
Table 2 shows the average values of estimated GFR by decade in the general population, based on a small study of men.
7) What is the difference between creatinine
clearance and GFR?
Creatinine clearance exceeds GFR because creati-nine is secreted by the proximal tubule as well as filtered by the glomerulus. Creatinine clearance can be measured from serum creatinine and atinine excretion, or estimated from serum cre-atinine using estimating equations. Measurement
of creatinine clearance requires collection of a timed urine sample, which is inconvenient and frequently inaccurate. Repeated measurements of creatinine clearance may overcome some of the errors.
8) What is the currently recommended method
to estimate GFR?
The National Kidney Disease Education Program (NKDEP) of the National Institute of Diabetes and Digestive and Kidney Diseases (NIDDK), National Kidney Foundation (NKF), and American Society of Nephrology (ASN) recommend estimating GFR from serum creatinine. Two commonly used equations are the Modification of Diet in Renal Disease (MDRD) Study equation and Cockcroft-Gault equation.3, 4 Both equations use serum
cre-atinine in combination with age, sex, weight, or race to estimate GFR and therefore improve upon several of the limitations with the use of serum creatinine alone. The Chronic Kidney Disease Epidemiology Collaboration (CKD-EPI) equation is a new equation based on serum creatinine.5
9) What is the Cockcroft-Gault formula?
The Cockcroft-Gault formula was developed in 1973 using data from 249 men with creatinine clearance (CCr) from approximately 30 to130 mL/m2. It is not adjusted for body
surface area.
CCr={((140-age) x weight)/(72 SCr)} x 0.85 if female where CCr is expressed in milliliters per minute, age in years, weight in kilograms, and serum creatinine (SCr) in milligrams per deciliter (see
Question 43).
10) What is the MDRD Study equation?
The 4-variable MDRD Study equation was de-veloped in 1999 using data from 1628 patients with CKD with GFR from approximately 5 to 90 milliliters per minute per 1.73 m2. It estimatesGFR adjusted for body surface area4 and is more
accurate than measured creatinine clearance from 24-hour urine collections or estimated by the
TABLE 2: AVERAGE MEASURED GFR BY AGE IN PEOPLE WITHOUT CKD2
AGE (Years)
AVERAGE MEASURED GFR (mL/min/1.73 m2) 20-29
30-39 40-49 50-59 60-69 70+
116 107 99 93 85 75
6 NATIONAL KIDNEY FOUNDATION
Cockcroft-Gault formula.3 The equation is:
GFR = 186 x (SCr)-1.154 x (age)-0.203 x (0.742
if female) x (1.210 if African American) The equation was re-expressed in 2005 for use with a standardized serum creatinine assay, which yields 5% lower values for serum creati-nine concentration:4, 6
GFR = 175 x (Standardized SCr)-1.154 x (age)-0.203
x (0.742 if female) x (1.210 if African American) GFR is expressed in mL/min/1.73 m2, S
Cr is
serum creatinine expressed in mg/dL, and age is expressed in years.
11) What is the CKD-EPI equation?
The CKD-EPI equation was developed in 2009 to estimate GFR from serum creatinine, age, sex, and race.5 The CKD-EPI equation is as accurate as
the MDRD Study equation in the subgroup with estimated GFR less than 60 mL/min/1.73 m2 and
substantially more accurate in the subgroup with estimated GFR greater than 60 mL/min/1.73 m2.
(Figure 1)
Table 3 shows the equation expressed as a separate equation by level of serum creatinine, sex, and race. The footnote at the bottom of the tables shows the equation expressed as a single equation.
12) Why are there different estimated
levels of GFR for African Americans, males
and females, and people of different ages?
• African American patients:The CKD-EPI and MDRD Study equations include a term for the African American race to account for the fact that African Americans have a higher GFR than Caucasians (and other races included in the CKD-EPI datasets and MDRD Study) at the same level of serum creatinine. This is due to higher average muscle mass and creatinine generation rate in African Americans. Clinical laboratories may not collect data on race and therefore may report GFR estimates using the equation for Caucasians. For African
Americans, multiply the GFR estimate for Caucasians by 1.16 for the CKD-EPI equation and 1.21 for the MDRD Study equation. • Male and female patients:
The CKD-EPI and MDRD Study equations include a term for female sex to account for the fact that men have a higher GFR than women at the same level of serum creatinine. This is due to higher average muscle mass and creatinine generation rate in men.
formance compared with the simpler models. Table 2
shows the CKD-EPI equation in a form that could be implemented in clinical laboratories.
Comparison of Performance
The Figure and Table 3 show the performance of
both equations in the validation data set. (Appendix Table 6,available at www.annals.org, shows performance in the development and internal validation data sets.) The
CKD-EPI equation yielded improved median difference (bias), IQR, P30, and root mean square error (P0.001 for all). The CKD-EPI equation was as accurate as the MDRD Study equation in the subgroup with estimated GFR less than 60 mL/min per 1.73 m2and substantially more ac-curate in the subgroup with estimated GFR greater than 60 mL/min per 1.73 m2. Results were consistent across studies and subgroups defined by age, sex, race, diabetes, trans-plant status, and body mass index (data not shown).
The ROC curves to detect GFR less than 90, 75, 60, 45, 30 and 15 mL/min per 1.73 m2did not differ between the CKD-EPI and MDRD Study equations. The areas un-der the ROC curves were 0.95, 0.96, 0.96, 0.97, 0.97, and 0.98, respectively, for both equations. For detection of measured GFR less than 60 mL/min per 1.73 m2, the estimated GFR value with highest combination of sensitiv-ity and specificsensitiv-ity was 59 mL/min per 1.73 m2 for the CKD-EPI equation and 55 mL/min per 1.73 m2for the MDRD Study equation. The sensitivity and specificity of estimated GFR less than 60 mL/min per 1.73 m2 were 91% and 87% according to the CKD-EPI equation and 95% and 82% according to the MDRD Study equation (P0.001 for both comparisons). Concordance of esti-mated and measured GFR stages was 69% for the CKD-EPI equation and 64% for the MDRD Study equation (P 0.001).Table 4 shows classification of GFR stages estimated by the CKD-EPI and MDRD Study equations, with significant (P0.001) reclassification to higher val-ues by the CKD-EPI equation at valval-ues of 30 to 59 mL/min per 1.73 m2and higher. Among those classified differently by the 2 equations, classification by the CKD-EPI equation was correct more often than classification by the MDRD Study equation (63% vs. 34%; P 0.001). Overall, our results indicate better classification by esti-mated GFR with the CKD-EPI equation, primarily be-cause of reduction in bias.
Comparison of Estimated GFR and Prevalence of Chronic Kidney Disease in NHANES
The transformations and coefficients for variables in the CKD-EPI equation translate into differences in the estimated GFR distribution and prevalence of chronic kid-ney disease among NHANES participants from 1999 to 2006 compared with the MDRD Study equation. Both equations show a similar distribution at estimated GFR less than 45 mL/min per 1.73 m2, but the CKD-EPI equation leads to a shift to the right at higher levels of estimated GFR (Appendix Figure 2, top, available at www.annals .org). Mean estimated GFR (SE) was 93.20.39 using the CKD-EPI equation versus 86.30.40 mL/min per 1.73 m2using the MDRD Study equation (median, 94.5 mL/min per 1.73 m2[IQR, 79.7 to 108.1 mL/min per 1.73 m2] versus 85.0 mL/min per 1.73 m2[IQR, 72.9 to 98.5 mL/min per 1.73 m2]). Comparison of classification of stages of estimated GFR showed reclassification to higher values with the CKD-EPI equation at values of 30
Figure.Performance of the CKD-EPI and MDRD Study
equations in estimating measured GFR in the external validation data set.
Both panels show the difference between measured and estimated versus estimated GFR. A smoothed regression line is shown with the 95% CI (computed by using the lowest smoothing function in R), using quantile regression, excluding the lowest and highest 2.5% of estimated GFR. To convert GFR from mL/min per 1.73 m2to mL/s per m2, multiply by 0.0167. CKI-EPDChronic Kidney Disease Epidemiology Collabora-tion; GFRglomerular filtration rate; MDRDModification of Diet in Renal Disease.
Article
Development and Comparison of a New Equation to Estimate GFR6085 May 2009 Annals of Internal Medicine Volume 150 • Number 9 www.annals.org
formance compared with the simpler models. Table 2
shows the CKD-EPI equation in a form that could be implemented in clinical laboratories.
Comparison of Performance
The Figure and Table 3 show the performance of
both equations in the validation data set. (Appendix Table 6,available at www.annals.org, shows performance in the development and internal validation data sets.) The
CKD-EPI equation yielded improved median difference (bias), IQR, P30, and root mean square error (P0.001 for all). The CKD-EPI equation was as accurate as the MDRD Study equation in the subgroup with estimated GFR less than 60 mL/min per 1.73 m2and substantially more ac-curate in the subgroup with estimated GFR greater than 60 mL/min per 1.73 m2. Results were consistent across studies and subgroups defined by age, sex, race, diabetes, trans-plant status, and body mass index (data not shown).
The ROC curves to detect GFR less than 90, 75, 60, 45, 30 and 15 mL/min per 1.73 m2did not differ between the CKD-EPI and MDRD Study equations. The areas un-der the ROC curves were 0.95, 0.96, 0.96, 0.97, 0.97, and 0.98, respectively, for both equations. For detection of measured GFR less than 60 mL/min per 1.73 m2, the estimated GFR value with highest combination of sensitiv-ity and specificsensitiv-ity was 59 mL/min per 1.73 m2 for the CKD-EPI equation and 55 mL/min per 1.73 m2for the MDRD Study equation. The sensitivity and specificity of estimated GFR less than 60 mL/min per 1.73 m2 were 91% and 87% according to the CKD-EPI equation and 95% and 82% according to the MDRD Study equation (P 0.001 for both comparisons). Concordance of esti-mated and measured GFR stages was 69% for the CKD-EPI equation and 64% for the MDRD Study equation (P 0.001). Table 4 shows classification of GFR stages estimated by the CKD-EPI and MDRD Study equations, with significant (P0.001) reclassification to higher val-ues by the CKD-EPI equation at valval-ues of 30 to 59 mL/min per 1.73 m2and higher. Among those classified differently by the 2 equations, classification by the CKD-EPI equation was correct more often than classification by the MDRD Study equation (63% vs. 34%; P 0.001). Overall, our results indicate better classification by esti-mated GFR with the CKD-EPI equation, primarily be-cause of reduction in bias.
Comparison of Estimated GFR and Prevalence of Chronic Kidney Disease in NHANES
The transformations and coefficients for variables in the CKD-EPI equation translate into differences in the estimated GFR distribution and prevalence of chronic kid-ney disease among NHANES participants from 1999 to 2006 compared with the MDRD Study equation. Both equations show a similar distribution at estimated GFR less than 45 mL/min per 1.73 m2, but the CKD-EPI equation leads to a shift to the right at higher levels of estimated GFR (Appendix Figure 2, top, available at www.annals .org). Mean estimated GFR (SE) was 93.20.39 using the CKD-EPI equation versus 86.30.40 mL/min per 1.73 m2using the MDRD Study equation (median, 94.5 mL/min per 1.73 m2 [IQR, 79.7 to 108.1 mL/min per 1.73 m2] versus 85.0 mL/min per 1.73 m2[IQR, 72.9 to 98.5 mL/min per 1.73 m2]). Comparison of classification of stages of estimated GFR showed reclassification to higher values with the CKD-EPI equation at values of 30
Figure.Performance of the CKD-EPI and MDRD Study
equations in estimating measured GFR in the external validation data set.
Both panels show the difference between measured and estimated versus estimated GFR. A smoothed regression line is shown with the 95% CI (computed by using the lowest smoothing function in R), using quantile regression, excluding the lowest and highest 2.5% of estimated GFR. To convert GFR from mL/min per 1.73 m2to mL/s per m2, multiply by 0.0167. CKI-EPDChronic Kidney Disease Epidemiology Collabora-tion; GFRglomerular filtration rate; MDRDModification of Diet in Renal Disease.
Article
Development and Comparison of a New Equation to Estimate GFR6085 May 2009 Annals of Internal Medicine Volume 150 • Number 9 www.annals.org
FIGURE 1: COMPARISON OF PERFORMANCE OF MODIFICATION OF DIET IN RENAL DISEASE (MDRD) STUDY AND CHRONIC KIDNEY DISEASE
EPIDEMIOLOGY COLLABORATION (CKD-EPI) EQUATIONS BY ESTIMATED GFR IN THE
EXTERNAL VALIDATION DATASET
*
Both panels show the difference between measured and estimated versus estimated GFR. A smoothed regression line is shown with the 95% CI (computed by using the lowest smoothing function in R), using quantile regression, excluding the lowest and highest 2.5% of estimated GFR. To convert GFR from mL/min per 1.73 m2 to mL/s per m2, multiply by 0.0167.
*Reprinted with permission from Levey AS, Stevens LA, et al. A new equation to estimate glomerular filtration rate. Ann Intern Med. 2009:150.
7 FREQUENTLY ASKED QUESTIONS ABOUT GFR ESTIMATES • Age:
The CKD-EPI and MDRD Study equations in-clude a term for age to account for the fact that younger people have a higher GFR than older people at the same level of serum creatinine. This is due to higher average muscle mass and creatinine generation rate in younger people.
13) Are there terms for races or ethnic groups
other than African Americans?
Modifications of the CKD-EPI and MDRD Study equations have been developed for Japanese and Chinese people.7, 8, 9,10 They have not yet been
validated for Japanese or Chinese people living in other countries, including the United States. Studies in other ethnic groups have not yet been performed.
14) Are calculators available for the
CKD-EPI or MDRD Study equations?
The CKD-EPI and the MDRD Study equations have been programmed into medical decision support software for PDAs and are available on internet Web sites, such as www.kidney.org/gfr. Most clinical laboratories are now reporting GFR estimates using the MDRD Study equation. The National Kidney Disease Education Program, American Society of Nephrology, and National Kidney Foundation have all recommended that
laboratories automatically report estimated GFR whenever a serum creatinine is ordered. The NKF recently recommended that clinical laboratories should begin using the CKD-EPI equation to report estimated GFR.11
15) Why do some laboratories only report
numerical values when estimated GFR is
<60
mL/min/1.73 m
2?
The MDRD Study equation is less accurate at GFR estimates >60 mL/min/1.73 m2. At levels of
esti-mated GFR <60 mL/min/1.73 m2, the equation
is accurate for most persons of average body size and muscle mass, and therefore these estimates can be used to guide clinical decision making (see Questions 28, 30-31, 36-37). Values for the CKD-EPI equation can be reported throughout the range of GFR.
16) What are the problems associated with
using estimating equations?
Estimating equations are limited by:
(1) use of serum creatinine as a filtration marker; (2) decreased accuracy at higher levels of
estimated GFR; and
(3) non-steady state conditions for the filtration marker when GFR is changing.
TABLE 3: CKD-EPI EQUATION FOR ESTIMATING GFR ON THE NATURAL SCALE EXPRESSED FOR SPECIFIED RACE, SEX, AND STANDARDIZED SERUM5
RACE SEX SERUM CREATININE (mg/dL) EQUATION
Black Female #0.7 GFR = 166 x (SCr/0.7)-0.329 x (0.993)Age
Black Female 0.7 GFR = 166 x (SCr/0.7)-1.209 x (0.993)Age
Black Male #0.9 GFR = 163 x (SCr/0.9)-0.411 x (0.993)Age
Black Male 0.9 GFR = 163 x (SCr/0.9)-1.209 x (0.993)Age
White or other Female #0.7 GFR = 144 x (SCr/0.7)-0.329 x (0.993)Age
White or other Female 0.7 GFR = 144 x (SCr/0.7)-1.209 x (0.993)Age
White or other Male #0.9 GFR = 141 x (SCr/0.9)-0.411 x (0.993)Age
White or other Male 0.9 GFR = 141 x (SCr/0.9)-1.209 x (0.993)Age
CKD-EPI equation expressed as a single equation: GFR = 141 x min(SCr/k, 1)a x max(SCr/k, 1)-1.209 x 0.993Age x 1.018 [if female] x 1.159 [if black] where SCr is standardized serum creatinine in mg/dL, k is 0.7 for females and 0.9 for males, a is -0.329 for females and -0.411 for males, min indicates the minimum of SCr/k or 1, and max indicates the maximum of SCr/k or 1.
*Reprinted with permission from the American Society of Nephrology via the Copyright Clearance Center. Stevens LA, Levey AS. J Am Soc Nephrol. 2009; 20:2305-2313.
8 NATIONAL KIDNEY FOUNDATION
18) What are the problems associated with the
use of serum creatinine as a filtration marker?
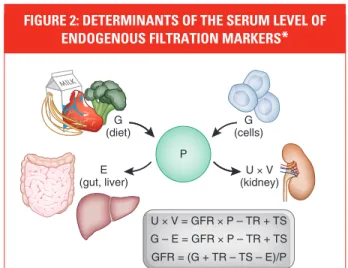
Creatinine is a 113 dalton amino acid derivative that is generated from the breakdown of creatine in muscle, distributed throughout total body water, and excreted by the kidneys primarily by glomerular filtration. Although the serum level is affected primarily by the level of GFR, it is also affected by other physiological processes, such as tubular secretion, generation, and extrarenal ex-cretion of creatinine (Figure 2).1 Due to variationin these processes amongst individuals and over time within individuals, particularly the variation in creatinine generation, the cutoff for normal versus abnormal serum creatinine concentration differs among groups. Because of the wide range of normal for serum creatinine in most clinical labo-ratories, GFR must decline to approximately half the normal level before the serum creatinine con-centration rises above the upper limit of normal.
17) Can serum creatinine alone be used to estimate kidney function?
No. Serum creatinine alone is not the best way to detect kidney disease, especially in the early stages. This is because a rise in blood creatinine levels is observed only after significant loss of functioning nephrons.
TABLE 4: THE SAME SERUM CREATININE: VERY DIFFERENT eGFR
22-YR-OLD
BLACK MAN WHITE MAN58-YR-OLD WHITE WOMAN80-YR-OLD
Serum creatinine 1.2 mg/dL 1.2 mg/dL 1.2 mg/dL
GFR as estimated by
the MDRD equation 98 mL/min/1.73 m2 66 mL/min/1.73 m2 46 mL/min/1.73 m2
Kidney function kidney damage is also presentNormal GFR or stage 1 CKD if damage is also presentStage 2 CKD if kidney Stage 3 CKD
those patients in whom a measured GFR
should be considered.
NON-GFR DETERMINANTS OF SERUM LEVELS OF
ENDOGENOUS FILTRATION MARKERS
Generation, renal excretion (filtration,
secretion, and reabsorption), and
ex-trarenal elimination determine serum
levels of endogenous filtration markers
(Figure 1). Estimating equations use
easily measured clinical variables as
surrogates for these unmeasured
phys-iologic processes and provide more
ac-curate estimates than the serum level
alone.
6However, by design, equations
capture only the average relationship
of the surrogates to some of these
phys-iologic processes, leading to error in
some individuals.
Creatinine-based estimating
equa-tions include age, gender, race, or weight
as surrogates for differences in creatinine
generation from muscle mass (Table
2).
2,7People who are at the extremes of
muscle mass and diet, who are
malnour-ished or have a reduction in muscle mass
from illness or amputation, who are of
different races or ethnicities than
in-cluded in studies used for development
of the equations, or who have changes in
the non-GFR determinants over time are
most likely to have large differences
be-tween mGFR and eGFR.
6,8 –10One of the challenges with the
intro-duction of a novel filtration marker into
clinical practice is that the non-GFR
de-terminants may not be well understood,
potentially limiting their interpretation
in clinical practice. For example, it is now
well recognized that there are many
fac-tors associated with the serum level of
cystatin C other than GFR, but the
mech-anisms for these associations are not well
understood.
11NON–STEADY STATE
Serum levels of endogenous filtration
markers, and eGFR derived from these
markers, are expected to be an accurate
index of mGFR only in the steady state.
Figure 2 shows the hypothetical change
in levels of a filtration marker and
esti-mated GFR based on that marker after an
acute change in GFR.
12In the non–
steady state, the rate and direction of
change in the level of the filtration
marker and in eGFR reflect the
magni-tude and direction of the change in GFR
but do not accurately reflect the level of
GFR. As shown in Figure 2, after a fall in
GFR, the decline in eGFR is less than the
decline in GFR, and eGFR thus exceeds
GFR. Conversely, after a rise in GFR, the
rise in eGFR is less than the rise in GFR,
and eGFR is thus less than GFR. As the
serum level approaches the new steady
state, eGFR approaches GFR, and the
level of the filtration marker varies
in-versely with GFR. The rate of rise in the
marker reflects not only the severity of
the reduction in GFR but also the
non-GFR determinants.
CLINICAL SCENARIOS WHEN ACCURATE ASSESSMENTS MAY BE NECESSARY
In most circumstances, eGFR is sufficient
for clinical decision making (Table 1).
However, for patients in whom GFR
esti-mates based on serum creatinine are likely
to be inaccurate or in clinical
circum-stances in which decisions based on
inac-curate estimates may have adverse
conse-quences, mGFR may be helpful. Below, we
describe clinical situations in general
med-icine and nephrology where measurement
of GFR should be considered (Table 3).
MILK
U × V = GFR × P – TR + TS G – E = GFR × P – TR + TS GFR = (G + TR – TS – E)/P G
(diet)
U × V (kidney) G (cells) E (gut, liver) P
Figure 1. Determinants of the serum level of endogenous filtration markers. The plasma
level (P) of an endogenous filtration marker is determined by its generation (G) from cells and diet, extrarenal elimination (E) by gut and liver, and urinary excretion (UV) by the kidney. Urinary excretion is the sum of filtered load (GFRP), tubular secretion (TS), and reabsorption (TR). In the steady state, urinary excretion equals generation and extrarenal elimination. By substitution and rearrangement, GFR can be expressed as the ratio of the non-GFR determinants (G, TS, TR, and E) to the plasma level.
Table 1. Clinical conditions where assessment of GFR is important
Clinical
Decisions Current Level of GFR Change in Level of GFR
Diagnosis Detection of CKD Detection of AKI
Evaluation for kidney donation Detection of CKD progression Prognosis Risk of CKD complications Risk for kidney failure
Risk for CVD Risk for mortality
Treatment Dose and monitoring for medications cleared by the kidney
Treatment of AKI Determine safety of diagnostic tests
or procedures
Monitoring drug toxicity Referral to nephrologists
Referral for kidney transplantation Placement of dialysis access
BRIEF REVIEW www.jasn.org
2306 Journal of the American Society of Nephrology J Am Soc Nephrol20:2305–2313, 2009
FIGURE 2: DETERMINANTS OF THE SERUM LEVEL OF ENDOGENOUS FILTRATION MARKERS
*
The plasma level (P) of an endogenous filtration marker is deter-mined by its generation (G) from cells and diet, extrarenal elimination (E) by gut and liver, and urinary excretion (UV) by the kidney. Urinary excretion is the sum of filtered load (GFR x P), tubular secretion (TS), and reabsorption (TR). In the steady state, urinary excretion equals generation and extrarenal elimination. By substitution and rearrange-ment, GFR can be expressed as the ratio of the non-GFR determi-nants (G, TS, TR, and E) to the plasma level.
*Reprinted with permission from the American Society of Nephrology via the Copyright Clearance Center. Stevens LA, Levey AS. J Am Soc Nephrol. 2009;20:2305-2313.
9 FREQUENTLY ASKED QUESTIONS ABOUT GFR ESTIMATES
19) What factors affect creatinine generation?
The main factors affecting creatinine genera-tion are muscle mass and diet. Table 5 shows the effect on serum creatinine of factors affecting creatinine generation.20) What factors affect creatinine secretion?
Some medications inhibit tubular secretion of creatinine, thereby decreasing creatinine clear-ance and increasing serum creatinine without a change in GFR. These medications include: • cephalosporin and aminoglycoside antibiotics • flucytosine• cisplatin • cimetidine • trimethoprim
21) What is the impact of calibration and
inter-laboratory variation of serum creatinine assays
on the estimation of GFR?
The most commonly used assay for serum creati-nine, the alkaline picrate (“Jaffe”) assay, detects
a color change when creatinine interacts with picrate under alkaline conditions and is subject to interference from substances other than cre-atinine (“non-crecre-atinine chromogens”), such as proteins and ketoacids. Newer enzymatic meth-ods improve upon some of the non-specificities of the alkaline picrate assay, but some are subject to other interferences. Calibration of creatinine assays to adjust for this interference has been standardized across methods and laboratories as of 2010 and should lead to less variation among clinical laboratories in GFR estimates using the same equation.
22) What factors affect the creatinine assays?
Proteins in the serum, as well as glucose and ketoacids in high levels (as occurring in diabetic ketoacidosis), interfere with the alkaline picrate assay, giving rise to false elevations in serum. There is thought to be less interference with enzymatic methods, but there are reports of interference by bilirubin and monoclonal IgG.13TABLE 5: FACTORS AFFECTING SERUM CREATININE CONCENTRATION12 EFFECT ON SERUM CREATININE MECHANISM/COMMENT
Older Age Decrease Reduction in creatinine generation due to age-related decline in muscle mass
Female Sex Decrease Reduced creatinine generation due to reduced muscle mass
Race
African American Increase Higher creatinine generation rate due to higher average muscle mass in African Americans compared to Caucasians; not known how muscle mass in other races compares to that of African American or Caucasians
Diet
Restriction of Dietary Protein Decrease Decrease in creatinine generation
Ingestion of Cooked Meats Increase Transient increase in creatinine generation; however, this may be blunted by transient increase in GFR
Body Habitus
Muscular Increase Increased creatinine generation due to increased muscle mass ± increased protein intake
Malnutrition/muscle wasting/amputation
Decrease Reduced creatinine generation due to reduced muscle mass ± reduced protein intake
Obesity No Change Excess mass is fat, not muscle mass, and does not contribute to increased creatinine generation
10 NATIONAL KIDNEY FOUNDATION
23) What was the effect of standardization of
the creatinine assay on GFR estimates?
The National Kidney Disease Education Program led the process of standardization of the cre-atinine assays in clinical laboratories. This was completed in 2010. After standardization, most clinical laboratories’ serum creatinine results declined by 0.1-0.3 mg/dL. The CKD-EPI equa-tion was developed for use only with standard-ized values. The MDRD Study equation has been re-expressed for standardized serum creatinine.4Use of the re-expressed MDRD Study equation with standardized serum creatinine improves the accuracy of GFR estimates using that equa-tion. The Cockcroft-Gault equation has not been re-expressed for use with standardized serum cre-atinine. GFR estimates using the Cockcroft-Gault equation with standardized serum creatinine will generally be higher and less accurate than with non-standardized creatinine.14
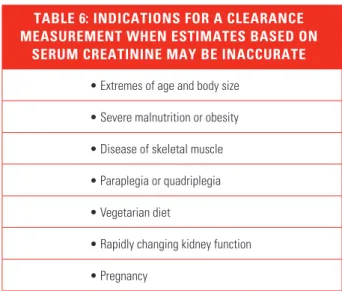
24) Are there any times when a 24-hour urine
collection for creatinine clearance should be
performed?
Measurement of creatinine clearance should be considered in circumstances when the estimating equation based on serum creatinine is suspected to be inaccurate or when highly accurate values are needed, and a measured GFR using exogenous markers is not available.1 Such circumstances
may occur in people who are undergoing evalu-ation for kidney donevalu-ation, treatment with drugs with significant toxicity that are excreted by the kidneys (for example, high-dose methotrexate), or consideration for participation in research protocols (Table 6).
25) What is cystatin C?
Cystatin C is a 13 kD, non-glycosylated, basic protein that is produced by all nucleated cells. It is freely filtered by the glomerulus and then reab-sorbed and catabolized by the tubular epithelial cells, with only small amounts excreted in the urine. Its urinary clearance cannot be measured, which makes it difficult to study factors
affect-ing its clearance and generation. The generation of cystatin C appears to be less variable and less affected by age and sex than serum creatinine; however, some studies have reported increased cystatin C levels associated with higher levels of C-reactive protein or body mass index (BMI), hyperthyroidism, and steroid use. In addition, other studies suggest extrarenal elimination at high levels of cystatin C and higher intra- individual variation compared to serum creati-nine, particularly among transplant patients.15
26) Is cystatin C a more accurate filtration
marker than creatinine?
Some studies show that serum levels of cystatin C estimate GFR better than serum creatinine alone.15 Recent studies have clearly demonstrated
that cystatin C is a better predictor of adverse events in the elderly, including mortality, heart failure, bone loss, peripheral arterial disease, and cognitive impairment, than either serum creati-nine or estimated GFR.16, 17 These findings may
be because cystatin C is a better filtration marker than creatinine, particularly in the elderly. An alternative explanation is that factors other than GFR that affect serum levels of creatinine and cystatin C differentially confound the relationships between these measures and outcomes.15, 18, 19
TABLE 6: INDICATIONS FOR A CLEARANCE MEASUREMENT WHEN ESTIMATES BASED ON
SERUM CREATININE MAY BE INACCURATE
• Extremes of age and body size • Severe malnutrition or obesity • Disease of skeletal muscle • Paraplegia or quadriplegia • Vegetarian diet
• Rapidly changing kidney function • Pregnancy
11 FREQUENTLY ASKED QUESTIONS ABOUT GFR ESTIMATES
27) Can cystatin C be used to estimate GFR?
Some studies have reported estimating equations based on serum levels of cystatin C, either alone or in combination with serum creatinine.20 Theseequations have variable performance compared to serum creatinine and variable performance among populations. These equations need to be validated in other studies prior to use in clinical practice. In addition, calibration of assays of serum cystatin C will require standardization for routine use of estimating equations using cystatin C.
28) Why are GFR estimates at higher levels of
estimated GFR less accurate?
There are several possible explanations for reports of decreased accuracy of higher GFR estimates, including:
(1) inter-laboratory variation in the calibration of filtration marker assays, which has a larger effect at higher GFR levels. This is likely an important reason for the wide variation among published studies, and should diminish with standardization of assays.
(2) greater biologic and measurement variability of GFR at higher values
(3) limitations of generalizing an equation devel-oped in one population to another population21
All three explanations are also likely to affect estimating equations based on cystatin C as well as creatinine.
29) What problems are caused by the
non-steady state of filtration markers after a
change in GFR?
Accurate estimation of GFR from the serum level of an endogenous filtration marker (creatinine or cystatin C) requires a steady state; that is, the serum level is stable from day to day. This is true whether the serum level alone is used to estimate GFR or the serum level is used in an estimation equation. After a decline in GFR, the serum level
rises until a new steady state is achieved (Figure 3). When the serum level is rising, the GFR estimate based on the non-steady state serum level over-estimates the measured GFR. Conversely, after a rise in GFR, the serum level declines until a new steady state is achieved. When the serum level is declining, the GFR estimate based on the non-steady state serum level underestimates the mea-sured GFR. In the non-steady state, the direction of change in the serum level indicates the direction of change in GFR, and the rate of change in the serum level provides some indication of the magnitude of the change in GFR.
FIGURE 3: EFFECT OF AN ACUTE GFR DECLINE ON GENERATION, FILTRATION, EXCRETION,
BALANCE, AND SERUM LEVEL OF ENDOGENOUS FILTRATION MARKERS
*
ulus, neither reabsorbed, secreted, syn-thesized, or metabolized by the tubules, and does not alter the function of the kidney. Inulin, a 5200-D, inert, un-charged polymer of fructose, is the only known ideal filtration marker. The clas-sic clearance method of Homer Smith in-cludes fasting conditions in the morning, a continuous intravenous infusion, mul-tiple clearance periods requiring repeti-tive blood and urine collections over 3 h,
oral water loading to stimulate diuresis, bladder catheterization to assure com-plete urine collection, and careful timing of blood sampling at the midpoint of the urine collection.14However, inulin is dif-ficult to handle, and the procedures are invasive. Because of these disadvantages, we use alterative clearance methods and filtration markers. Table 4 summarizes the strengths and limitations of the gold standard method, as well as other the clearance methods and markers.
All other filtration markers deviate from ideal behavior, and clearance mea-surements are difficult to perform; thus, values for mGFR usually contain an ele-ment of error, which differentiates it from true physiologic GFR. Bias gener-ally reflects systematic differences in re-nal handling, extrarere-nal metabolism, or assay of the filtration marker. This bias is assessed experimentally by comparison
to an ideal filtration marker relevant for assessing level of GFR in ranges impor-tant for clinical decision making. Impre-cision generally reflects random error in performance of the clearance procedure or assay of the filtration marker. Mea-surements performed under standard conditions will minimize biologic varia-tion and will reduce the likelihood of random errors. Precision is assessed by repeated measurement over a short time. Imprecision in mGFR is relevant for as-sessment of change in GFR over time. In an individual patient, bias and impreci-sion both affect the measured level and must be considered in the interpretation of mGFR. To evaluate the extent of the available literature and to provide data for this discussion, we performed a sys-temic review of all studies that compared simultaneous measurements of iohexol, iothalamate, and inulin or repeated mea-surements of these markers using the same protocol (Table 5).16 – 43The gray shaded boxes in Table 5 show the studies that report repeated measurements us-ing the same protocol. Other markers and their comparison to inulin are also discussed below.
CLEARANCE METHODS
Urinary Clearance
Urinary clearance is the most direct method for measurement of GFR. Clear-ance is computed as the urine concentra-tion of the exogenous or endogenous fil-tration marker, multiplied by the volume of the timed urine sample, and divided by the average plasma concentration during the same time period.
Measurement of the clearance of an endogenous filtration marker, such as creatinine, is performed in virtually ev-ery clinical center. A long urinary collec-tion period— 6 to 24 h—is used to avoid the requirement for water loading, and in the steady state, a single blood sample obtained either at the beginning or end of the collection period may be assumed to represent the average serum concen-tration during the urine collection. Timed collections are subject to errors caused by inaccurate record of time and 120 90 60 GFR 1.5 2.0
0 1 2 3 4
Day
Plasma marker concentration
Day Pmarker eGFR
0 1.0 120
1.6 79 1.8 69 1.9 65 2.0 60 1.5 2.0 2.5 3.0 Acute GFR Decline
120 90 60 Marker generation Marker filtration and excretion Cumulative marker balance 1.0 1.5 2.0 1.0
Figure 2. Effect of an acute GFR decline on generation, filtration, excretion, balance, and serum level of endogenous filtration markers. After an acute GFR decline, generation of the marker is unchanged, but filtration and excretion are reduced, resulting in retention of the marker (a rising positive balance) and a rising plasma level (non–steady state). During this time, eGFR is lower than GFR. Although GFR remains reduced, the rise in plasma level leads to an increase in filtered load (the product of GFR times the plasma level) until filtration equals generation. At that time, cumulative balance and the plasma level plateau at a new steady state. In the new steady state, eGFR approximates mGFR. GFR is expressed in units of milliliter per minute per 1.73 m2. Tubular secretion and reabsorption and extrarenal elimination are assumed to be zero. Modified and repro-duced with permission from Kassirer JP,N Engl J Med285: 385–389, 1971.
Table 3. Indications for measured GFR
Extremes of age and body size Severe malnutrition or obesity Disease of skeletal muscle Paraplegia or quadriplegia Evaluation for kidney donation Vegetarian diet
Before administration of prolonged courses of toxic medications
BRIEF REVIEW www.jasn.org
Effect of an acute GFR decline on generation, filtration, excretion, balance, and serum level of endogenous filtration markers. After an acute GFR decline, generation of the marker is unchanged, but filtration and excretion are reduced, resulting in retention of the marker (a rising positive balance) and a rising plasma level (non–steady state). During this time, eGFR is lower than GFR. Although GFR remains reduced, the rise in plasma level leads to an increase in filtered load (the product of GFR times the plasma level) until filtration equals generation. At that time, cumulative balance and the plasma level plateau at a new steady state. In the new steady state, eGFR approximates mGFR. GFR is expressed in units of milliliter per minute per 1.73 m2. Tubular secretion and reabsorption and extrarenal elimination are assumed to be zero. *Modified and reproduced with permission from Kassirer JP. N Engl J Med. 1971;285:385–389.
12 NATIONAL KIDNEY FOUNDATION
30) To which populations does the MDRD
Study equation apply?
The MDRD Study equation was developed in a group of patients with chronic kidney disease
(mean GFR 40 mL/min/1.73 m2) who were
pre-dominantly Caucasian, non-diabetic, and did not have a kidney transplant.4 Since then, the MDRD
Study equation has been evaluated in numerous populations, including:
• African Americans, Europeans, and Asians • patients with and without diabetes or kidney
disease
• kidney transplant recipients • potential kidney donors
These studies have shown that the MDRD Study equation has reasonable accuracy in non-hospi-talized patients thought to have CKD, regardless of diagnosis.20, 22, 23
31) To which populations or individuals does
the MDRD Study equation not apply?
The MDRD Study equation has been reported to be less accurate in populations without kidney disease, such as young patients with type 1 diabe-tes without microalbuminuria or people selected for evaluation for kidney donation.22
The MDRD Study equation has not been validated in children (age <18 years), pregnant women, the elderly (age >85 years), or in some racial or ethnic subgroups, such as Hispanics. Furthermore, any of the limitations with the use of serum creatinine related to nutritional status or medication usage are not accounted for in the MDRD Study equation (Table 5) (see Questions 18-19).
32) To which populations does the CKD-EPI
equation apply?
The CKD-EPI equation was developed in a cohort of 8254 people, predominantly Whites and Blacks with diverse characteristics, including
people with and without kidney diseases, diabe-tes, and solid organ transplants who had a wide range of GFR (2 to 198 mL/min/1.73 m2) and
ages (18-97 years).5 The equation was validated in
a separate cohort of 3896 people from 16 separate studies, GFR range (2 to 200 mL/min/1.73 m2)
and age range (18-93 years) (Figure 1). The CKD-EPI equation is more accurate than the MDRD Study equation, particularly in people with higher levels of GFR, such as populations without kidney disease, young patients with type 1 diabe-tes without microalbuminuria, or people selected for evaluation for kidney donation. The CKD-EPI equation is as accurate as the MDRD Study equa-tion in people with lower levels of GFR and who have kidney disease.
33) To which populations does the CKD-EPI
equation not apply?
The CKD-EPI equation has not been validated in children (age <18 years), pregnant women, or in some racial or ethnic subgroups, such as Hispanics. Furthermore, the CKD-EPI equation, like all creatinine-based estimates, including the MDRD Study equation and Cockcroft-Gault equa-tion, cannot overcome the limitations of serum creatinine. Specifically, all equations will be less accurate in people with differences in nutritional status or muscle mass (Table 5) (see Questions 18-19).
34) How do the CKD-EPI, MDRD Study, and
Cockcroft-Gault equations differ?
The Cockcroft-Gault equation estimates creatinine clearance and is not adjusted for body surface area.3, 24 The CKD-EPI and MDRD Study equations
estimate GFR adjusted for body surface area. GFR estimates from the CKD-EPI and MDRD Study equations can therefore be applied to de-termine level of kidney function, regardless of a patient’s size. In contrast, estimates based on the Cockcroft-Gault equation can be used for drug dosage recommendations, whereas GFR estimates
INTERPRETATION OF GFR ESTIMATES
13 FREQUENTLY ASKED QUESTIONS ABOUT GFR ESTIMATES based on the MDRD Study should be
“unadjust-ed” for body surface area (see Questions 42-43). Many studies have compared the performance of the MDRD Study and Cockcroft-Gault equations in measuring GFR. In some of these studies, the MDRD Study equation was more accurate than the Cockcroft-Gault equation. Other studies dem-onstrated similar performance. The Cockcroft-Gault equation appears to be less accurate than the MDRD Study equation, specifically in older and obese people.22
A recent study of a large diverse population compared the performance of the two equations with the use of standardized serum creatinine values and showed that the performance of the Cockcroft-Gault was substantially worse with the standardized creatinine values, with the percentage of estimates within 30% of measured GFR falling from 74% before standardization to 69% after standardization. This suggests that the Cockcroft-Gault formula should not be used as clinical laboratories move to standard creatinine assays.14
35) If the Cockcroft-Gault equation is less
ac-curate, why is it still used?
Pharmacokinetic studies over the last several years have used this equation to determine level of kidney function for dosage adjustment in drug labels. As a result, it has become the standard for drug dosing. However, given the variability in creatinine assays at the time, there was incon-sistent translation from the pharmacokinetic studies into clinical practice, regardless of which equation was used. In addition, the difference in GFR estimates based on the MDRD Study and the Cockcroft-Gault equations will not lead to a difference in drug dosages for the majority of patients. Recent recommendations from the National Kidney Disease Education Program suggest that either equation can be used for drug dosing purposes.25, 26
36) How can GFR estimates be used to
detect CKD?
Persistent reduction in GFR to below 60 mL/ min/1.73 m2 is defined as CKD.27-29 A person with
higher GFR does not have CKD unless he or she also has a marker of kidney damage (Table 7). GFR estimates from the MDRD Study equation greater than 60 mL/min/1.73 m2 underestimate
measured GFR. As such, MDRD Study equation GFR estimates may lead to a “false positive” diag-nosis of CKD in people with mildly reduced GFR. In addition, MDRD Study equation GFR estimates may not be useful for quantification of declines in GFR to levels of 60 mL/min/1.73 m2 or more.
However, an MDRD Study equation estimated
GFR under 60 mL/min/1.73 m2 has been shown
to be associated with an increased risk of adverse outcomes of CKD in multiple populations.30
The CKD-EPI equation provides more accurate estimates than the MDRD Study equation in this range of GFR, and consequently it will more ac-curately identify patients with CKD with estimat-ed GFR (eGFR) around 60 ml/min per 1.73 m2. In
addition, it has been shown in several commu-nity-based cohorts, that people who were reclas-sified to a higher GFR stage using the CKD-EPI equation compared to the MDRD Study equation had lower risk for adverse events.31, 32
37) How should mildly reduced GFRs in
patients without kidney damage be interpreted?
There will be some uncertainty for patients without markers of kidney damage in whom GFR estimates are:
• Between 60-89 mL/min/1.73 m2 or
• Slightly below 60 mL/min/1.73 m2
In these cases, clinical decision making will depend on other patient characteristics, such as the presence or absence of risk factors for CKD or complications of CKD (Table 7). In some patients, clinicians may decide to defer further evaluation for CKD, but it may be prudent to:
14 NATIONAL KIDNEY FOUNDATION
• Check the person’s GFR more often.
• Counsel the person to avoid medications that can damage the kidneys (such as ibuprofen). • Adjust the dosage of medications that are
removed by the kidney.
• Consider co-consultation with a nephrologist regarding the patient’s lab and imaging studies. • Refer the patient to a nephrologist.
(See Questions 28, 31, and 36.)
38) What course of action should be taken
for a suspected false-positive test of eGFR
<60 mL/min/1.73 m
2?
If the patient does not have any risk factors for CKD, is otherwise well, and if the GFR is near 60 mL/min/1.73 m2, the next step is to check for
markers of kidney damage. This should include a urinalysis and measurement of albumin-to-creatinine ratio in a spot urine sample.
If these are negative, then it is reasonable not to pursue other investigations at that time. How-ever, it may be prudent to:
• Check the person’s eGFR more often. • Adjust the dosage of medications that are
removed by the kidney.
• Counsel the person to avoid medications that can damage the kidneys (such as ibuprofen).
If an accurate measurement is required, a clear-ance measurement can be performed. Referral to a nephrologist may also be indicated for decisions regarding diagnosis or further evaluation (see Question 53).
39) What clearance measurements should
be performed?
For patients in whom it is important to have an accurate level of GFR, clearance measurements should be performed.1 Clearance measurements
using exogenous filtration markers, such as iohexol or iothalamate, are most accurate but are not readily available. Creatinine clearances can be performed in those circumstances. Repeating the creatinine clearance may reduce measure-ment errors in collection.
40) How can GFR estimates be used to
detect progression?
Current guidelines recommend using GFR estimates to monitor progression of CKD.27- 29
Clinicians should not rely on monitoring serum creatinine to detect the level and rate of CKD progression.
For example, for a 50-year-old white male: • A change in serum creatinine from 1.0 to
2.0 mg/dl (88.4 to 176.8 µmol/L) reflects a
decline in GFR of 46 mL/min/1.73 m2
(from 84 to 38 mL/min/1.73 m2).
• Whereas a further increase in serum creatinine level from 2.0 to 3.0 mg/dL (176.8 to 265.2
µmol/L) reflects a further decline of only
14 mL/min/1.73 m2 (to 24 mL/min/1.73 m2).
41) Do some drugs affect the accuracy of GFR
estimates?
Drug-induced reduction in GFR raises the serum creatinine concentration and is detected by the CKD-EPI or MDRD Study equation; however, drugs that raise serum creatinine concentration without affecting GFR will give falsely low estimates of GFR. In most cases, GFR can be estimated after discontinuing the drug.
TABLE 7: DETECTION OF CKD USING ESTIMATED GFR AND MARKERS OF KIDNEY DAMAGE
Marker of Kidney Damage GFR CKD What to do?
+ <60 Y Action Plan
+ >60 Y Action Plan
- <60 Y* Action Plan*
- >60 N
* The differing accuracy of current estimating equations in people with and without CKD may make it difficult to interpret GFR estimates near 60 mL/min/1.73 m2 in patients without markers of
15 FREQUENTLY ASKED QUESTIONS ABOUT GFR ESTIMATES
42) How should estimates of GFR or creatinine
clearance be used when dosing medications?
In general, drug dosing is based on pharmacoki-netic studies where kidney function was assessed using creatinine clearance levels estimated from the Cockcroft-Gault equation. For the majority of patients, the difference in GFR estimates based on the MDRD Study and the Cockcroft-Gault equations will not lead to a difference in drug dosages. Recent recommendations from the National Kidney Disease Education Program suggest that either value can be used to assign drug dosages.25, 26
43) Should adjusted or unadjusted estimated
GFR be used when dosing medications?
Drug dosing is based on kidney function mea-surements or estimates that are not adjusted for body surface area. GFR estimates adjusted for body surface area will generally be adequate except in patients with body size that is very different than average.25 In these patients,
unadjusted estimated GFR can be computed by the following formulas:
BSA (m2) = (W0.425 x H0.725) x 0.007184
Where height is measured in centimeters, and weight in kilograms.
GFR estimate (mL/min) = GFR estimate (mL/min/1.73 m2) x BSA/1.73
44) Can the estimating equations for
GFR be used in acute kidney injury
(acute renal failure)?
GFR estimates are less accurate in the non-steady state; however, serum creatinine can provide important information about the level of kidney function even when it is not in a steady state. Estimated GFR overestimates measured GFR when serum creatinine is rising, and underesti-mates measured GFR when serum creatinine is falling. In general, if the serum creatinine rises at 2-3 mg/dl per day then the GFR is near zero.
45) Can GFR estimates be used in
hospitalized patients?
GFR estimates can be used in patients who are in the hospital; however, it is important to pay attention to potential inaccuracies due to the non-steady state of serum creatinine, comorbid conditions that cause malnutrition, and use of medications that interfere with the measurement of serum creatinine.
The National Kidney Foundation (NKF) currently recommends using the CKD-EPI equation for estimating GFR in adults.
A GFR calculator containing the CKD-EPI equa-tion, MDRD Study equaequa-tion, Cockcroft-Gault formula, and the revised “bedside” Schwartz equation for children has been programmed into medical decision-making software for Smartphones and websites.
To use the free GFR calculator on the NKF
web site: Go to www.kidney.org/gfr
To download NKF’s new GFR calculator to
your smartphone: Go to www.kidney.
org/apps or just snap this QR code with your Smartphone.
CALCULATE GFR WITH SMARTPHONES AND WEBSITES
Available for:
IPhone/IPod touch Android IPad
Delicious
Slash Dot
Newsvine
Yahoo
Microsoft
App Store
Qik
Tumblr
Behance
Friendster
Flickr
MySpace
Mixx
FriendFeed
SlideShare
Yahoo Buzz
MSN
Amazon
Vimeo
WordPerss
Design Float
Bebo
StumbleUpon
Skype
YouTube
Netvibes
Apple
Last.fm
Viddler
Blogger
Deviant Art
Squidoo
Retweet
Digg
Technorati
Google Talk
AOL
MobileMe
Mister Wong
Virb
Posterous
Design Bump
16 NATIONAL KIDNEY FOUNDATION
46) What is the public health problem
associated with chronic kidney disease?
CKD is a worldwide public health problem. Adverse outcomes of CKD include loss of kidney function, sometimes leading to kidney failure, and cardiovascular disease. Some of the adverse outcomes of chronic kidney disease can be pre-vented or delayed by early diagnosis and treat-ment. Unfortunately, CKD is under-diagnosed and under-treated. As a step toward improvement of this health care problem, the National Kidney Foundation’s Kidney Disease Quality Outcome Initiative (KDOQI) published guidelines for the classification and evaluation of CKD.27, 28
47) What is the definition of CKD?
CKD is defined as either the presence of kidney
damage or GFR less than 60 mL/min/1.73 m2
for three or more months and can be diagnosed without knowledge of its cause.
48) What are the stages of CKD?
Table 8 outlines the stages of CKD and the clinical actions that are recommended at each stage. The action plan is cumulative in that recommended care at more severe stages of disease includes care recommendations for the less severe stages of disease, as well as additional interventions that are required for more advanced disease
CHRONIC KIDNEY DISEASE
TABLE 9: INTERPRETATION OF ABNORMALITIES ON IMAGING STUDIES AS MARKERS OF KIDNEY DAMAGE
IMAGING MODALITY/FEATURE ASSOCIATED KIDNEY DISEASE
Ultrasonography General appearance Increased echogenicity Small, “hyperechoic” kidneys Large kidneys
Size disparities and scarring Doppler interrogation
May show nephrocalcinosis or discrete stones, hydronephrosis, cysts, or masses May indicate cystic disease or “medical renal disease”
Generally indicate chronic kidney disease
Generally indicate tumors, infiltrating diseases or diseases causing nephrotic syndrome Suggest vascular, urologic or tubulointerstitial diseases due to stones or infection May be useful in investigation of venous thrombosis, less so in arterial stenosis
Intravenous pyelography (IVP)a May reveal asymmetry of kidney size or function, presence of obstructing stones, tumors, scars, or dilated
collecting ducts in medullary sponge kidney
Computed tomography (CT)b May show obstruction, tumors (eg. angiomyolipoma), cysts or ureteral calculi. Helical CT with contrast
may show sites of anatomic renal artery stenosis. Magnetic resonance imaging (MRI) May show mass lesions, renal vein thrombosis, cysts, etc.
Nuclear scansc May reveal asymmetry of kidney size or function, functional evidence of renal artery stenosis, acute
pyelonephritis, or scars
aThis modality has been largely supplanted by computed tomography, although it remains useful to describe fine detail in the collecting system. b With or without contrast
c Captopril renography, mercaptoacetyltriglycine (MAG3), dimercaptosuccinic acid (DMSA)
TABLE 8: STAGES OF CHRONIC KIDNEY DISEASE AND CLINICAL ACTION PLANS27
STAGE DESCRIPTION GFR CLINICAL ACTION PLAN 1 Kidney damage
with normal or
F GFR
≥90 Diagnosis and treatment, treatment of comorbid conditions, slow progression, CVD risk reduction
2 Kidney damage with mild ↓ GFR
60-89 Estimating progression
3 Moderate ↓ GFR
30-59 Evaluating and treating complications 4 Severe ↓ GFR 15-29 Preparation for kidney
replacement therapy 5 Kidney Failure <15 Kidney replacement therapy
(if uremia present and patient consents)
17 FREQUENTLY ASKED QUESTIONS ABOUT GFR ESTIMATES
49) What are markers of kidney damage?
The most common causes of CKD in North America are diabetes and hypertension; therefore, persistent proteinuria (albuminuria) is the prin-cipal marker of kidney damage. Other markers of damage include:
• abnormalities in composition of the blood or urine
• abnormal findings on imaging studies (Table 9)27
50) What is the recommended method to
screen for proteinuria?
The KDOQI Guidelines recommend that the fol-lowing criteria be applied when evaluating the tests in random spot urine samples for CKD: • albumin-specific dipstick positive
• albumin-to-creatinine ratio >30 mg/g • routine dipstick (total protein) >1+
• total protein-to-creatinine ratio >200 mg/g The screening for proteinuria in adults is done using an specific dipstick or an albumin-to-creatinine ratio on a random (spot) urine sample. A routine dipstick is not sensitive enough to detect small amounts of urine protein (as in “microalbuminuria”).
51) What are the complications and
common comorbidities associated with
chronic kidney disease?
Chronic kidney disease results in loss of kidney function, sometimes leading to kidney failure. A person with kidney disease may develop other serious complications including:
• hypertension
• malnutrition / poor nutritional health (negative metabolic balance)
• anemia
• mineral and bone disorders, including hyperphos-phatemia, hypocalcemia, and vitamin D deficiency • secondary hyperparathyroidism
• hypoalbuminemia
• dyslipidemia (hypercholesterolemia, hypertriglyceridemia)
• cardiovascular disease [some examples include coronary heart disease (CAD), left ventricular hypertrophy (LVH), peripheral vascular disease (PVD), and valvular heart disease (VHD)] • vascular calcification
TABLE 10: IS IT MICROALBUMINURIA?* † 34 Measure urinary albumin-to-creatinine ratio (ACR) in spot urine sample
CATEGORY SPOT (MG/G CREATININE)
Normoalbuminuria <30 Microalbuminuria 30–300 Macroalbuminuria >300
*Because of variability in urinary albumin excretion, at least two specimens, preferably first morning void, collected within a 3–6 month period should be abnormal before considering a patient to have crossed one of these diagnostic thresholds.
†Exercise within 24 hours, infection, fever, congestive heart failure, marked hyperglycemia, pregnancy, marked hypertension, urinary tract infection, and hematuria may increase urinary albumin over baseline values.