q2003 American Meteorological Society
Convective Clouds over the Bay of Bengal
PAQUITAZUIDEMANOAA/Environmental Technology Laboratory, Boulder, Colorado
(Manuscript received 10 January 2002, in final form 31 May 2002) ABSTRACT
The behavior of convective activity over the Bay of Bengal during the 1988 and 1999 monsoon seasons is examined using 3-hourly satellite infrared data. More organized convective activity, spreading farther south into the bay, occurred in 1988 than in 1999. A distinct spatial grouping of convective systems by size is found. The east side of the bay experiences most of the rainfall over water, and here the convective systems are relatively small, short lived, and frequent. At the northwest side of the bay near most of the land-based rainfall, convective activity is organized into much larger and longer-lived systems. The diurnal cycle of all the systems over the bay, regardless of size, shows a 0600 local time (LT) maximum in very cold cloud tops (infrared brightness temperature,210 K), with genesis occurring between 2100 and 0300 LT (2100 LT for the larger, longer-lived systems). The cloud systems dissipate after sunrise, with the larger systems lasting until the afternoon. The land–water interface is important for the convection genesis and thereby affects the spatial distribution of convection. Offshore nocturnal convection begins near shore, with later convection occurring farther out over the bay and attaining a larger size. The preference for nocturnal initiation times differs markedly from the afternoon initiation times typical of the tropical western Pacific Ocean, but the time of maximum cloud area extent and dissipation are similar. The strength of the diurnal cycle varies greatly with location, with the northwest side of the bay experiencing both the highest amount of very cold cloudiness and the strongest diurnal cycle. The Joint Air–Sea Monsoon Interaction Experiment (JASMINE) research cruise experienced the only multiday sequence of large, diurnally repeating, southward moving disturbances at 118N, 898E in the 2 yr examined, but both the convective diurnal cycle and propagation direction were consistent with climatology. An interesting aspect of the convective life cycle is that systems often have a southward component to their motion, with the most common propagation direction over the entire bay being to the southwest. This can occur even when the larger-scale movement is toward the northwest (such as is typical for cyclones at the northern end of the bay).
1. Introduction
The Bay of Bengal in northern summer is the site of the highest mean precipitation of the entire Asian mon-soon region and perhaps of the global oceans. The co-pious rainfall alone is consequential for human endeav-ors, and the accompanying latent heating helps drive the Asian monsoonal circulation. Despite the impor-tance of the Bay of Bengal to both weather and climate, the region is poorly sampled and researched (Webster et al. 2002). The dynamics and convection of the Bay of Bengal (and of the entire Asian monsoon) are poorly simulated in models (e.g., Spencer and Palmer 1996), and the poor sampling further hampers efforts at model validation and improvement.
The call for research activity in the Bay of Bengal motivated its choice for both the Joint Air–Sea Monsoon Interaction Experiment (JASMINE; Webster et al. 2002), carried out in May–June 1999, and the Bay of Bengal Monsoon Experiment (Bhat et al. 2001), held
Corresponding author address: P. Zuidema, NOAA/ETL/ET6, 325
Broadway, Boulder, CO 80305-3337. E-mail: paquita.zuidema@noaa.gov
July–August 1999. JASMINE set out to document the intraseasonal variability of the Asian monsoon (with the onset of the monsoon being understood as the first in-traseasonal oscillation of the monsoon season). Both quiescent and disturbed conditions were sampled.
During the second intensive observing period occur-ring from 21 to 26 May (‘‘Star 2’’) large (.40 000 km2),
long-lived (1–2 day), nocturnal disturbances propagated due southward over the R/V Ronald Brown (118N, 898E). Two of these disturbances are presented later (see Figs. 3b and 3d and the explanation of the figure pro-vided in section 2). Large southward propagating dis-turbances at this location have received little if any pre-vious documentation.
This paper is, in part, an attempt to place the activity observed during JASMINE within a larger context. I seek to answer the following questions: How ubiquitous are large southward propagating storms in the Bay of Bengal? Are they a regular feature of monsoonal weath-er? Was their observed diurnal variability typical? A comprehensive satellite survey of convective activity within the Bay of Bengal is not yet available with which to answer these questions. What is known, however, points to a complicated climatology that is neither
ar-FIG. 1. Mean rainfall in mm h21for May–Sep 1999 using the TRMM 3B43 parameter, a merging of TRMM Precipitation Radar and Microwave Imager data with infrared data from geosynchronous satellites and rain gauge data over land. See Adler et al. (2000) for more details.
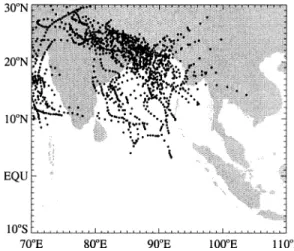
FIG. 2. All 6-h reports of cyclones between May and Sep of 1971– 2000, as reported by the Joint Typhoon Warning Center at Guam.
chetypically oceanic nor continental. Results from other regions, such as the western Pacific warm pool, will not necessarily apply to the Bay of Bengal.
Many independent datasets document a high degree of convective activity within the Bay of Bengal. Sample dataset include highly reflective cloud (Grossman and Garcia 1990), satellite microwave (Spencer 1993), out-going longwave radiation (Roca and Ramanathan 2000), Tropical Rainfall Measuring Mission (TRMM) Precip-itation Radar storm heights (Short and Nakamura 2000), and satellite lightning detection1(Toracinta and Zipser
2001). Perhaps the best direct rainfall measure is pro-vided by the TRMM Microwave Imager and Precipi-tation Radar data, merged with geosynchronous satellite infrared data and land-based rain gauge data (Adler et al. 2000). The estimated mean rainfall rate for May– September 1999 using this dataset is shown in Fig. 1 for the Bay of Bengal. The mean rainfall rate was the highest over the Bay of Bengal of anywhere over the globe for this time period.
Figure 1 shows that the rainfall was mostly concen-trated in the east-northeast side of the bay. Most of the rainfall takes place over water but favors being close to land. This locational preference is also seen in a 1979– 91 satellite microwave rainfall climatology (Spencer 1993) and in a spatial distribution of infrared-inferred cold-cloud tops (Roca and Ramanathan 2000, Fig. 2). TRMM-identified precipitation features with ice scat-tering are also more numerous on the east side of the bay than the west (S. Nesbitt 2001, personal
commu-1The Bay of Bengal is one of the few large salt-body regions with a disposition for lightning, and lightning was routinely observed at night throughout JASMINE. Lightning tends to indicate strong ver-tical updrafts within convective cores.
nication; see Nesbitt and Zipser 2000, for more expla-nation).
While most of the rainfall occurs on the east side of the bay, the more organized, larger-scale convective sys-tems occur on the west-northwest side of the bay. Figure 2 shows all 6-hourly reports of cyclones for the same spatial domain as in Fig. 1 for May–September of 1971– 2000, as given by the Joint Typhoon Warning Center in Guam. A clear preference exists for the north-north-west side of the bay. Monsoon lows, depressions, and disturbances are much more numerous (and possess weaker circulations) than cyclones, but have similiar spatial distributions. Cyclones generally begin over wa-ter then move northwestward over land, often with se-vere impacts on human welfare.
A preference for the west side of the bay is seen in other indicators of severe weather or high vertical mo-tion, for example, satellite-detected lightning frequency (Toracinta and Zipser 2001; their Fig. 3), high (12–15 km) TRMM 30-dBZ echo heights (S. Nesbitt 2001, per-sonal communication), high tropopause heights (Newell and Gould-Stewart 1981), and mesoscale convective complexes (MCCs) (Laing and Fritsch 1993). Finally, the National Centers for Environmental Prediction–Na-tional Center for Atmospheric Research (NCEP–NCAR) reanalysis (Kalnay et al. 1996) places most precipitation on the northwest side of the bay. The reanalysis product is not a robust indicator of precipitation, but it does indicate favorable conditions for vertical ascent on a large spatial scale.
To date, the convection occurring within the Bay of Bengal remains incompletely documented. Many sat-ellite studies of this region have relied on polar-orbiting satellites that pass over the region twice a day at set times, and have focused on larger-timescale phenomena such as intraseasonal oscillations (e.g., Lawrence and Webster 2001, and references therein). In part, the lack of a survey reflects a paucity of geostationary satellite data for this region. The Japanese Geostationary
Me-teorological Satellite (GMS) and the European Meteosat satellites at their normal location have low viewing an-gles into the Bay of Bengal, which undermines their data quality. The geostationary Indian INSAT satellite is at an appropriate location, but its data are not available to Western researchers on a continuous basis. One year of 3-h INSAT data is available through the NCAR data archive. These data have been applied in a few studies of the more extreme convective events in the Bay of Bengal, such as MCCs (Laing and Fritsch 1993) or trop-ical storms and cyclones (Smith and Mehta 1990). A more comprehensive analysis of convective activity is done by Roca and Ramanathan (2000), but this often averages over a large spatial domain that ignores unique conditions within the Bay of Bengal. The TRMM sat-ellite is invaluable as a direct precipitation measure from space, but samples a particular location infrequently.
The focus of this study is to provide a comprehensive survey, using 3-h geostationary infrared satellite im-agery with viewing angles not too far from nadir, of the convective activity for this climatically important area, from the small, individual cloud to the large cloud com-plexes. In addition, their life cycle evolution is tracked from genesis, to maximum area attained, to end. The survey spans 1999 (the year JASMINE occurred) and 1988 for more completeness. The diurnal cycle is elu-cidated, partly to help identify the respective influences of land and water. Such studies have been done previ-ously for other regions of the globe (e.g., Chen and Houze 1997; Chen et al. 1996; Machado et al. 1998; Mapes and Houze 1993; Mathon and Laurent 2001) but not for the Bay of Bengal domain.
Two geostationary infrared satellite datasets are used. One dataset comes from the Meteosat-5 satellite, which was moved to 638E on 19 April 1999, in support of JASMINE and the Indian Ocean Experiment (IN-DOEX). The second dataset is the 3-h INSAT infrared imagery of May–September 1988 mentioned previous-ly. A pixel-grouping algorithm is used to identify a cloud cluster, which can then be tracked from image to image to characterize the temporal progression of con-vective events.
2. Data and method a. Data
The 3-h Meteosat-5 infrared (10.5–12.5mm) imagery data of May–September 1999 were used. These were missing 5% of the total possible number of images, mostly in September. The missing images were random-ly distributed throughout the diurnal cycle. The data showed no obvious signs of calibration change or other data dropout aside from the missing complete images. The infrared mean count at a 0.258resolution was con-verted to brightness temperatures using coefficients pro-vided with the data by the European Organisation for
the Exploitation of Meteorological Satellites (EUMET-SAT).
The second dataset is the 3-h INSAT infrared imagery of May–September 1988. The INSAT satellite is nom-inally located at 758E. A count-to-brightness tempera-ture conversion table was provided with the data. At the
Tb thresholds used, the resolution is 1 K (Smith and
Mehta 1990). The full-disk images have a spatial res-olution of 22 km; these were interpolated to the same 0.258resolution of Meteosat-5. Larger data gaps existed in the INSAT dataset than in the Meteosat-5 dataset, both in missing images (7.3% of possible total) and what appeared to be bit dropouts affecting some scan lines. Images were visually inspected, and those containing a large amount of data dropout within the Bay of Bengal region were discarded from the analysis; this reduced the dataset a further 3%. The missing images were ran-domly distributed throughout time of day. The larger INSAT data dropout will cause an underestimation of the 1988 cold cloudiness, but cannot affect the result that 1988 contained more and larger coherent convective activity than 1999 (section 3). The reported INSAT im-age times were not consistent, but were almost always within one-half hour of and rounded off to that 3-h time interval. No calibration issues are reported in the lit-erature for either satellite instrument. The two satellite datasets are treated identically, and the focus is almost entirely on the Bay of Bengal, which is defined here to span from 58–258N to 808–1008E.
b. Infrared brightness temperature threshold
The infrared satellite literature contains a range of temperature thresholds, summarized in Mapes and Houze (1993) and Machado et al. (1998). Inferences made about convective activity and life cycles vary with the choice of temperature threshold (e.g., Mapes and Houze 1993; Mathon and Laurent 2001). One of these is that colder cloud tops correspond more closely to heavier rainfall events (Chen and Houze 1997; Rick-enbach and Rutledge 1998). For this reason, we show results for two infrared temperature (Tb) thresholds: 235
K, to document the behavior of all clouds thought to be rain bearing, and 210 K, to document the behavior of the most heavily precipitating clouds.
The 235-K threshold was chosen because of a doc-umented fit between area- and time-averaged rainfall and Tb(Arkin 1979; Ohsawa et al. 2001). The 235-K
threshold is the commonly used Geostationary Opera-tional Environmental Satellite (GOES) Precipitation In-dex (Arkin 1979), arrived at through correlating radar-based rainfall estimates and the satellite fractional area coverage of Tb,235 K pixels on a 1.58 31.58to 2.58 32.58spatial scale during the Global Atmospheric Re-search Program (GARP) Atlantic Tropical Experiment. This threshold was tested again against rainfall gauge over India in Arkin et al. (1989), and found to perform well for most regions with the exception of the Ghat
Mountains and the Gangetic Plain. A similar linear re-gression analysis of rainfall gauge data and satellite data by Ohsawa et al. (2001) over tropical Asia arrived at a
Tbthreshold choice of 230 K.
The 210-K threshold is taken as an indicator of the precipitation boundary within deep convective clouds. It is close to the 208-K threshold found to correspond best with the instantaneous precipitation area in radar-sampled deep convective systems over the western Pa-cific (Mapes and Houze 1993), and is used by Chen and Houze (1997) to examine diurnal variations in the life cycles of tropical deep convective systems.
The correspondence between the brightness temper-ature thresholds and precipitation is a core assumption for this study, but it is a statistical and not a literal relationship. Precipitation can originate from clouds with tops warmer than the threshold (Sheu et al. 1997; Short and Nakamura 2000). Alternately, clouds with very cold tops may simply be advected cirrus, especially for this region of high wind shear (see Rickenbach 1999, for more discussion).
c. Cloud clustering and tracking
The 235-K threshold is an unreliable indicator of pre-cipitation on an individual pixel basis. Partly for this reason, cloud clusters were identified and tracked only through the 210-K threshold. Few clear cases of cirrus advected westward by the upper-level winds were seen with the 210-K threshold.2A colder threshold also
pro-vides better definition of a time cluster, with less sub-tleties in storm identity and continuation as cloud clus-ters merge and split up.
The method is simple:
1) ‘‘Cloud clusters’’ are closed countours of ,210 K
Tb within each image (i.e., all pixels must share at
least one row or column with a neighboring cold pixel). Their area and the location of the centroid are determined. The data resolution means that the smallest cloud cluster, comprising one pixel only, will have an area of about 600 km2.
2) ‘‘Time clusters’’ are cloud clusters within sequential images with overlapping positions. Their overlap must exceed either 10 000 km2 or 50% of either
cluster. The times, centroid locations, and area of the start and end of each time cluster are determined as well as when each time cluster achieves its maximum size. In addition, the total area covered by each time cluster during its lifetime is calculated. Cloud cluster merges and splits are taken into account throughout the time matching.
This procedure was previously developed and applied to characterize the Australian monsoon (Williams and Houze 1987), the area covered by the Japanese GMS
2The dissipating cluster in Fig. 3c may be an example of advected cirrus, but this example used a threshold Tbof 218 K.
satellite (Mapes and Houze 1993), and the tropical west-ern Pacific warm pool (Chen et al. 1996). The method depends on slow cloud propagations between two se-quential images relative to its size. For 3-h resolution data, the areal overlap method performs well for clouds with areas of roughly.8000 km2(Machado et al. 1998).
This implies that we are only able to track cloud clusters of sizes larger than about 12 pixels from image to image. The simple but objective area overlap tracking approach is as functional as more elaborate methods that include cloud morphology and radiative criteria (Machado et al. 1998).
The time cluster lifetime and total area cloud coverage are dependent on the threshold chosen, with warmer thresholds corresponding to larger cloud areas, longer lifetimes, and slower propagation speeds (e.g., Mathon and Laurent 2001). The lifetimes and cloud areas de-duced here using the 210-K threshold will be under-estimates of the true convective area and lifetime. In addition, only literal, continuous propagations of con-vective activity will be identified, and larger-scale dis-placements of convective activity occurring within a larger envelope will be missed.
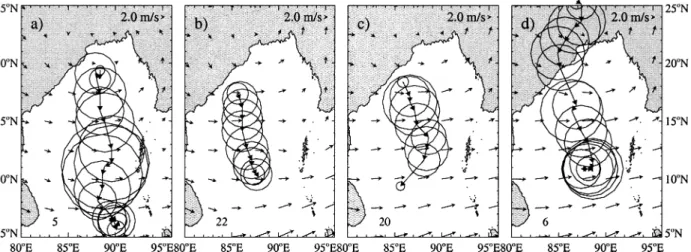
Examples of cloud clusters and time clusters, derived using a 218-K threshold, are shown in Fig. 3. A dis-turbance that passed over the R/V Ronald Brown during JASMINE is shown in Fig. 3b. The area covered by each circle is roughly to scale.
d. Geography
A map of the Bay of Bengal domain is shown here in Fig. 4. Point Palymras refers to the convex peninsula on the Indian coast, and the Iriwaddy refers to the con-vex coastline formed by the broad delta of the Iriwaddy River, with the Gulf of Martaban to its southeast. The plus sign indicates the position of the R/V Ronald Brown during the second intensive observing period of JAS-MINE.
3. General context of the 1988 and 1999 monsoons
Figure 5 shows the monsoonal-mean (1 May–30 Sep-tember) percent high cloudiness for (a) 1988 Tb,235
K, (b) 1999 Tb,235 K, (c) 1988 Tb,210 K, and (d)
1999 Tb,210 K. The monsoonal-mean 850-mb wind
field is included in Figs. 5a and 5b, and the monsoonal-mean 300-mb wind field and the sea level pressure are in Figs. 5c and 5d. Percent high cloud (PHC) is defined as the percentage of pixels with Tb,235 K (PHC235)
or Tb, 210 K (PHC210) within the dataset.
Figure 5 shows that in 1999 much of the high cloud-iness occurred near shore, either on the east side for PHC235, or on the northwest side for PHC210. In contrast,
in 1988 the high cloudiness was less localized and more of it extended farther south into the bay. Averaged over the 58–258N, 808–1008E region, slightly more high
FIG. 3. Four examples of time clusters, as defined in section 2, from May 1999: (a) 0300 UTC 19 May–0300 UTC 21 May, (b) 2400 UTC 21 May–0300 UTC 23 May, (c) 0300 UTC 23 May–0300 UTC 24 May, and (d) 0600 UTC 23 May–0600 UTC 25 May. Each circle represents a closed contour of satellite-inferred Tb,218 K, and corresponds roughly to the cloud cluster size. Arrows show the direction of the centroid
from image to image. Superimposed is the daily- or 2-day-average 850-mb NCEP–NCAR reanalysis wind field closest to the date(s) of the time cluster. The numbers in the bottom-left-hand corner refer to the ranking of the event within the entire May–Sep season for the Bay of Bengal; that is, the event in (d) was the sixth largest in total area coverage of all events occurring within the Bay of Bengal between 1 May and 30 Sep of 1999. The average propagation speeds for (a)–(d) are 8.5, 8.2, 11.6, and 9.3 m s21, respectively.
FIG. 4. Geography of the Bay of Bengal. Altitudes of 500, 1000, and 4000 m are shown in progressively darker shades of gray. The
1symbol indicates the position of the R/V Ronald Brown during JASMINE IOP 2.
cloudiness occurred in 1999 than in 1988 (16.3% versus 15.6% for PHC235and 3.1% versus 2.8% for PHC210).
We can compare this to the popular All-India Rainfall Index (AIRI), an average of station rain gauge data with-in India that is often used as an with-index of monsoon strength. For 1988, the AIRI was about two standard deviations above the 1871–1994 mean, while in 1999 the AIRI was slightly below the long-term mean. This implies that 1988 was a strong monsoon year and 1999 a slightly weak monsoon year. Lawrence and Webster (2001) note that the AIRI is not a good indicator of mean convective activity in the Bay of Bengal. Figure 5 suggests this may be because the spatial distribution of the convection varies so strongly between years that
a spatially averaged value is not very meaningful. In-stead, the spatial variation in the convection over water may be reflected in the spatial variation of convection over land (Bhat et al. 2001).
Figure 5 also shows very different cloud maxima lo-cations for PHC210 (panels c and d) than for PHC235
(panels a and b). During both years, most of the PHC235
is found near the eastern side of the bay, and particularly within the Gulf of Martaban. There is a good spatial match between Fig. 5b and the 1999 TRMM mean rain-fall estimate of Fig. 1. It occurs in a region of seasonal-mean low-level onshore winds onto a coastal mountain range. In contrast Figs. 5c and 5d show that the PHC210
cloud is more likely to be found in the northwest or west side of the bay, with the maximum cloudiness slightly south of the mean sea level pressure minimum. This coincides with the cyclone distribution shown in Fig. 2.
4. Cloud clusters
We find a distinct grouping of the cloud clusters by size and location, elucidated here in section 4c. This allows us to conclude that most of the rainfall in the bay originates from the relatively smaller cloud clusters. The cloud clusters of 1988 were larger than those of 1999, which implies more organized convection in 1988 than in 1999. JASMINE Star 2 was a convective ex-ception within an otherwise relatively calm monsoon year. Finally, a maximum cloud area occurs at 0600 LT for all clouds irrespective of size.
a. Time series
Figures 6 and 7 show time series of the individual cloud clusters for 1999 and 1988, respectively, as well
FIG. 5. Monsoonal-mean (1 May–30 Sep) percent high cloudiness maps for (a) 1988 PHC235, (b) 1999 PHC235, (c) 1988 PHC210, and (d) 1999 PHC210. Superimposed in (a) and (b) are the NCEP–NCAR reanalysis May–Sep mean 850-mb winds (arrows) for the respective years, and in (c) and (d) the NCEP–NCAR reanalysis May–Sep mean 300-850-mb winds (arrows) and sea level pressure (white line; 1-mb contour levels). Percent high cloud is defined as the percentage of pixels with Tb,Tthresholdof the existing images.
as a time series of the mean PHC235over the bay. For
both years, the largest cloud clusters occur within the first half of the monsoon season and clearly demarcate the monsoon onset, with the cloud clusters diminishing in size in the latter half. Large cloud clusters are as-sociated with the 8–11 June 1999 cyclone. The cyclone activity in both years was slightly weak (no cyclones
were recorded in 1988). One-third of the cyclones shown in Fig. 2 occurred in May, suggesting that a preference for the largest cloud clusters to occur early in the monsoon season is typical.
Some of the largest cloud clusters of the entire 1999 monsoon season, and the highest spatial-mean PHC235
FIG. 6. Line shows the running 3-day-mean PHC235averaged over the Bay of Bengal (108–258N, 808–1008E) for 1999, while filled circles indicate the size of the individual cloud cluster elements (Tb,210 K) from 1 May until
30 Sep 1999.
FIG. 7. Same as in Fig. 6 but for 1988. Note the larger range of values for the cloud cluster sizes.
2, 21–26 May 1999. In general the larger cloud clusters occur when the mean PHC235is high, but whereas the
largest cloud clusters occur early on, no trend is evident in the spatial-mean PHC235with time during either year.
This suggests that convective activity becomes less or-ganized as a monsoon progresses, but not less frequent.
b. Size distribution
As seen in a comparison between Figs. 6 and 7, the cloud clusters in 1988 attain a larger size than those of 1999. This is further demonstrated in Fig. 8, showing the frequency distribution of the number of cloud clus-ters for each year as a function of the cloud cluster size. It is also evident that 1999 had more small cloud clusters than 1988.
Figure 9 shows the cumulative fraction of total cov-erage of the Bay of Bengal as a function of cloud cluster size for 1999 (thick line) and 1988 (thin line). For fur-ther comparison, similar curves are shown for the larger Indian Ocean domain (dashed lines), and filled circles for the Japanese GMS domain (808E–1608W), taken from Chen et al. (1996, Fig. 5). The larger cluster el-ements occurring in 1988 force the entire distribution to the right. Many of these larger 1988 cloud clusters came from farther south in the bay, where clouds were more likely to be organized into larger systems, as will be discussed further in section 4c. We also see a ten-dency for more numerous large cloud clusters in the Bay of Bengal than in the entire Indian Ocean domain. The GMS values are not directly comparable,3but more
year-to-year variability is seen in the 2 yr of Indian
3The GMS dataset had a higher spatial resolution of 10 km.
Ocean data than was observed in the 4 yr of GMS data, which is possibly a reflection of the smaller domain examined.
c. Location
As can be seen in Fig. 10, the cloud clusters within the Bay of Bengal show a distinct spatial grouping by size. The four size groups were defined from quartiles constructed from the size distribution summed over both years, with each quartile contributing 25% to the total cloud coverage (see Fig. 9). The quartile boundaries occur at cloud cluster area sizes of 22 500, 62 500, and 136 900 km2. These correspond to cluster radii (r 5
) of 85, 140, and 210 km.
Ïarea/p
The smallest cloud clusters (Fig. 10a) occur either at the east side of the bay near shore, or over land. Their distribution coincides very well with the rainfall distri-bution shown in Fig. 1. As the cloud clusters increase in size, they are less likely to occur over land and more likely to occur in the middle and west side of the bay. The largest cloud clusters over land occur over the Gan-getic Plain. The largest cloud clusters over water (r. 210 km; Fig. 10d) occur primarily in only two locations: directly offshore of Point Palymras at about 208N and 878E, and farther south in the bay at roughly 158N and 898E. The northerly location is mirrored in the cyclone locations reported in Fig. 2.
Support for the overall spatial distribution exists in TRMM and Special Sensor Microwave Imager (SSM/ I) data. General TRMM data precipitation features fer the east side of the bay (Fig. 1) while TRMM pre-cipitation features containing mesoscale convective sys-tems (MCSs; hence, more convective organization) are
FIG. 8. The frequency distribution of the number of cloud clusters (expressed as the log10) for 1988 (solid line) and 1999 (dotted line) as a function of cloud cluster size.
FIG. 9. The cumulative coverage fraction of pixels with Tb,210
K. The dashed lines refer to the Indian Ocean domain from 208S to 258N and from 408to 1108E, while the straight lines refer to the Bay of Bengal (58–258N, 808–1008E). The thick lines refer to 1999 and the thin lines to 1988. The dots refer to the quartiles shown in Chen et al. (1996), Fig. 5, based on 4 yr of GMS data.
FIG. 10. Locations of the cloud clusters of both years within the (a) lowest (r,85 km), (b) second (85,r,140 km), (c) third (140,r,210 km), and (d) top quartiles (r.210 km), expressed as contours of the number of clusters. (a) and (b) are at 18resolution and (c) and (d) at 28resolution.
FIG. 11. The diurnal cycle expressed as the percent of the daily total area for each quartile defined in Fig. 9, but for the water-only regions lying within 58–228N, 808–988E, defined at 18resolution.
more equitably distributed throughout the bay (S. Nes-bitt 2001, personal communication). A population of ‘‘intense’’ mesoscale systems is also identified in SSM/ I data in the middle of the bay at about 178N (Toracinta and Zipser 2001; their Fig. 11).
Other similar studies conclude that large cloud sys-tems are responsible for most of the precipitation in their locations of study (e.g., Chen and Houze 1997; Chen et al. 1996; Machado et al. 1998; Mapes and Houze 1993; Mathon and Laurent 2001). In contrast, from a comparison with TRMM data, I conclude that most of the rainfall in the Bay of Bengal comes from smaller, more numerous convective systems. Previous studies have focused on either ocean-only or land-only regions, and the explanation for the discrepancy may well reflect the impact of the coast, such as, for example, the pres-sure deceleration mechanism of Grossman and Durran (1984).
d. Diurnal variability in cloud clusters
Figure 11 shows the diurnal cycle in the cloud cov-erage amount for each cloud cluster size class, expressed as the percent of the daily total cloud area. An attempt was made to isolate the diurnal behavior over the water, and the Bay of Bengal domain was restricted to water-only 18 grid boxes for this figure. The largest cloud cluster size has the most pronounced diurnal cycle, with a maximum:minimum ratio of about 10. The smaller cloud clusters have a similar phasing in their diurnal cycle, with 0600 or 0900 LT maxima and 1800 or 2100 LT minima, but their maximum:minimum ratio is much smaller, about 2 or 3. The top quartile has an asym-metrical diurnal cycle with area coverage that increases rapidly after midnight, reaches a peak at 0600 LT, decays slowly from 0600 LT to noon, and rapidly thereafter, reaching a minimum at 1800 LT. This cycle in cloud
area coverage will be seen again later in the time cluster life cycles.
A comparison of Fig. 11 to a similar figure derived for the western Pacific warm pool (Chen et al. 1996) reveals that the most pronounced diurnal cycle also ex-ists for the largest cloud clusters of the tropical western Pacific warm pool, but negligible amplitudes exist for the smallest two quartiles. Most of the Bay of Bengal cloudiness occurs near shoreline, and one influence of land may be to impose a dawn maximum upon all clouds irrespective of size. The weak afternoon convection over open water found by Chen and Houze (1997) is not evident here.
5. Mean diurnal variability
How does land influence the cloudiness diurnal cycle over the bay? We investigate this here through docu-menting the Bay of Bengal diurnal cycle and comparing it to that of the tropical western Pacific (TWP) warm pool. We chose the tropical western Pacific not only because much of it is far away from land, but also be-cause the TWP also experiences high sea surface tem-peratures and is at a low latitude, and, it has a well-examined diurnal cycle. The largest difference in the diurnal cycle between the two regions is found to be nocturnal initiation times in the Bay of Bengal occurring near shore versus late afternoon initiation times over the TWP (or land). The time of maximum cloudiness in the Bay of Bengal is slightly later than that of the TWP (but not after dawn), and the dissipation times are sim-ilar for the two regions.
We find that the convective life cycle in the Bay of Bengal depends strongly on location. The convection occurring near land begins close to shore, with subse-quent convection occurring up to ;300 km offshore. Farther away from land (;1000 km) the diurnal cycle resembles that of the open ocean. The northwest side of the bay has the most pronounced diurnal cycle.
a. Mean 3-hourly PHC235and PHC210
Figures 12 and 13 show the 3-h diurnal cycles in PHC235 and PHC210, respectively, for May–September
of 1988 and 1999 combined. The local time stated in the panels is the local time appropriate for 908E.
Over land the behavior of PHC235and PHC210is very
similar, with an intense and short-lived peak in activity occurring around 1800 LT. The maximum cold cloud-iness amount of the whole region occurs at this time, northwest of the bay (;178–208N, 828–878E). By 0300 LT, the land clouds are gone, aside from a peak in cloud-iness occurring over Bangladesh. This coincides with the location of Cherrapunji, world-record holder of the highest mean annual rainfall. Rainfall gauges also re-cord a late night/early morning maximum at this site (Ohsawa et al. 2001).
FIG. 12. The diurnal cycle in PHC235percent high cloudiness shown at 3-h time intervals. The stated local times are appropriate for 908E: (a)–(h) local midnight, 0300 LT, 0600 LT, 0900 LT, local noon, 1500 LT, 1800 LT, and 2100 LT, respectively.
side of the bay and the maximum PHC210at the
north-west side. Both PHC235and PHC210begin to develop in
the late evening to midnight, reach a maximum area at 0600 LT, maintain a large area for 3–6 h, then dissipate slowly before noon and rapidly thereafter. By 2100 LT, the bay has a minimum in cold cloudiness, with sig-nificant PHC235occurring only in the Gulf of Martaban.
Over open water farther south in the bay about 1000 km from land (58–108N, 858–908E), PHC210is highest
from 0300 to 0600 LT. This is similar to the late night maximum seen over the open ocean (e.g., Gray and Jacobsen 1977) and is consistent with the nighttime rain-fall maximum recorded on the R/V Ronald Brown dur-ing JASMINE Star 2.
b. Diurnal maxima and phasing
The local time and amount of cloud maximum is quantified for both PHC210and PHC235in Figs. 14 and
15. In these figures, the diurnal variability is represented as a vector every 3 h, with the length of the vector indicating PHC amount and the vector direction indi-cating the local time. The maximum diurnal PHC is shown as a thicker vector. In this way one can infer the time of maximum convective activity, the amount, and the duration from one figure.4From Fig. 14, we can see
that most of the Tb , 210 K activity occurs in the
northwest side of the bay, and has a broad maximum spanning from 0600 LT to noon (in contrast to the more short-lived neighboring land convection peaking at 1800 LT). Much of the peak convective activity within the bay occurs between 0600 and 1200 LT.
Figure 15 is similar to Fig. 14, but for PHC235. Several
contrasting features are apparent. One is that the diurnal cycle is more uniform over the bay. Another is that the time of maximum cloudiness now mostly occurs in the afternoon, with a few mostly nearshore exceptions. This figure is consistent with Fig. 3 of Ohsawa et al. (2001), yet note that the diurnal maximum on the northwest side of the bay is different in Fig. 15 than in Fig. 14. Figure 14 shows a 0600 LT diurnal maximum that is consistent with rain gauge rainfall data (Ohsawa et al. 2001), whereas Fig. 15 does not accurately capture the maxi-mum time for this location.
The land influence on the diurnal cycle over the bay is more obvious through its impact on the strength than on the timing of the diurnal maximum. With distance away from land, the diurnal cycle becomes weaker. The effect on timing seen here is similar to that previously noted by Yang and Slingo (2001) and Ohsawa et al. (2001). They observe that in the northwest side of the bay, convective activity farther offshore (by up to 58) reaches its maximum later than activity close to shore.5
In Fig. 14, this would be indicated by a clockwise ro-tation in the thickest vector with distance offshore. We do see this in Fig. 14, more clearly in higher-resolution plots not shown here. The phasing is only mostly co-herent north of about 148N for PHC210.
In both Figs. 14 and 15 the phasing between the near-shore and offnear-shore convective maximum is most ap-parent at those locations with strong nearshore diurnal cycles (northwest and east sides of the bay for PHC210
4The figure is a departure from the diurnal harmonic method in which amplitude and phase of diurnal variation are that of the first harmonic derived from 3-h data. Harmonic analysis has the advantage that phase information can be obtained with a higher temporal res-olution than the original data. Problems with the harmonic analysis approach have been demonstrated by Ohsawa et al. (2001) for this region, however, primarily because the diurnal cycle can contain min-ima and maxmin-ima that are separated by only 6 h. Particularly near coastlines, the first harmonic may not capture the true diurnal vari-ation very well.
5Yang and Slingo (2001) as a minimum in convective activity derived from the first harmonic of the diurnal cycle.
and PHC235 respectively). The phasing is clear up to
about 58 or 500 km away from land, and at a distance of about 108or 1000 km away from land the timing of the diurnal cycle no longer shows any land influence.
6. Cloud life cycles
This section presents the life cycle development of the Tb,210 K time clusters. In summary all the cloud
systems attain their maximum area at 0600 LT, irre-spective of size, but the larger longer-lived systems tend to begin earlier and dissipate later. The nighttime genesis times of many of the time clusters contrasts with the late afternoon times found for the TWP. The most com-mon cloud system propagation is to the west-southwest.
a. Spatial and temporal characterization
Figures 11–15 lead us to expect life cycles that vary by cloud size and location. The local time and location of the genesis, maximum cloud area, and dissipation for three time cluster groups are shown in Figs. 17–19. The groups were established using maximum cloud radii of 85, 140, and 210 km, similar to the quartile divisions used for Fig. 11. Clouds with maximum cloud cluster radii of less than 85 km mostly only lasted for one frame [as predicted by Machado et al. (1998)] and are not shown. Larger cloud systems tend to have longer life-times, as shown in Fig. 16. The top three quartiles have mean lifetimes of 19, 9, and 6 h, respectively, but there is a lot of variation.
The largest time clusters, shown in Fig. 17, tend to be over water. Many begin near the north end of the bay and move southwestward thereafter. A more sta-tionary population exists around Point Palymras, so that a few time clusters contribute strongly to the bull’s-eye in cloud cluster number seen in Fig. 10d. The initiation times shown in Fig. 17 peak from 2100 to 0300 LT for the water-based clusters and at 1500 LT for the land-based clusters (deduced from a data subsetting not shown here). A more detailed investigation shows many of the time clusters over water increase rapidly in area after midnight, attain their maximum area at 0600 LT, then decay slightly throughout the morning but rapidly after noon. Time clusters lasting more than 1 day survive the daytime decay, expand again the second night, and usually attain their maximum area coverage on the sec-ond night, again at 0600 LT.
Figure 18, for the next largest time cluster group, shows a similar but perhaps more localized preference for the northwest side of the bay, both for land-based and water-based clusters. The greater localization may reflect a shorter mean lifetime that leaves less time for cloud displacement. The initiation times peak at 0300 LT over water (later than the peak initiation time for the largest systems) and at 1500 LT over land. The maximum areas occur at 0600 LT over water (same as for the largest systems) and 1800 LT over land. The
FIG. 13. Same as in Fig. 12 but for PHC210pixels.
most common dissipation time is at 0900 LT or there-after (slightly earlier than for the largest systems). Fig-ure 19 shows a similar life cycle for the smallest time clusters, with a slightly earlier most common dissipation time of 0600 LT or thereafter over water. As the time clusters diminish in size, a greater proportion of them are seen over land.
The few large time clusters that occur over land (Fig. 17) deserve mention. These usually begin around 1500
LT and, similar to the water-based clusters, attain their largest, single, contiguous cloud area at 0600 LT. Yet, over land, the most common cloud type is small and short lived (see Fig. 10), and occurs around 1800 LT. For the most long-lived systems, these shorter-lived clouds can meld with the larger systems so that the maximum area of the time cluster (which can contain more than one cloud cluster at any one time) can occur in the evening. An example of this is shown in Fig. 3d.
FIG. 14. Diurnal variability in PHC210. The orientation and length of the vector indicates the time and the cloudiness amount, respec-tively. A vector pointing to the north, east, south, and west indicates 0000, 0600, 1200, and 1800 LT, respectively. The thickest vector of each cluster corresponds to the time of the maximum cloudiness amount. Each cluster represents a 18 318average and is shown subsampled every 28.
FIG. 16. Time cluster lifetime vs maximum radius attained.
FIG. 15. Same as in Fig. 14 but for PHC235.
FIG. 17. Locations at the time of (a) genesis, (b) maximum areal extent, and (c) ending, for time clusters with maximum cluster radii
.210 km. The local time at (d) the beginning, (e) the maximum areal extent, and (f ) ending of the time cluster life cycle.
b. Comparison to tropical western Pacific
Chen and Houze (1997) have done a similar analysis for cloud life cycles over the western Pacific warm pool, and find an initiation time of about 1500 LT, for both small and large cloud systems. Chen and Houze (1997) attribute this to daytime boundary layer warming. In contrast, we find a preference for nighttime 2100–0600 LT initiation times, particularly near land. The
differ-ence in the two initiation times is a direct reflection of the influence of the land–sea interface to the genesis process within the Bay of Bengal. In a data subsetting not shown here, systems farther south in the bay and farther away from land were more likely to start in the late afternoon [similar to results in Chen and Houze (1997)] than those farther north.
For the other life cycle stages (maximum area and ending), both our study and Chen and Houze (1997) observe predawn cloud maxima independent of loca-tion, and late morning dissipation. This suggests cloud development and dissipation processes that are inde-pendent of the initiation process and of the particular location. Examples can include nighttime cloud-top longwave cooling and daytime cloud shortwave ab-sorption.
c. Cloud system propagation
One motivation for this study was to investigate cloud movement within the Bay of Bengal. A common
plot-FIG. 18. Same as in Fig. 17 but for time clusters with maximum cluster radii between 140 and 210 km.
FIG. 19. Same as in Fig. 17 but for time clusters with maximum cluster radii between 85 and 140 km.
FIG. 20. Direction of propagation for all 1988 and 1999 systems whose total movement exceeded 100 km, calculated from the begin-ning and ending location. Results are shown for 308bins, as measured clockwise with due north508. The largest 25% of the storms (as given by their total life cycle cloud area coverage) are shown in gray.
ting device is to show the propagation direction aver-aged over all systems; in this case the mean propagation direction is southward everywhere in the bay (not shown). However, the mean feature would hide much individual variability. A histogram of the trajectories, Fig. 20, shows cloud systems moving in most directions except north, and preferring westward and southward movements. This reflects in part a consistent, west-ward offshore movement of nighttime convection in the Gulf of Martaban (discussed further in section 7a), and cloud motions that follow the mean, upper-level winds (see Figs. 5c and 5d), particularly for the month of Sep-tember, when the monsoon has weakened. Throughout most of the bay during May–August, most individual motion trajectories contain a southward component.
The cyclone tracks shown in Fig. 2 almost always follow north moving or northwestward moving trajec-tories. West-northwest movement of 7–9-day activity in northeastern India and the northern Bay of Bengal is documented by Lau and Lau (1990). In contrast, Fig. 20 shows few systems with a northward component to their propagation. Separate directions of movement for 1–2- and 5–10-day activity in the Bay of Bengal con-trast, for example, with the western African region, where cloud time clusters propagate in the same direc-tion as larger-scale easterly waves (Mathon and Laurent 2001).
An example is made of the cloud systems composing the 1999 cyclone in Fig. 21. The contributing individual cloud systems generally moved to the southwest, while subsequent events would begin northwest of the pre-vious event. In this way, the overall cyclone movement is to the northwest. The cyclone clouds attained their maximum size (and the cyclone its strongest winds) near Point Palymras, emphasizing the importance of that par-ticular region.
7. Discussion of selected locations
In this section three locations are used to illustrate more fully some characteristics of convection within the
bay. An in-depth examination into plausible explana-tions for the observaexplana-tions would be helped by a mod-eling effort that is beyond the scope of this paper; the aim of this section is more to suggest fruitful avenues for further research. The Gulf of Martaban serves to illustrate the impact on cloud cover of monsoonal flow upon coastal mountains, the Point Palymras region is the site of large-scale disturbances, and last, a context is provided for the JASMINE Star 2 intensive observing period.
a. Gulf of Martaban
The Gulf of Martaban has a pronounced diurnal cycle in convective activity. As shown in Fig. 22, at midnight
FIG. 21. Individual cloud time clusters identified within the cyclone of 8–11 Jun 1999. Arrows point from the first to the last cloud cluster within each sequence. Large Xs indicate the cyclone position as determined by the Joint Typhoon Warning Center in Guam. For (a) 0600– 0900 LT 8 Jun, (b) 2100 LT 8 Jun–1200 LT 9 Jun, (c) 2400 LT 9 Jun–1200 LT 10 Jun, (d) 0600 LT 9 Jun–1200 LT 11 Jun, and (e) 2100 LT 11 Jun–0300 LT 12 Jun.
FIG. 22. Cloud cluster number at (a) local midnight, (b) 0900 LT, (c) local noon, and (d) 1500 LT for both years combined. Cloud clusters have a maximum radii of 85 km.
a population of primarily small, weak (cloud areas, 22 500 km2) yet relatively abundant T
b,210 K cloud
clusters is seen over water, with a sharp boundary de-lineating clear conditions over land. Nine hours later, the clouds have moved 200–300 km west, away from land, and have grown in size (seen in cloud cluster size distributions not shown here). By noon, the cloud pop-ulation over water has become localized off of the Ir-iwaddy delta. These decay rapidly thereafter, followed by a pronounced 1500 LT maximum over the Iriwaddy delta. The diurnal cycle over water is similar to that observed off the coast of north Borneo during the winter monsoon season (Houze et al. 1981), and off the coast of Colombia (Mapes et al. 2003).
Several mechanisms may play a part in explaining the pronounced diurnal cycle observed within the Gulf
of Martaban. One is that of Grossman and Durran (1984), who explain convection offshore of the Indian Ghat Mountains as a response to upstream pressure de-celaration of the monsoon flow by the coastal moun-tains. An examination of the diurnal cycle was beyond the scope of their study; however, a thermal process could provide a diurnal cycle to the pressure deceler-ation that can preferentially support nocturnal convec-tion. For example, one such process is presented in a recent modeling study of nocturnal convection offshore of Colombia (Mapes et al. 2003). This study ultimately held gravity waves emanating off of land topography responsible for the nighttime offshore convection ini-tiation. A coastal mountain range is present near the Gulf of Martaban (see Fig. 4) and could well generate both upstream blocking and diurnally varying gravity waves.
In addition, the concept of a nighttime land breeze has long been used to explain nocturnal offshore con-vection (see Neumann 1951, and references therein). For example, Houze et al. (1981) explain their observed diurnal cycle as a convergence of a nighttime land breeze with the dominant monsoonal flow. This expla-nation has recently been modified by Ohsawa et al. (2001) to include consideration of shoreline curvature. Ohsawa et al. (2001) find a late night–early morning convective peak at the north Borneo location studied by Houze et al. (1981) even when the nighttime land breeze is in the same direction as the prevailing wind, such as occurs during summer. Ohsawa et al. (2001) attribute this to the concave coastline favoring a nighttime, low-level convergence from the concentration of land breez-es, regardless of the prevailing wind. They find that late night convective activity is especially true of coastal waters with a concave coastline, and present the mouth of the Ganges River as one example. The Gulf of Mar-taban can serve as another example. A modeling study of the Florida Peninsula, occurring at about the same latitude as the Bay of Bengal (but lacking mountains),
FIG. 23. Combined May–Sep 1999 and 1988 mean 850-mb relative vorticity. Contour interval is 231026s21. Derived from the NCEP– NCAR reanalysis daily average winds at 2.58spatial resolution.
supports the idea that coastline shape is influential in determining the timing, location, and intensity of off-shore convection (Baker et al. 2001).
b. Point Palymras
Whereas the cloud cover on the east side of the bay is thought to reflect the response of a monsoonal flow upon the coastal mountains, the cloud cover around Point Palymras is probably more linked to larger-scale circulation features. Here, the land surface is the moist low-lying Gangetic Plain. The nighttime land breeze does not converge with the prevailing monsoonal wind. A large monsoonal-mean surface low occurs (see Fig. 5). This region is a site of active transients (Lau and Lau 1990), with maxima in the 850-mb relative vorticity used to indicate tropical disturbance centers. Figure 23 similarly shows a maximum around Point Palymas in the mean NCEP 850-mb relative vorticity for the two monsoon seasons combined (the individual years are similar). The connection between local disturbances and the more global circulation is demonstrated by a pref-erential occurrence of cyclones in the Bay of Bengal (and elsewhere) during the convective phase of the Mad-den–Julian oscillation (Liebmann et al. 1994).
What is the impact upon cloud cover characteristics? The favorable conditions for convection help support large, long-lived, sometimes slow moving systems (see Figs. 10 and 17). In contrast to the Gulf of Martaban, the spatial distribution of the cloud cover is less sensitive to the coastline (see, e.g., Fig. 21). The cloud systems generally stay close to shore, with most of the cloudiness residing apparently nonpreferentially either over land or over water. The direction of movement is as likely to be parallel to the coast as perpendicular to it.
The diurnal cycle is stronger than that at the Gulf of Martaban (see Fig. 14), especially near land, but both locations have 0600 LT maxima, while the larger
sys-tems around the northwest side of the bay have earlier initiation times (2100 LT versus midnight) and later decay times (afternoon versus noon) than the Gulf of Martaban systems. Again, this may reflect conditions favorable for convection occurring at timescales greater than a day for the northwest bay. The timing of the peak convection over water becomes delayed with distance from land (Ohsawa et al. 2001; Yang and Slingo 2001), as is the case in the Gulf of Martaban. This can hy-pothetically also be explained through gravity waves emanating from the coast, but in the case of the north-west side of the bay, the origin of the gravity waves is land convection rather than land topography. This mech-anism has not been modeled for this region, however, and at present can only be postulated.
c. JASMINE Star 2 (118N, 898E, 21–26 May 1999)
As mentioned in the introduction, during the JAS-MINE Star 2 time period, large, nocturnal, southward moving disturbances were observed (Webster et al. 2002). Most of the rainfall on the R/V Ronald Brown occurred between 2100 and 0600 LT. Such disturbances had not been documented previously at this location. How do the JASMINE observations fit in with the con-vection climatology presented in this paper?
The nocturnal rainfall is consistent with the clima-tological diurnal variability expected for this location, as seen, for example, in Figs. 12 and 13, with an early morning maximum in the very cold clouds (Tb, 210
K) and a late afternoon increase in slightly less cold clouds tops (Tb,235 K). This diurnal cycle is typical
of tropical oceanic convection (Chen and Houze 1997; Gray and Jacobsen 1977) and implies a diminished in-fluence of land on the diurnal cycle at this location.
A multiday sequence of large, diurnally repeating, southward moving time clusters only occurred once at this location in the 2 yr of our cloud-tracking dataset. This would suggest that such events are unusual. In fact, both the direction of motion and the cloud cluster size are in keeping with the 2-yr climatology. For the south-ern Bay of Bengal (58–158N, 858–958E), long-lived sys-tems of both years tended to move south. As shown in Fig. 10, a second maxima of large cloud clusters (most of them from 1988) occurs near (slightly north of ) where Star 2 was held.
It is probably only their degree of organization and size that made the disturbances of Star 2 unusual. Figure 24 shows a time–latitude plot of the brightness tem-perature averaged over 858–908E for May, June, and July of 1999. Diurnal, southward propagating convec-tive activity can be seen to occur in all three months, but the most pronounced activity occurred in May dur-ing JASMINE Star 2. Early cloud observations over the India landmass report that premonsoon convection in northeast India is more intense than the monsoonal con-vection (Ludlam 1980). The behavior during JASMINE may mirror the behavior over land, and, there may be
FIG. 24. Time–latitude plot of the infrared brightness temperature averaged over 858–908E for May–Jul 1999. Dark line shows the position of the R/V Ronald Brown throughout JASMINE. Plot courtesy of D. Lawrence.
a more explicit connection: at least one of the Star 2 events clearly originates over land (see Fig. 3d), a fea-ture that was otherwise uncommon for such southerly time clusters. The convective intensity may also be aid-ed by the presence of midtropospheric dry air during the early parts of Star 2 (see Fig. 9 of Webster et al. 2002), which can increase downdraft evaporation and thereby the intensity of the cold pool (Redelsperger and Lafore 1988). This would be particularly effective after a period of suppressed activity in an environment oth-erwise favorable to convection (Redelsperger et al. 2002).
How do the JASMINE events relate to the distur-bances surveyed by Lau and Lau (1990)? They per-formed a composite analysis of high 850-mb relative vorticity events occurring in the north end of the bay. During Star 2, the daily averaged NCEP 850-mb relative vorticity maxima were high, ranging between 22 and 49 3 1026s21, and remained in the northwest end of
the bay. Yet, the JASMINE events do not follow the life cycle of the ‘‘typical’’ disturbance of Lau and Lau (1990). Their documented generally westward propa-gation is a net tendency, where the westward tendency associated with the advection of the mean absolute vor-ticity by transient fluctuations is stronger than the east-ward tendency associated with the advection of vorticity fluctuations by the time-mean flow (Lau and Lau 1992). In the particular case of 21–26 May 1999, the dynamical balance may well differ from that of the mean picture.
8. Summary
This paper characterizes cloudiness and convection over the Bay of Bengal using 3-h satellite infrared data from 1988 and 1999. Percent high cloudiness is defined using two infrared brightness temperature thresholds, 210 and 235 K, and the life cycles of very cold clouds (Tb,210 K) are tracked.
The two years, 1988 and 1999, have mean PHC235
and PHC210 amounts that are fairly similiar but their
spatial distributions are quite different. In 1988, the cold cloudiness extended farther south and was less local-ized. More large cloud systems occurred in 1988 than
in 1999 partly because the more southern cloud systems were more likely to be large. The different spatial and size distributions of the cloud systems over water co-incide with higher rainfall amounts over mainland India in 1988 than in 1999. Both years had most of their large systems occur in the first half of the monsoon.
The northwest side of the bay is a documented site for much convective activity with significant impacts on mainland Indian weather, and this is where the max-imum PHC210occurs. Here the cloud systems over water
and sometimes over land are large and long lived. The individual cloud systems often contain a southward component to their motion despite being embedded within primarily northwest moving larger-scale activity. The region around Point Palymras is notable for its very large cloud clusters. Their diurnal cycle amplitude is pronounced, with a maximum:minimum cloud area ratio of about 10:1, and helps explain why the strongest di-urnal cycle of the entire bay occurs here. Cloud tops with Tb, 210 K show 0600 LT to noon maxima, and
convection initiation times are earlier and dissipation times later compared to other parts of the bay. The phas-ing of convection discussed in Yang and Slphas-ingo (2001) and Ohsawa et al. (2001), where convection attains its maxima at a later hour farther away from land, is also documented here.
The east side of the bay has most of the rainfall, indeed, a maximum in global rainfall in summer. Here the PHC235is a maximum, while the cloud systems (Tb ,210 K) tend to be small and short lived, but relatively frequent. The cloud systems possess a regular diurnal cycle, with convection beginning offshore around 2100 LT to midnight, later convection occurring farther off-shore and attaining a larger size, and then decaying rapidly around noon. Most of the systems occur only in one 3-h image, so that the offshore propagation most-ly consists of dissipating nearshore systems and initi-ating farther offshore systems. The phasing in PHC235
is most pronounced in the Gulf of Martaban where the diurnal cycle is strongest. At the east side of the bay, the prevailing monsoonal flow is onshore onto coastal mountains. Responses such as the upstream blocking by the pressure deceleration mechanism of Grossman and
Durran (1984) and/or gravity waves emanating off of the land topography (Mapes et al. 2003) may well be active and could explain the observed behavior.
At the southerly location of JASMINE Star 2 (118N, 898E), the multiday sequence of disturbances on 21–26 May 1999 was unusual because such a sequence only occurred once in the 2 yr of data examined. In other respects, the storms were consistent with climatology, with rainfall occurring at night, a southward propaga-tion, and large cloud cover.
Previous studies have similarly tracked clouds for land-only or ocean-only regions of the globe (e.g., Chen and Houze 1997; Chen et al. 1996; Machado et al. 1998; Mapes and Houze 1993; Mathon and Laurent 2001). A common result is that a relatively small number of the cloud clusters generates most of the total areal cloud coverage. From this observation, the conclusion is often drawn that most of the rainfall comes from a few large systems. While this may be true for other regions, over the Bay of Bengal most of the rainfall (as determined using TRMM data) comes from the smaller systems. Similarly, we find cloud motions that differ from, rather than agree with, larger-scale movements. The unique conclusions for the Bay of Bengal domain reflect the complexity of a region that contains both land and water. We compared the results for the Bay of Bengal with those of the tropical western Pacific open ocean (Chen and Houze 1997). The most significant difference occurs in the initiation times of convection, with afternoon ini-tiation times occurring over the tropical open ocean (and land) versus nocturnal initiation times over the bay. An-other difference is that a dawn maximum exists for all cloud clusters over the bay regardless of size, whereas the diurnal amplitude is negligible for the smaller clus-ters over the tropical western Pacific. Both differences demonstrate the strong influence of land on convection occurring over the water of the bay. A land influence is clearly evident in convection occurring roughly 500 km away from land; farther away (;1000 km), the di-urnal cycle is more subdued and more typical of the open ocean.
This study has raised many questions. The differences between the 2 yr in the cold cloudiness location and size distribution mean that conclusions about what is typical for the region should be made cautiously, and should encourage further study for the region. A break-down into active and break phases would be interesting. Further investigation of the diurnal cycle using data with higher temporal resolution would be interesting as would modeling studies of the land–sea dynamic at par-ticular locations. The disturbances of 21–26 May 1999 deserve further study as well, toward understanding why they were the most organized multiday convection events experienced at that location in the 2 yr examined.
Acknowledgments. Dr. Brian Mapes is gratefully
ac-knowledged for the use of his cloud-clustering software and overall encouragement. Many thanks to Dr. David
Lawrence for piquing initial curiosity, as well as for Fig. 24 and reading in and interpolating the original INSAT data to the Meteosat-5 grid. This reseach was motivated by the author’s participation in JASMINE and stimulating conversations occurring throughout the ex-periment with scientists and R/V Ronald Brown crew alike are much appreciated. I thank John Bates, Chris Fairall, Brian Mapes, and two anonymous reviewers for useful comments on an earlier version of this manu-script. Steve Nesbitt provided helpful insight into the TRMM view of convection.
The work was begun while the author was at the Program of Atmospheric and Oceanic Sciences (PAOS), University of Colorado. Support received then under NSF ATM-9819618 as well as subsequent use of PAOS computers is gratefully acknowledged. This work was completed while the author held a National Research Council Research Associateship Award at NOAA/ETL. The Meteosat-5 data were provided by EUMETSAT, and the INSAT data by the NCAR Data Archive. The TRMM level 3 data for Fig. 1 were processed and pro-vided by the National Aeronautics and Space Admin-istration and the National Space Development Agency of Japan and made available through its Web site (http: //www.eorc.nasda.go.jp/TRMM). NCEP reanalysis data were provided by the NOAA–CIRES Climate Diag-nostics Center, Boulder, Colorado, from its Web site (http://www.cdc.noaa.gov). Cyclone track data were provided by the Joint Typhoon Warning Center through its Web site (http://www.npmoc.navy.mil/jtwc.html). The AIRI data were obtained online (http:// grads.iges.org/india/allindia.html). The elevation data for Fig. 4 were provided by the U.S. Geological Sur-vey’s EROS Data Center (http://edcdaac.usgs.gov/ gtopo30). This paper was generated using LATEX mac-ros provided by Prof. Steve Sherwood through his Web site.
REFERENCES
Adler, R., G. J. Huffman, D. Bolvin, S. Curtis, and E. Nelkin, 2000: Tropical rainfall distributions determined using TRMM com-bined with other satellite and rain gauge information. J. Appl.
Meteor., 39, 2007–2023.
Arkin, P., 1979: The relationship between fractional coverage of high cloud and rainfall accumulations during GATE over the B-scale array. Mon. Wea. Rev., 107, 1382–1387.
——, A. K. Rao, and R. R. Kelkar, 1989: Large-scale precipitation and outgoing longwave radiation from INSAT-1B during the 1986 southwest monsoon season. J. Climate, 2, 619–628. Baker, R., B. Lynn, A. Boone, W.-K. Tao, and J. Simpson, 2001: The
influence of soil moisture, coastline curvature, and land-breeze circulations on sea-breeze-initiated precipitation. J.
Hydrome-teor., 2, 193–211.
Bhat, G., and Coauthors, 2001: BOBMEX: The Bay of Bengal Mon-soon Experiment. Bull. Amer. Meteor. Soc., 82, 2217–2243. Chen, S. S., and R. A. Houze, 1997: Diurnal variation and life-cycle
of deep convective systems over the tropical Pacific warm pool.
Quart. J. Roy. Meteor. Soc., 123, 357–388.
——, ——, and B. E. Mapes, 1996: Multiscale variability of deep convection in relation to large-scale circulation in TOGA COARE. J. Atmos. Sci., 53, 1380–1409.
Gray, W., and R. Jacobsen, 1977: Diurnal variation of deep cumulus convection. Mon. Wea. Rev., 105, 1171–1188.
Grossman, R., and D. Durran, 1984: Interaction of low-level flow with the western Ghat mountains and offshore convection in the summer monsoon. Mon. Wea. Rev., 112, 652–672.
——, and O. Garcia, 1990: The distribution of deep convection over ocean and land during the Asian summer monsoon. J. Climate,
3, 1032–1044.
Houze, R. A., S. G. Geotis, J. Marks, and A. West, 1981: Winter monsoon convection in the vicinity of north Borneo. Part I: Structure and time variation of clouds and precipitation. Mon.
Wea. Rev., 109, 1595–1614.
Kalnay, E., and Coauthors, 1996: The NCEP/NCAR 40-Year Re-analysis Project. Bull. Amer. Meteor. Soc., 77, 437–471. Laing, A., and J. Fritsch, 1993: Mesoscale convective complexes over
the Indian monsoon region. J. Climate, 6, 911–919.
Lau, K.-H., and N.-C. Lau, 1990: Observed structure and propagation characteristics of tropical summertime synoptic-scale distur-bances. Mon. Wea. Rev., 118, 1888–1913.
——, and ——, 1992: The energetics and propagation dynamics of tropical summertime synoptic-scale disturbances. Mon. Wea.
Rev., 120, 2523–2539.
Lawrence, D. M., and P. Webster, 2001: Interannual variations of the intraseasonal oscillation in the south Asian summer monsoon region. J. Climate, 14, 2910–2922.
Liebmann, B., H. Hendon, and J. Glick, 1994: The relationship be-tween tropical cyclones of the western Pacific and Indian Oceans and the Madden–Julian oscillation. J. Meteor. Soc. Japan, 72, 401–411.
Ludlam, F., 1980: Clouds and Storms. Pennsylvania State University Press, 405 pp.
Machado, L., W. Rossow, R. Guedes, and A. Walker, 1998: Life cycle variations of mesoscale convective systems over the Americas.
Mon. Wea. Rev., 126, 1630–1654.
Mapes, B., and R. Houze, 1993: Cloud clusters and superclusters over the oceanic warm pool. Mon. Wea. Rev., 121, 1398–1415. ——, T. T. Warner, and M. Xu, 2003: Diurnal patterns of rainfall in
northwestern South America. Part III: Diurnal gravity waves and nocturnal convection offshore. Mon. Wea. Rev., 131, 830–844. Mathon, V., and H. Laurent, 2001: Life cycle of Sahelian mesoscale convective cloud systems. Quart. J. Roy. Meteor. Soc., 127, 377– 406.
Nesbitt, S., and E. Zipser, 2000: A census of precipitation features in the Tropics using TRMM: Radar, ice scattering, and lightning observations. J. Climate, 13, 4087–4106.
Neumann, J., 1951: Land breezes and nocturnal thunderstorms. J.
Meteor., 8, 60–67.
Newell, R. E., and S. Gould-Stewart, 1981: A stratospheric fountain.
J. Atmos. Sci., 38, 2789–2796.
Ohsawa, T., H. Ueda, T. Hayashi, A. Watanabe, and J. Matsumoto, 2001: Diurnal variations of convective activity and rainfall in tropical Asia. J. Meteor. Soc. Japan, 79, 333–352.
Redelsperger, J.-L., and J.-P. Lafore, 1988: A three-dimensional sim-ulation of a tropical squall line: Convective organization and thermodynamic vertical transport. J. Atmos. Sci., 45, 1334–1356. ——, D. Parsons, and F. Guichard, 2002: Recovery processes and factors limiting cloud-top height following the arrival of a dry intrusion observed during TOGA COARE. J. Atmos. Sci., 59, 2438–2457.
Rickenbach, T. M., 1999: Cloud-top evolution of tropical oceanic squall lines from radar reflectivity and infrared satellite data.
Mon. Wea. Rev., 127, 2951–2976.
——, and S. A. Rutledge, 1998: Convection in TOGA COARE: Hor-izontal scale, morphology, and rainfall production. J. Atmos. Sci.,
55, 2715–2729.
Roca, R., and V. Ramanathan, 2000: Scale dependence of monsoonal convective systems over the Indian Ocean. J. Climate, 13, 1286– 1298.
Sheu, R.-S., J. A. Curry, and G. Liu, 1997: Vertical stratification of tropical cloud properties as determined from satellite. J.
Geo-phys. Res., 102 (D4), 4231–4245.
Short, D. A., and K. Nakamura, 2000: TRMM radar observations of shallow precipitation over the tropical oceans. J. Climate, 13, 4107–4124.
Smith, E. A., and A. Mehta, 1990: The role of organized tropical storms and cyclones on intraseasonal oscillations in the Asian monsoon domain based on INSAT satellite measurements.
Me-teor. Atmos. Phys., 44, 195–218.
Spencer, K., and T. Palmer, 1996: Interannual tropical rainfall vari-ability in general circulation model simulations associated with the Atmospheric Model Intercomparison Project. J. Climate, 9, 2727–2750.
Spencer, R., 1993: Global oceanic precipitation from the MSU during 1979–91 and comparison to other climatologies. J. Climate, 6, 1301–1326.
Toracinta, E., and E. Zipser, 2001: Lightning and SSM/I ice-scattering mesoscale convective systems in the global Tropics. J. Appl.
Meteor., 40, 983–1002.
Webster, P., and Coauthors, 2002: The JASMINE pilot study. Bull.
Amer. Meteor. Soc., 83, 1603–1630.
Williams, M., and R. A. Houze, 1987: Satellite-observed character-istics of winter monsoon clouds clusters. Mon. Wea. Rev., 115, 505–519.
Yang, G.-Y., and J. Slingo, 2001: The diurnal cycle in the Tropics.