U.S. DEPARTMENT OF COMMERCE
National Oceanic and Atmospheric Administration
National Ocean Service
Center for Operational Oceanographic Products and Services
TIDAL DATUMS AND
THEIR APPLICATIONS
NOAA Special Publication NOS CO-OPS 1
TIDAL DATUMS AND THEIR APPLICATIONS
Silver Spring, Maryland
June 2000
noaa
National Oceanic and Atmospheric AdministrationU.S. DEPARTMENT OF COMMERCE National Ocean Service
Center for Operational Oceanographic Products and Services
National Ocean Service
National Oceanic and Atmospheric Administration
U.S. Department of Commerce
The National Ocean Service (NOS) Center for Operational Oceanographic Products and Services (CO-OPS) collects and distributes observations and predictions of water levels and currents to ensure safe, efficient and environmentally sound maritime commerce. The Center provides the set of water level and coastal current products required to support NOS’ Strategic Plan mission requirements, and to assist in providing operational oceanographic data/products required by NOAA’s other Strategic Plan themes. For example, CO-OPS provides data and products required by the National Weather Service to meet its flood and tsunami warning responsibilities. The Center manages the National Water Level Observation Network (NWLON) and a national network of Physical Oceanographic Real-Time Systems (PORTSTM) in major U.S. harbors. The Center:
establishes standards for the collection and processing of water level and current data; collects and documents user requirements which serve as the foundation for all resulting program activities; designs new and/or improved oceanographic observing systems; designs software to improve CO-OPS’ data processing capabilities; maintains and operates oceanographic observing systems; performs operational data analysis/quality control; and produces/disseminates oceanographic products.
NOAA Special Publication NOS CO-OPS 1
TIDAL DATUMS AND THEIR APPLICATIONS
This special publication was prepared under the editorship of: Stephen K. Gill and John R. Schultz
Contributors:
Wolfgang Scherer, William M. Stoney, Thomas N. Mero, Michael O’Hargan, William Michael Gibson, James R. Hubbard, Michael I. Weiss, Ole Varmer, Brenda Via, Daphne M. Frilot, Kristen A. Tronvig.
February 2001
noaa
National Oceanic and Atmospheric Administration
U.S. DEPARTMENT OF COMMERCE National Oceanic and Atmospheric Administration
Don Evans, Secretary Scott B. Gudes, Acting Under Secretary for Oceans and
Atmosphere and NOAA Administrator
National Ocean Service
Margaret A. Davidson, Acting Assistant Administrator for Ocean Services and Coastal Zone Management
NOTICE
Mention of a commercial company or product does not constitute an endorsement by NOAA. Use for publicity or advertising purposes of information from this publication concerning proprietary products or the tests of such products is not authorized.
FOREWARD
The United Nations declared 1998 to be the International Year of the Ocean. This declaration provides an opportunity to raise public awareness of a fundamental boundary defined by the intersection of the ocean with the land. This intersection is not as simple as it may seem. It is determined by a plane called a tidal datum, and refers to an average height of the water level at particular phases of the tidal cycle. This vertical reference surface is derived from water level measurements recorded along coastlines, estuaries, and tidal rivers of the United States. Tidal datum planes, referenced to a system of bench marks, are fundamental to the determination of the spatial coordinates of latitude, longitude, and elevation relative to mean sea level.
Tidal datums are chiefly used to determine horizontal boundaries, and for estimating heights or depths. The legal determinations of private and public lands, state owned tide lands, state submerged lands, U.S. Navigable waters, U.S. Territorial Sea, Contiguous Zone, and Exclusive Economic Zone, and the High Seas, or international waters, depend on the determination of tidal datums and their surveyed intersection with the coast. Navigation in U.S. Harbors, shipping channels, and intracoastal waterways requires an accurate knowledge of the depth of the ocean and submerged hazards at the low-water phase of the tidal cycle. Passage underneath bridges requires knowledge of the clearance at the high water phase of the tide. In addition, coastal construction and engineering requires knowledge of the tidal cycle; significant wave heights, periods, and directions; the heights of storm surges, or tsunami waves; and, the frequency and horizontal extent of flooding in the coastal zone. Organizing these environmental data into meaningful, decision-making contexts requires the establishment of tidal datums, and their reference to the geodetic control network.
Other countries publish tidal datums that may differ significantly from those of the U.S. In fact, there are hundreds of local datums used throughout the world. This has led to efforts to define a global vertical datum. The ellipsoid serves as a suitable candidate because of its horizontal and vertical accuracy, its relative ease of calculation, and its global accessibility via GPS. A set of vertical transformation functions are required to translate the vertical coordinate provided by GPS into a coordinate referenced to a tidal datum plane. Preliminary research suggests promising results in the construction of a seamless vertical reference system.
This document has been prepared by NOAA’s Center for Operational Oceanographic Products and Services Division to provide background information about tidal datum planes. The chapters present overviews of the history of tidal datums in the U.S., domestic and international legal regimes, water level measurement system and bench marks, derived products available from NOAA, and examples of the practical and legal applications of tidal datums.
TABLE OF CONTENTS
1. INTRODUCTION . . . 1
Purposes of Water Level Observations . . . 1
Report Purpose and Organization . . . 2
2. TIDAL OVERVIEW . . . 3
Characteristics of the Tides . . . 3
Tidal Analysis and Predictions . . . 10
Harmonic Constituents . . . 12
Other Signals in Water Level Measurements . . . 14
3. TIDAL DATUMS . . . 15
A. Chronology from the 1800s to the Present . . . 15
B. Legal History of Tidal Datums . . . 15
C. Congressional Acts . . . 15
Laws Relating to NOS Organic Authority . . . 15
The Organic Act of Feb. 10, 1807 (2 Stat, 413) . . . 16
Appropriations Act of 1841 . . . 16
Coast and Geodetic Survey Act of August 6, 1947 (61, Stat, 787) . . . 16
Under the Submerged Lands Act of 1953 (67 Stat, 29) . . . 16
Outer Continental Shelf Lands Act of 1953 (67 Stat 462) . . . 16
Act of April 5, 1960 (74 Stat. 16) . . . 16
Public Law 105-384 November 13, 1998 (112 Stat. 3451) . . . 17
Laws Relating to Present Regulatory Context . . . 17
Rivers and Harbors Act of 1899 (33 U.S.C. 401) . . . 17
Bridges over Navigable Waters (33 U.S.C. 491-535) . . . 17
Suits in Admiralty Act of 1920 (46 U.S.C. 741) . . . 17
National Environmental Policy Act of 1969 (NEPA) . . . 17
Ports and Waterways Safety Act of 1972 . . . 17
Federal Water Pollution Control Act Amendments of 1972 . . . 17
Marine Protection, Research and Sanctuaries Act of 1972 . . . 18
Coastal Zone Management Act of 1972 . . . 18
Deepwater Port Act of 1974 . . . 18
Fisheries Conservation and Management Act of 1976 (PL 94-265) . . . 18
National Marine Sanctuaries Act (16 U.S.C. 1431) . . . 18
D. Supreme Court Decisions . . . 19
E. National Agreement . . . 19
National Tidal Datum Convention of 1980 . . . 19
F. International Agreements . . . 19
Boundary Waters Treaty of 1909 . . . 19
Convention on the Continental Shelf . . . 19
4. THE NATIONAL WATER LEVEL PROGRAM STANDARDS AND PROCEDURES . 21
A. Water Level Stations . . . 21
B. Benchmarks and Differential Leveling . . . 25
C. Collection of Observations . . . 28
The NWLON Station and Its Equipment . . . 29
Instruments . . . 30
Measurement of Water Levels . . . 31
Backup Water Level System . . . 32
Powering the NGWLMS Unit . . . 32
Data Sampling Rate . . . 32
Data Retrieval . . . 33
Other Primary Sensors . . . 33
D. Quality Assurance of Water Level Data . . . 33
5. DATA PROCESSING AND TIDAL DATUM COMPUTATIONAL METHODOLOGIES 35 A. Data Processing and Analysis Subsystem (DPAS) . . . 35
DPAS Data Flow . . . 35
B. First-Reduction Datums . . . 37
C. Equivalent Short-Term Datums . . . 39
D. Accuracy . . . 41
6. TIDE AND WATER LEVEL PRODUCTS . . . 43
A. Types . . . 43
B. Historic . . . 43
C. Operational Support to other Programs . . . 44
Physical Oceanographic Real-Time System . . . 44
Tsunami Warning System . . . 44
Storm Surge Warnings . . . 45
D. Internet . . . 45
7. APPLICATIONS OF TIDAL DATUMS . . . 47
Significance of Datums in Modern Applications . . . 47
A. Hydrographic Surveys and Mapping Programs . . . 47
Depths on Nautical Charts . . . 47
Hydrographic Surveys . . . 47
Shoreline Mapping . . . 49
B. Navigation . . . 50
C. Marine Boundaries . . . 52
D. Sea Level . . . 55
E. Coastal Engineering . . . 58
F. Warnings and Hazard Mitigation . . . 58
Tsunamis . . . 58
Storm Surges . . . 59
Emergency Management . . . 62
H. Other Vertical Datums and Their Relationship to Tidal datums . . . 63
Topographic Quadrangle Maps . . . 66
I. Tidal datums and GPS . . . 67
J. Environmental Applications: Wetlands, Marine Sanctuaries, NOAA’s Trust Resources . . . 68
Wetlands . . . 68
Marine Sanctuaries . . . 70
NOAA’s Trust Resources . . . 70
8. REFERENCES . . . 73
9. GLOSSARY . . . 79
APPENDIX A : . . . A1 Table A1. Chronology of Significant Events . . . A3 LIST OF FIGURES . . . viii
LIST OF TABLES . . . x
LIST OF FIGURES
Figure 1. A depiction of the three primary kinds of tides. From the top panel downward they are semidiurnal, mixed, and diurnal. Standard tidal terminology is used to describe the various aspects of the tides. The zero on these graphs is illustrative of the relationship of the tides to mean sea level. . . 5 Figure 2. Characteristic tide curves near port facilities along the U.S. East and Gulf Coasts.
The tides depicted are primarily semidiurnal along the East Coast. The tides at Pensacola are primarily diurnal. The effects of the phases of the moon are also illustrated. The elevations in feet of the tide are referenced to the tidal datum mean lower low water. . . 6 Figure 3. Characteristic tide curves for the West Coast. The tides depicted are primarily
mixed. The tidal range at Anchorage is quite large. The effects of the phases of the moon are also illustrated. The elevations in feet of the tide are referenced to the tidal datum mean lower low water. . . 7 Figure 4. An illustration of solar and lunar tide producing forces. The largest tides, spring
tides, are produced at new moon and full moon. The smallest tides, neap tides, occur during the first and third quarters of the moon. . . 8 Figure 5. A diagram illustrating the regression of the moon’s nodes. . . 9 Figure 6. An illustration of the effect of the regression of the moon’s nodes on the water
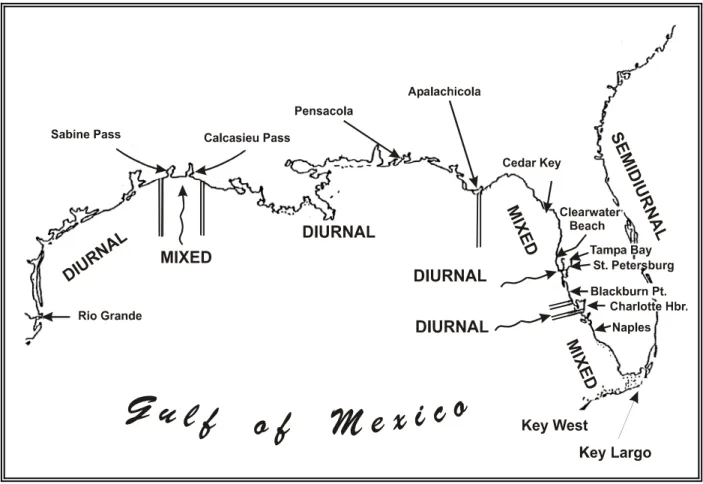
levels at Puget Sound, WA. The heavy black curve is the annual mean range, or the difference in height between mean high water and mean low water. The time elapsed between trough to trough or peak to peak, is the period of oscillation of the regression, and is about 18.6 years. . . 10 Figure 7. An illustration of the spatial variation of the type of tide in the Gulf of Mexico.
. . . 11 Figure 8. An illustration of the principle harmonic constituents of the tides. The periods
and the relative sizes of the constituents are depicted. The bottom panel qualitatively illustrates the result of summing the constituents to reconstruct the astronomical tidal component of water level measurements.. . . 13 Figure 9. Locations of U.S. NWLON tide stations. . . 21 Figure 10. Illustration of NGWLMS station hierarchy. . . . 22 Figure 11. An illustration of the change in tidal characteristics as a function of location in
Chesapeake Bay, MD. . . 24 Figure 12. An illustration of a NOS bench mark and various installation methods. . . 25 Figure 13. An schematic diagram of extending vertical control inland from the tidal datum
by the method of differential leveling. . . 26 Figure 14. A sample of a published bench mark sheet for Port Orient, CA. This sheet
illustrates information pertaining to tidal datums and vertical control. Note that for this station, the tidal datums were computed from a secondary reduction, the control station is indicated, elevations of the datums are relative to MLLW, and five bench marks are associated with this station. . . . 27 Figure 15. A schematic diagram of the main systems associated with NGWLMS. . . 29 Figure 16. A schematic diagram illustrating the design of a standard NGWLMS station. . . 30 Figure 17. An illustration of the principal tidal datums related to a beach profile . . . 40
Figure 18. Applications of tidal datums references to nautical charting . . . 48 Figure 19. Applications of tidal datums to remote sensing for shoreline mapping . . . 50 Figure 20. The marine boundaries allowed under the Law of the Sea Convention. The
landward edge of the Territorial Sea in the U.S. is MLLW. . . 54 Figure 21. Relative sea level change at several locations in the U.S.. . . 55 Figure 22. The change in the values of the principle tidal datums over three epochs at
Seattle, WA. This represents a case where isostatic rebound nearly balances relative sea level rise.. . . 56 Figure 23. The change in the values of the principle tidal datums over three epochs at
Baltimore, MD. This represents a case where subsidence and relative sea level change require re-calculation of the tidal datums for the most recent epoch.. . . 56 Figure 24. Elevated water levels due to the storm surge of tropical storm Gordon. In
comparison to water levels at St. Petersburg, more pronounced effects are evident at Virginia Key. . . 61 Figure 25. Observed, predicted, and storm surge at Charleston, SC during hurricane Hugo.
. . . 61 Figure 26. An illustration of the principal tidal datums and their relationship to the geodetic
datum NGVD 1929 for a typical mixed tide curve . . . 65 Figure 27. Tidal datums and geodetic datums for the St. Johns River. . . 66
LIST OF TABLES
Table 1. Principle harmonic constituents of the tides. . . 12 Table 2. Generalized accuracy of tidal datums for East, Gulf, and West Coasts . . . 41 Table 3. Error in position of marine boundary as a function of the slope of the land. . . 41
LIST OF ACRONYMS
ADR Analog-to-digital recorder
AFOS Automation of Field Operations and Services ATWC Alaska Tsunami Warning Center
AWIPS Advanced Weather Interactive Processing System CBN Cooperative Based Network
CO-OPS Center for Operational Oceanographic Products and Services CORMS Continuous Operational Real-time Monitoring System CORS Continuously Operating Reference Stations
CZM Coastal Zone Management DAC Damage Assessment Center DAD Damage Assessment Division DCP Data Collection Platform DEM Digital Electronic Model
DGPS Differential GPS
DHQ Mean Diurnal High Water Inequality DLQ Mean Diurnal Low Water Inequality DOD Department of Defense
DOE Department of Energy
DPAS Data Processing and Analysis Subsystem of NGWLMS EEZ Exclusive Economic Zone
ECDIS Electronic Chart Display and Information Systems EPA Environmental Protection Agency
ESI Environmental Sensitivity Index
ESSA Environmental Science Services Administration FBN Federal Based Network
FEMA Federal Emergency Management Agency FIRM Flood Insurance Rate Map
FIS Flood Insurance Studies GIF Graphics Interchange Format GIS Geographical Information System
GOES Geostationary Operational Environmental Satellite GPS Global Positioning System
GRS80 Geodetic Reference System 1980 GT Great Diurnal Range of Tide
IGLD 85 International Great Lakes Datum of 1985 IJC International Joint Commission
ITIC International Tsunami Information Center
HAZMAT Hazardous Materials Response and Assessment Division HWI High Water Interval
LAT Lowest Astronomical Tide
LHW Lower High Water
LLW Lower Low Water
LW Low Water
LWD Low Water Datum
LWI Low Water Interval
MHW Mean High Water
MHHW Mean Higher High Water MHHWL Mean Higher High Water Line MHWL Mean High Water Line
MHWS Mean High Water Springs
MLW Mean Low Water
MLLW Mean Lower Low Water MLLWL Mean Lower Low Water Line MLWL Mean Low Water Line MLWS Mean Low Water Springs MMS Minerals Management Service
Mn Mean Range of Tide
MSL Mean Sea Level
MTL Mean Tide Level
NAD27 North American Datum of 1927 NAD83 North American Datum of 1983
NAVD 88 North American Vertical Datum of 1988 NEPA National Environmental Policy Act of 1969
NESDIS National Environmental Satellite, Data and Information Service NFIP National Flood Insurance Program
NGS National Geodetic Survey
NGWLMS Next Generation Water Level Measurement System NGVD 29 National Geodetic Vertical Datum of 1929
NIMA National Imagery and Mapping Agency
NOAA National Oceanic and Atmospheric Administration NOS National Ocean Service
NRC National Research Council
NSRS National Spatial Reference System NTBMS National Tidal Benchmark System NTDE National Tidal Datum Epoch
NWLON National Water Level Observation Network NWLP National Water Level Program
NWS National Weather Service
OAR Office of Oceanic and Atmospheric Research OCRM Office of Ocean and Coastal Resource Management OCS Office of Coast Survey
ORR Office of Response and Restoration
QC Quality Control
PMEL Pacific Marine Environmental Laboratory PORTS Physical Oceanographic Real-Time System
RAM Random Access Memory
RTU Remote Terminal Unit SFHA Special Flood Hazard Areas SOP Standard Operating Procedure USACE U.S. Army Corps of Engineers USC&GS U.S. Coast and Geodetic Survey USCG U.S. Coast Guard
USC U.S. Code
USGS U.S. Geological Survey
UTM Universal Transverse Mercator WGS84 World Geodetic System
1. INTRODUCTION
Purposes of Water Level Observations
Water level measurements are made by the National Oceanic and Atmospheric Administration (NOAA) National Ocean Service’s (NOS) Center for Operational Oceanographic Products and Services (CO-OPS) to serve the needs of the mariner, the engineer, the scientist, and the general public. This work began with the charting of coastal waters and the need to establish a uniform level, or datum plane, to which observed water depths could be referred, the soundings being taken at different water level stages or phases during hydrographic surveys. In addition to satisfying the charting requirements of NOS, water level measurements are made for the following purposes. The list is meant to be illustrative, not exhaustive. Some examples include:
# Real-time depth of water available in harbors, estuaries, and lakes. The mariner uses real-time water levels to estimate draft under keel while in transit.
# Determination mean sea level and other tidal datums for surveying and engineering purposes and to establish a system of tidal bench marks to which these datums can be referred, maintained, and recovered.
# Datum control of remote sensing (i.e. photogrammetry) surveys.
# Representation of the shoreline, defined as Mean High Water (MHW), on nautical charts.
# Datum control for dredging projects and coastal engineering projects.
# Data for production of tide and tidal current predictions.
# Investigation of variations of sea level and crustal movements of the earth.
# Information for special estuarine studies and numerical hydrodynamic models.
# Information for legal cases regarding marine boundaries — Private, State, Federal, and International.
# Data and datum reference for storm surge monitoring.
# Monitoring and datum reference for coastal wetland loss and restoration programs.
Tidal datums derived from water level measurements provide the salient points for baseline determinations of the offshore boundaries of State submerged lands at 3 nautical miles (nm) from Mean Low Water (MLW), the Territorial Sea and Contiguous Zone at 12 nm from Mean lower Low Water (MLLW)(the Territorial Sea and Contiguous Zone are coterminous in the U.S., but not necessarily so for other countries), and the Exclusive Economic Zone (EEZ), at 200 nm from MLLW. Beyond the EEZ lies international waters, often called the High Seas. (NOAA Manual of Tide Observations, 1965; Shalowitz, 1962; Slade et al., 1997; U.S. Dept. Of State Dispatch Supplement, 1995).
The most common boundaries are those defined by geological formations; including such features as mountain ridges, cliffs, rivers, and ocean shores. Geological features have the advantages of being easily recognizable by all parties concerned and are relatively permanent (Hicks, 1980). In recent times, series of artificial markers, parallels of latitude, meridians of longitude, and other lines recoverable by surveying techniques have been added covering the seas. However, these seemingly abstract offshore boundaries have their origins in the most logical of boundaries: the intersection of land and ocean.
Since the oceans (and continents) move up and down in both periodic and non-periodic motions, the location of the land-water intersection line moves up-the-shore-landward and down-the-shore-seaward as a function of time. If this intersection is to be used as a boundary (or the source of a boundary), it must be mathematically “fixed.” The up-down motion of the water surface must also be mathematically fixed to obtain a reference for depths and depth contours on nautical charts and bathymetric maps; and, finally, a reference is needed for elevations of the predicted tide. A mathematically fixed elevation of the ocean surface at a particular phase of the tidal cycle is known as a tidal datum. It is determined by officially adopted definitions and procedures of the National Ocean Service (Hicks, 1980; Federal Register, 1980), and is recognized by the Department of State’s Inter-Agency Task Force on the Law of the Sea (sometimes called the Baselines Committee). For marine applications, a vertical datum is defined as a base elevation used as a reference from which to determine relative heights or depths. It is called a tidal datum when defined by a certain phase of the tide. Tidal datums are local datums and should not be extended into areas which have differing hydrographic characteristics without substantiating measurements (Marmer, 1951). In order that they may be recovered when needed and be linked to land-fixed horizontal and vertical control points (e.g., geodetic datums), such datums are referenced to fixed points known as bench marks. The horizontal location of where a tidal datum intersects the land, at the exact elevation of the tidal datum, is usually called a “mark” or “line.” For example, the horizontal location of the intersection of the tidal datum, MLLW, with land is called the Mean Lower Low Water Line, MLLWL. In legal terminology, this is sometimes called the “ordinary low water mark.” Legal terminology is context specific and needs to be carefully understood before assigning it the value of a particular tidal datum. Indeed, different legal authorities, agencies, and international agreements have different terminology and methodologies associated with tidal datums. One of the goals of this report is to present the standard definitions of tidal datums adopted by NOS.
Report Purpose and Organization
The purpose of this report is to provide a general reference on the subject of tidal datums. This report explains, in brief, many topics — including the history of the NOS tides and water levels program, the domestic and international legal significance of the marine boundaries defined by tidal datums, the modern measurement program designed to support NOS’s statutory authority, and the NOS products produced from the water level data. It also provides a discussion of the applications of tidal datums.
Chapter 2 discusses the general characteristics of the tides used in the determination of tidal datums. Chapter 3 discusses the history of the U.S. tidal program and the legal history and significance of tidal datums, respectively. Chapter 4 concerns a discussion of the National Water Level Program (NWLP), while Chapter 5 discusses the standard NOS analysis methods utilized to determine tidal datums. The output products produced from the NWLP are discussed in Chapter 6, and the applications of tidal datums are covered in Chapter 7. References, and Appendices follow. The publication ends with a glossary of terms appropriate for tidal datums. This companion glossary is an abridged edition of Hicks (1989). The full glossary is available on the internet at http://co-ops.nos.noaa.gov.
2. TIDAL OVERVIEW
Characteristics of the Tides
The word “tides” is a generic term used to define the alternating rise and fall of the oceans with respect to the land, produced by the gravitational attraction of the moon and sun. To a much smaller extent, tides also occur in large lakes, the atmosphere, and within the solid crust of the earth, also caused by the gravitational forces of the moon and sun. Additional non-astronomical factors such as configuration of the coastline, local depth of the water, ocean-floor topography, and other hydrographic and meteorological influences may play an important role in altering the range of tide, the times of arrival of the tides, and the time interval between high and low water. There are three basic types of tides: semidiurnal (semi-daily), mixed, and diurnal (daily).
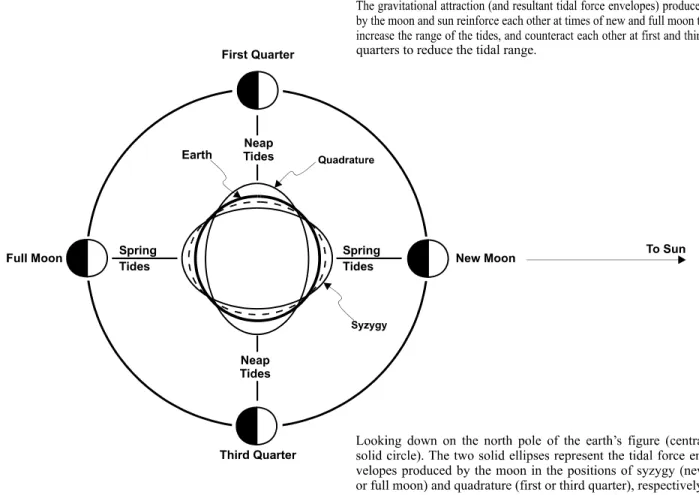
The first type, semidiurnal (Figure 1, top), has two high waters (high tides) and two low waters (low tides) each tidal day. A tidal day is the time of rotation of the Earth with respect to the Moon, and its mean value is approximately equal to 24.84 hours. In Figure 2, semidiurnal tides are illustrated by the marigrams at Boston, New York, Hampton Roads, and Savannah. Qualitatively, the two high waters for each tidal day must be almost equal in height. The two low waters of each tidal day also must be approximately equal in height. The second type, mixed (Figure 1, middle), is similar to the semidiurnal except that the two high waters and the two low waters of each tidal day have marked differences in their heights. When there are differences in the heights of the two high waters, they are designated as higher high water and lower high water; when there are differences in the heights of the two lows, they are designated as higher low water and lower low water. In Figures 2 and 3, mixed-type tides are illustrated by the marigrams at Key West, San Francisco, Seattle, Ketchican, and Dutch Harbor. The third type, diurnal (Figure 1, bottom), has one high water and one low water each tidal day. In Figure 2, the marigram at Pensacola illustrates a diurnal tide. The most important modulations of the tides are those associated with the phases of the moon relative to the sun (Figure 4). Spring tides are tides occurring at the time of the new and full moon. These are the tides of the greatest amplitude, meaning the highest and lowest waters are recorded at these times. Neap tides are tides occurring approximately midway between the time of new and full moon. The neap tidal range is usually 10 to 30 percent less than the mean tidal range. In addition to spring and neap tides, there are lesser, but significant monthly modulations due to the elliptical orbit of the moon about the earth (perigee and apogee) and yearly modulations due to the elliptical orbit the earth about the sun (perihelion and aphelion). Modulations in mixed and diurnal tides are especially sensitive to the monthly north and south declinations of the moon relative to the earth’s equator (tropic tides and equatorial tides) and to the yearly north and south declinations of the sun(equinoxes and solstices).
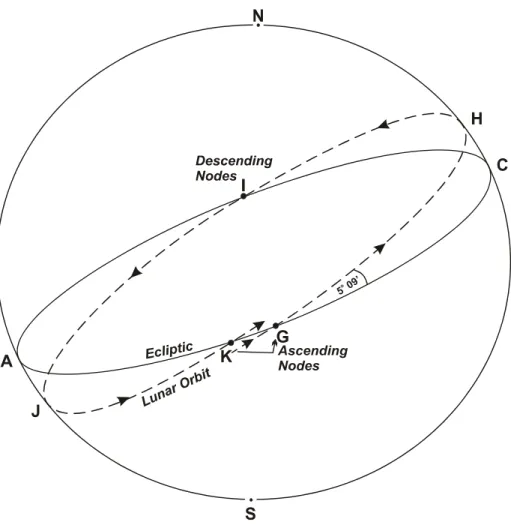
There is another important longer period modulation in the amplitude of the tide due to orbital paths of the earth and moon. The apparent path of the Earth about the Sun, as seen from the Sun, is called the ecliptic. This path may be represented on a globe of the Earth by drawing a great circle about the Earth which makes an angle of 23o 27' relative to the Earth’s equator (Figure 5). Likewise, the apparent path of the moon about the sun may be referenced to the ecliptic, such that the moon’s path about the sun makes an angle of 5o with respect to the ecliptic. When the moon’s ascending node corresponds to the vernal (i.e., spring) equinox (the equinoxes are the two times of the year,
March 21 and September 23, when the sun crosses the earth’s equator, and day and night have the same length), the angle of the path of the moon about the sun is about 28.5o (Schureman, 1941). When the moon’s descending node corresponds to the vernal equinox, the angle of the moon’s path about the sun is about 18.5o . This variation in the path of the moon about the sun has a period of about 18.6 years, and is called the regression of the moon’s nodes. The regression of the nodes introduces an important variation into the amplitude of the annual mean range of the tide, as may be seen in Figure 6. It is the regression of the moon’s nodes which forms the basis of the definition of the National Tidal Datum Epoch (NTDE) (see Chapter 6). Figure 6 also shows the monthly mean range which is due to seasonal and meteorological effects. Because the variability of the monthly mean range is larger than that due to the regression of the nodes, the NTDE is defined as an even 19-year period to obtain closure on a calendar year so as not to bias the estimate of the tidal datum. Although the astronomical influences of the moon and sun upon the earth would seem to imply a uniformity in the tide, the type of tide can vary both with time at a single location (Figures 2 and 3) and in distance along the coast (Figure 7). The transition from one type to another is usually gradual either temporally or spatially, resulting in hybrid or transition tides. A good example in Figure 2 is Galveston which transitions from diurnal to semidiurnal to mixed. Key West (Figure 2) transitions from mixed to semidiurnal to mixed. Dutch Harbor (Figure 3) shows similar transitions. Figure 7 shows the gradual spatial transitions from mixed to diurnal to mixed and back to diurnal. Photocopies of the NOAA pamphlet Our Restless Tides presents a layman’s overview of tide producing forces and tidal observations and is available from CO-OPS.
Figure 1. A depiction of the three primary kinds of tides. From the top panel downward they are semidiurnal, mixed, and diurnal. Standard tidal terminology is used to describe the various aspects of the tides. The zero on these graphs is illustrative of the relationship of the tides to Mean Sea Level (MSL).
Figure 2. Characteristic tide curves near port facilities along the U.S. East and Gulf Coasts. The tides depicted are primarily semidiurnal along the East Coast. The tides at Pensacola are primarily diurnal. The effects of the phases of the moon are also illustrated. The elevations in feet of the tide are referenced to the tidal datum mean lower low water.
Figure 3. Characteristic tide curves for the West Coast. The tides depicted are primarily mixed. The tidal range at Anchorage is relatively large. The effects of the phases of the moon are also illustrated. The elevations in feet of the tide are referenced to the tidal datum, mean lower low water.
Figure 4. An illustration of solar and lunar tide producing forces. The largest tides, spring tides, are produced at new and full moon. The smallest tides, neap tides, occur during the first and third quarters of the moon.
Motion of the moon’s nodes. The points where the moon’s path crosses the ecliptic are called nodes; the point where the moon crosses the ecliptic from south to north at G is called the ascending node, while I is called the descending node.
The moon’s orbit from the ascending node G to the next ascending node K takes
27.2122 mean solar days (the Draconitic Period). Measured relative to a fixed star the moon takes 27.3216 mean solar days to complete its orbit (the Sidereal Period).
The movement of the nodes westwards along the ecliptic is called the regression of the nodes; it is analogous to the precession of the equinoxes along the equator but is much faster, having a period of 18.61 years. This is equivalent to 27.3216-27.2122=0.1094 days per orbit; in the diagram it is represented by the distance KG. Figure 5. A diagram illustrating the regression of the moon’s nodes.
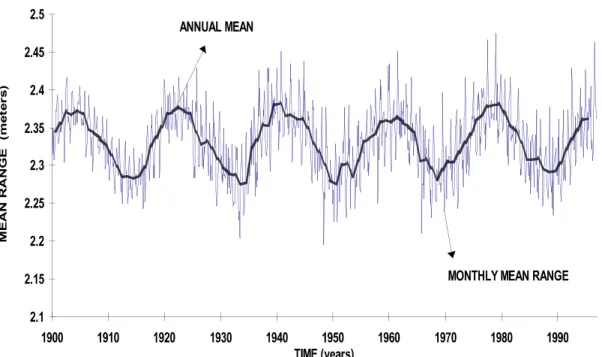
Figure 6. An illustration of the effect of the regression of the moon’s nodes on the water levels at Puget Sound, WA. The heavy black curve is the annual mean range, or the difference in height between mean high water and mean low water. The time elapsed between trough to trough, or peak to peak, is the period of oscillation of the regression, and is about 18.6 years.
Tidal Analysis and Predictions
The routine prediction of tides is based upon a simple principle that for a linear system whose forcing can be decomposed into a sum of harmonic terms of known frequency (or period), the response can also be represented by a sum of harmonics having the same frequencies (or periods) but with different amplitudes and phases from the forcing. The tides are basically such a system (e.g., Schureman, 1941), due to their astronomical cycles imposed by the motions of the earth, sun, and moon. However, the system is not truly linear, and, in making tidal predictions, sums, differences, and harmonics of forcing frequencies are considered to approximately incorporate nonlinear effects (e.g., Schureman, 1941). For the open coastal regions, the tidal prediction capability requires only prior observations of the tides at the location of interest over a suitable period of time from which the amplitudes and phases of the major harmonic constituents can be ascertained by tidal analysis. For tide prediction reference stations, NOS generally uses a minimum one year of hourly water level observations to compute the semi-diurnal and diurnal tidal frequencies and a separate analysis of several years of monthly mean sea levels to compute the solar annual and solar semiannual, Sa and Ssa, terms. Resolving Sa and Ssa may require on the order of 10 years of water level data (Scherer, 1990). Typically, NOS uses up to 37 amplitudes and phases for important periods (period= 1/frequency) required to reconstitute a tidal signal.
Harmonic Constituents
The component tides are usually referred to as harmonic constituents. The principal harmonic constituents of the tide (e.g., Schureman, 1941) are illustrated in Table 1.
Table 1. Principle harmonic constituents of the tides.
Species and name Symbol Period
Solar hours Relative Size Semi-diurnal:
Principal lunar M 2 12.42 100
Principal solar S 2 12.00 47
Larger lunar elliptic N 2 12.66 19
Luni-solar semi-diurnal K 2 11.97 13
Diurnal:
Luni-solar diurnal K 1 23.93 58
Principle lunar diurnal O 1 25.82 42
Principle solar diurnal P 1 24.07 19
Larger lunar elliptic Q 1 26.87 8
Long period:
Lunar fortnightly Mf 327.9 17
Lunar monthly Mm 661.3 9
Solar semi-annual Ssa 4383 8
Solar annual Sa 8766 1
The “relative size” column in Table 1 represents values from equilibrium theory presented by
Schureman (1941) in his Table 2, expressed as a percent of M 2 . Equilibrium theory assumes that the earth is totally water covered and does not consider frictional effects on tidal water motions. It is a simplified method to describe mass tidal characteristics. In addition, Schureman’s Table 14 presents information on the effect of the longitude of the moon’s node. His Table 14 shows that each of the above coefficients are gradually modulated over an 18.6 year cycle, and provides a coefficient which is a function of the year and multiplies the above coefficients to account for the regression of the nodes. The use of the constituents (M, S, N, K) 2, (K,O,P)1, qualitatively illustrated in Figure 8,will generally be sufficient to predict the astronomical tide signal to about 90% at tide stations exposed to open ocean conditions. The difference between the astronomical tide signal and the water level measurements is generally attributable to the effects of local meteorological conditions. However, at different locations different constituents dominate, each site is different, and the relative size values from Table 1 above should not be used indiscriminately.
Figure 8. An illustration of the principle harmonic constituents of the tides. The periods and relative sizes of the constituents from Table 1 are suggested. The bottom panel qualitatively illustrates the result of summing the constituents to reconstruct the astronomical tidal component of water level measurements.
Other Signals in Water Level Measurements
Tides are not the only factor causing the sea surface height to change. Additional factors include waves and wind setup; ocean and river currents; ocean eddies; temperature and salinity of the ocean water; wind; barometric pressure; seiches; and relative sea level change. All of these factors are location dependent, and contribute various amounts to the height of the sea surface. Examples are: wind setup and seiche - up to about 1 meter (~3.2 feet); ocean eddies - up to about 25 centimeters (~0.8 foot); upper ocean water temperature - up to about 35 centimeters (~1.1 foot); ocean currents or ocean circulation - about 1 meter; and global sea level rise (about 0.3 meter (1 foot) per century).
Oceanographers, when determining tidal datums, use averaging techniques over a specific time period, the tidal epoch of 19 years. As mentioned, 19 years is used because it is the closest full year to the 18.6-year node cycle, the period required for the regression of the moon’s nodes to complete a circuit of 360/ of longitude (Schureman, 1941). Referring to Figure 1, the average of all the observed higher high waters over a specific 19 year period (i.e., a NDTE) is defined as the tidal datum mean higher high water(MHHW). As suggested in Figure 1, MHHW will have a specific height, which is not necessarily equal to any higher high water observed during a given tidal day. The averaging technique defines a reference plane from which all the fluctuations in the sea level discussed here, except for global sea level change, have been removed. Thus, the policy of NOS is to consider a new tidal datum epoch every 20 to 25 years to appropriately update the tidal datums to account for the global sea level change and long-term vertical adjustment of the local landmass (e.g., due to subsidence or glacial rebound).
3. TIDAL DATUMS
A. Chronology from the 1800s to the Present
The NOS has had many names in the past. The organization was known as: The Survey of the Coast from its founding in 1807 to 1836, Coast Survey from 1836 to 1878, Coast and Geodetic Survey (USC&GS) from 1878 to 1970, National Ocean Survey from 1970 to 1982, and in 1982, it was named National Ocean Service. From 1965 to 1970, the Coast and Geodetic Survey was a component of the Environmental Science Services Administration (ESSA). The NOS is a component of the NOAA which became the successor to ESSA in 1970. The NOAA is a component of the U.S. Department of Commerce. See Appendix A, Table A1 for a detailed chronology of the significant events in the development of the products and instrumentation related to the analysis of tides and tidal datums by the NOS.
B. Legal History of Tidal Datums
Congress has conferred statutory responsibility to NOS. Congress legislated the task to survey the coast of the U.S. to predecessor agencies of NOS with subsequent legislation defining missions and responsibilities.
Other Federal agencies, such as the Department of Energy (DOE), the Environmental Protection Agency (EPA), the U.S. Army Corps of Engineers (USACE), the Department of the Interior’s Minerals Management Service (MMS) and the Geological Survey (USGS), and NOAA’s National Weather Service (NWS), recognize NOS’ expertise in the computation of tidal datums and currently have or have had cooperative agreements with NOS to provide tidal datums. USACE and USGS also operate extensive water level observation networks, however, these agencies rely on NOS’ expertise in tidal areas.
The pertinent legislation and statutory authority of NOS have evolved under these following key federal statutes in determining the federal role in regulatory, jurisdiction, and management functions in the coastal zone (U.S. Department of Commerce Year of the Ocean Discussion Papers, 1998). The Supreme Court rules on admiralty law cases in Territorial Seas, and also provides rulings on riparian rights, navigability, and the public trust doctrine. The Supreme Court has clarified legal terminology such as ordinary mean high water to have a precise scientific definition as a tidal datum (Slade et al., 1997). In addition, key federal authorities, treaties, and international agreements are summarized below (Shalowitz, 1962, Graber, 1981; U.S. Department of State Dispatch Supplement, 1995; Slade et al., 1997; U.S. Department of Commerce Year of the Ocean Discussion Papers, 1998).
C. Congressional Acts
Laws Relating to NOS Organic Authority
The following is a brief listing of laws which relate to NOS organic authority to measure tidal datums. The list is selective and is not intended to be comprehensive.
This act covered the founding of the Survey of the Coasts, in order “to cause a survey to be taken of the coast . . . for completing an accurate chart of every part of the coasts.”
# Appropriations Act of 1841
This act included a “hydrographical survey of the northern and northwestern lakes. . . . ,” now known as the Great Lakes.
# Coast and Geodetic Survey Act, as amended, 33 U.S.C. §§ 883 a-k
NOS is statutorily authorized, among other things, to collect, analyze and disseminate data on tides and water levels pursuant to 33 U.S.C. This act established the following NOS statutory authority :
33 U.S.C. 883a - Authorizes NOS to conduct hydrographic surveys; tide and current observations; and geomagnetic, seismological, gravity, and related geophysical measurements and investigations, and observations for the determination of latitude and longitude.
33 U.S.C. 883b - In order that full public benefit may be derived from the operations of NOS by the dissemination of data resulting from its authorized activities and of related data from other sources, Section 883b authorizes NOS to analyze and predict tide and current data; and process and publish data, information, compilations, and reports.
33 USC 883d - Authorizes NOS to conduct investigations and research in geophysical sciences, including oceanography, geodesy, seismology, and geomagnetism, to improve the efficiency of NOS and to increase engineering and scientific knowledge.
33 U.S.C. 883e - Authorizes NOS to enter into agreements with states for surveying and mapping.
# Under the Submerged Lands Act of 1953 (43 U.S.C. §§ 1301 et seq.)
Establishes title of the states to land beneath navigable waters up to but not above the line of Mean High Water and a distance seaward from the coast line of three nautical miles.
# Outer Continental Shelf Lands Act of 1953 (43 U.S.C. §§ 1331 et seq.)
To provide for the jurisdiction of the U.S. over submerged lands of the outer continental shelf. This act provides that the Secretary of the Interior shall administer the leases of mineral rights on the outer continental shelf.
# Act of April 5, 1960 (74 Stat. 16)
Amends Act of August 6, 1947 to remove geographical limitations on the activities of the Coast and Geodetic Survey, the predecessor organization to NOS.
Title III - NOAA Hydrographic Services Improvement Act of 1998 most recently addresses NOAA’s role in acquiring tide and current observations in the context of providing hydrographic services to the nation and specifically authorizes appropriations: “is authorized for each fiscal year to implement and operate a national quality control system for real-time tide and current and maintain the national tide network, and . . . is authorized for each fiscal year to design and install real-time tide and current data measurement systems under Section 303(b)(4).”
Laws Relating to Present Regulatory Context
The following laws are important in the present regulatory context in which tidal datums control the jurisdiction of the act. The list is not intended to be comprehensive.
# Rivers and Harbors Act of 1899 (33 U.S.C. §§ 401 et seq.)
In the navigable waters of the U.S., coastal construction, excavation, and filling must be proceeded by a permit from the U.S. Army Corps of Engineers. The act also prohibits the dumping of garbage and other substances into navigable waters.
# Bridges over Navigable Waters (33 U.S.C. §§ 491 - 535)
Bridges, dams, dikes or other forms of coastal construction are not allowed to interfere with navigable waters, except by permission from the Commandant of the Coast Guard.
# Suits in Admiralty Act of 1920 (46 U.S.C. §§741-752)
Under this act, the maritime public can sue the government for damages if negligence occurred during the preparation of charts and tables.
# National Environmental Policy Act of 1969 (NEPA)
This act is administered by the Environmental Protection Agency (EPA). This statute requires an environmental impact statement to be developed for “major Federal actions significantly affecting the quality of the human environment.” The statements are to cover “(i) the environmental impact of the proposed action, (ii) any adverse environmental effects which cannot be avoided should the proposal be implemented, and (iii) alternatives to the proposed action . . . ”
# Ports and Waterways Safety Act of 1972, as amended, (33 U.S.C. §§ 1221-1236)
This act grants the Coast Guard regulatory authority over the movements of ships in hazardous areas or with hazardous cargoes, or in cases where adverse weather, poor visibility, and heavy vessel traffic affect the safety of operations. It also directs the Secretary of Transportation regulatory authority over ship design and maintenance for the purpose of protecting the marine environment.
# Federal Water Pollution Control Act Amendments of 1972 (33 U.S.C. §§ 1251 et seq.)
This act authorized the USACE to control the discharge of dredged materials in the coastal ocean. It prohibits the discharge of pollutants in either onshore or offshore vessels or facilities. It applies to the territorial sea and contiguous zone.
This act requires that a permit be issued prior to the dumping of any material in the territorial sea or contiguous zone. Depending upon the type of material, permits are either obtained from the Secretary of the Army or the Environmental Protection Agency.
# Coastal Zone Management Act of 1972 (16 U.S.C. §§ 1451 et seq.)
Under this act, states are given an incentive to develop Coastal Zone Management Programs. The Office of Coastal Zone Management within NOAA administers the act. The act requires that policy be established on energy facilities, shoreline erosion, and beach access. In addition, the act specifies that states must catalog the coastal zones to be managed under the act, inventory the natural resources in these areas, and designate priorities for land and water use, and it places control on water use.
# Deepwater Port Act of 1974 (33 U.S.C. §§ 1501 et seq.)
A deepwater port is defined as “any fixed or floating manmade structures other than a vessel...located beyond the territorial sea of the U.S. and off the coast of the United States and which are used or intended for use as a port or terminal for loading or unloading and further handling of oil for transportation to any State...” The act prohibits the discharge of oil from a vessel within a safety zone established around a deepwater port, from a vessel that has received oil from another vessel at a deepwater port, or from a deepwater port. It imposes penalties and liability for violations.
# Magnuson-Stevens Fisheries Conservation and Management Act of 1976 (16 U.S.C. §§ 1801-1883)
Establishes a fisheries conservation zone (200 nautical miles) within which the United States assumes exclusive fisheries management authority. Measured from the low water line on largest scale chart. The law provides that fishing by a non-US vessel will not be authorized within the fishery conservation zone or for anadromous species or continental shelf fishery resources beyond that zone except under international fishery agreements and permits.
# National Marine Sanctuaries Act (16 U.S.C. §§ 1431 et seq.)
The Act establishes that the Secretary of Commerce may designate nationally significant areas as national marine sanctuaries. The national areas are selected on the basis of protection of national marine resources and habitats, scientific research and education of the public, tourism, and commercial and recreational fishing.
D. Supreme Court Decisions
The Supreme Court has shaped the legal context of the marine environment by its many decisions on navigable waters, marine boundaries, and the public trust doctrine. One of the most important decisions occurred in the 1936 case of Borax, Ltd v. City of Los Angeles (Slade et al., 1997). In this case, the Supreme Court recognized the importance of the averaging of all the high tides during the 19-year tidal datum epoch when determining the mean high tide line. Hence, the primary or first reduction datums computed by NOS must be computed for a specific 19-year lunar epoch. Similarly, the other principal tidal datums described later in this report must all be calculated over the specific tidal epoch.
E. National Agreement
National Tidal Datum Convention of 1980
The National Tidal Datum Convention of 1980 (Federal Register, 1980; Hicks, 1980), among other things, established a uniform system of tidal datums for all tidal waters in the U.S., its territories and trusts; and authorized the NOS definitions of mean high water, mean higher high water, mean low water, and mean lower low water as the official policy of the U.S. Government.
F. International Agreements Boundary Waters Treaty of 1909
This act established the International Joint Commission (IJC) to manage and control the Great Lakes.
Convention on the Continental Shelf
In this convention, the phrase “continental shelf” is defined as “the seabed and subsoil of the submarine areas adjacent to the coast but outside the area of the territorial sea, to a depth of 200m, or, beyond that limit, to where the depth of the superjacent waters admits of the exploitation of the natural resources of the said areas, to the seabed and subsoil of similar submarine areas adjacent to the coasts of islands.”
The convention gives the coastal nation exclusive sovereign rights over the continental shelf, subject to certain provisions to protect navigation, fishing and the conservation of living resources of the sea, “for the purpose of exploring it and exploiting its natural resources.”
Convention on the Territorial Sea and the Contiguous Zone
This convention was adopted by the United Nations conference at Geneva 1958, establishing the sovereignty of the state beyond its land territory and internal waters “the normal baseline for measuring the breadth of the territorial sea is the low water line.” The low water line according to U.S. policy is equivalent to the intersection of the tidal datum mean low water (MLW) with the coast (U.S. Department of State Dispatch, 1995). However, the Department of State’s term “mean low water” refers to the NOS term Mean Lower Low Water. These conventions which are a part of the larger United Nations Law of the Sea Convention (U.S. Department of State Dispatch, 1995), will increasingly be relied upon as a legal framework for international treaties which concern
sovereignty, rights of passage and anchorage, seabed mining and exploration, fisheries management and conservation, and scientific research and exploration.
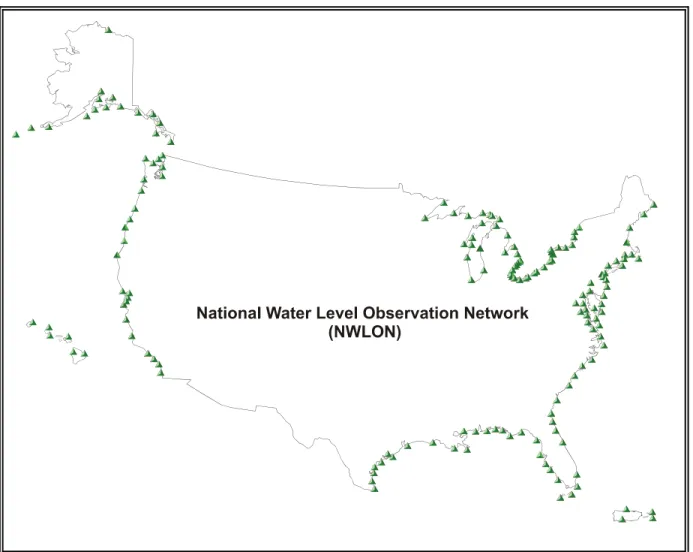
Figure 9. Locations of U.S. NWLON tide stations.
4. THE NATIONAL WATER LEVEL PROGRAM STANDARDS AND PROCEDURES A. Water Level Stations
The NWLP provides unique water level and ancillary data sets and information to users in support of a wide variety of critical activities. A priority of the NWLP is to provide the basic data for the vertical, tidal datum control for the nation. The instrumentation of the NWLP consists of tide stations in a network called the National Water Level Observation Network (NWLON) and any short-term stations operating for special projects such as hydrographic surveys, photogrammetry, and USACE dredging activities. The NWLON is composed (as of 2000) of approximately 189 long-term stations distributed around the country and the world. Due to resource constraints and storm damage, not all stations are always operational. Alaska has 16 stations; Hawaii and Pacific Islands have 12 stations; the West Coast has 26 stations; the Gulf Coast and Caribbean have 31 stations; the East Coast has 55 stations; the Great Lakes have 49 stations (Figure 9).
Figure 10. Illustration of tide station hierarchy.
The programs supported by the NWLON include: real-time navigation safety, nautical charting, hydrography, photogrammetry, boundary determination, navigation products, channel dredging and harbor improvements, tsunami and storm surge warnings, tide predictions, environmental monitoring, global climate change, international lake level regulation, international treaty compliance, and international datum determination.
Additionally, the water level and geophysical data collected at these sites are frequently used to study the coastal environment, perform scientific studies of the dynamics of sea-level, and validate models of the geoid, tides, circulation, and satellite altimeter derived sea-surface height fields.
The locations of tide stations are organized into a hierarchy (Figure 10). Control (or primary) tide stations provide a continuously operating nationwide coarse network which is supplemented by denser networks of short-term operating secondary and tertiary networks necessary to provide total tidal datum coverage.
Primary tide stations are generally those which have been operated for 19 or more years, are expected to continuously operate in the future, and are used to obtain a continuous record of the water levels in a locality. As the records from such a station constitute basic water level data for present and future use, the aim is to install and maintain the stations to obtain the highest degree of reliability and precision that is practical. This justifies detailed planning and site selection. The essential equipment of a control tide station includes an automatic water level sensor, protective well or sump well (as for Great Lakes stations), shelter, back-up water level sensor, ancillary geophysical instruments, and a system of bench marks.
Secondary water level stations are those which are operated for less than 19 years but for at least 1 year, and have a planned finite lifetime. Secondary tide stations are established for the purpose of obtaining general tidal information for a locality and also to obtain specific data for the reduction of soundings in connection with hydrographic surveys. Secondary stations also provide control in bays and estuaries where localized effects are not realized at the nearest control station. Observations at a secondary station are not usually sufficient for a precise independent determination of tidal datum, but when reduced by comparison with simultaneous observations at a suitable control tide station, very satisfactory results may be obtained.
Tertiary water level stations are those which are operated for more than a month but less than 1 year. Short-term water level measurement stations (secondary, tertiary, and seasonal) may have their data reduced to equivalent 19 year means through mathematical simultaneous comparison with a nearby control station. Short-term data, often at several locations, are collected routinely to support hydrographic surveying. In the Great Lakes, seasonal data are simultaneously compared to adjacent stations for datum determination in harbors.
The site selection criteria for tide stations include geographical and time-varying knowledge of the changes in Mean Tide Level (MTL) or MSL, changes in Mean Range of tide (Mn), and changes in time of tide. Additional factors are coverage of critical navigation areas and transitional zones, historical sites, proximity to the geodetic network, and the availability of existing structures, such as piers suitable for the location of the scientific equipment. Figure 11 is an example of the coverage of Chesapeake Bay, MD, where the tidal characteristics change rapidly. A control water level station is sited to provide datum control for national applications, and are sited in as many places as needed for datum control.
Site reconnaissance is performed prior to the installation of a new station. Field site visits are done to aid in the design, make measurements, and render technical drawings; to recover bench marks and/or plan for new bench marks; and to obtain permission, permits, agreements, etc. The field parties take into consideration the requirements for the installation and protection of the instruments. The most important considerations are the presence of a suitable structure, the necessary bench mark locations, adequate water depth, special materials that might be needed to prevent marine fouling and/or corrosion, availability of telephone and electrical service, site security, and lightening protection.
Figure 11. An illustration of the change in tidal characteristics as a function of location in Chesapeake Bay, MD.
B. Bench Marks and Differential Leveling
A bench mark is a fixed physical object or mark used as a reference for a vertical datum (Figure 12). A tidal bench mark is a mark near a tide station to which the tidal datums are referenced. A network of bench marks is an integral part of every water level measurement station. Since gauge measurements are related to the bench marks, it follows that the overall quality of datums is dependent on both the quality of the bench mark installation and the quality of the leveling between the bench marks and the gauge.
Bench marks have site selection considerations much like the tide stations they support. The first consideration is longevity; bench marks are sited to minimize susceptibility to damage or destruction. Bench marks are sited to ease future recovery (locating and leveling to the mark) and to ensure accessibility (open, overhead clearance). Bench marks must also be placed in the most stable structure for the locality. Preference should be given to disks set in bedrock, in large man-made structures with deep foundations, or set atop stainless steel rods driven to substantial resistance.
Figure 13. A schematic diagram of extending vertical control inland from the tidal datum by the method of differential leveling.
Since bench marks are vulnerable to natural disturbances, such as geologic and soil activity, in addition to damage inflicted by man, more bench marks are installed around stations with longer term data series. At primary control stations, where 19 years of observations have been conducted or are planned, a network of 10 bench marks is installed in the vicinity of the station. Five bench marks are installed at secondary (1 year to less than 19 years) and tertiary (30 days to less than 1 year) stations. At least 3 bench marks are installed at short-term (less than 30 days) stations.
Differential levels (Figure 13) are used to check the elevation differences between bench marks, to extend vertical control, and to monitor the stability of the water level measurement gauge. The quality of leveling is a function of the procedures used, the sensitivity of the leveling instruments, the precision and accuracy of the rod, the attention given by surveyors, and the refinement of the computations.
The User’s Guide for the Installation of Bench Marks and Leveling Requirements for Water Level Stations (Hicks et al., 1987) provides detailed guidelines for bench mark installations and leveling. The Standards and Specifications for Geodetic Control Surveys includes interim Federal Geodetic Control Subcommittee specifications and procedures to incorporate electronic digital/barcode levels.
The National Tidal Benchmark System (NTBMS) provides datum information for previously and currently occupied tidal measurement locations. The number of stations in the NTBMS is approximately 6000. There are approximately 3000 along the U.S. East Coast, 500 installed on the Gulf Coast, 1000 along the West Coast, 1200 in Alaska, 150 in the Pacific Islands, and 177 around
the Great Lakes. Bench mark elevations may become invalid due to vertical movement of the structure or substrate or movement due to local construction. The established elevation of bench marks relative to tidal datums may also be invalidated by changes in local tidal characteristics due to dredging, erosion, and accretion. In many cases, bench marks in the NTBMS have not been releveled in many years, resulting in some uncertainty in their validity. At present, about 2000 stations have published values for bench mark elevations. An example of the bench mark elevation portion of a published bench mark sheet is shown in Figure 14.
PUBLICATION DATE: 11/02/1999 Page 5 ALASKA 945 5760
NIKISKI, COOK INLET
Tidal datums at NIKISKI, COOK INLET are based on the following:
LENGTH OF SERIES = 2 YEARS
TIME PERIOD = January 1997 - December 1998
TIDAL EPOCH = 1960-1978
CONTROL TIDE STATION = SELDOVIA, COOK INLET (945 5500)
Elevations of tidal datums referred to mean lower low water (MLLW) are as follows:
HIGHEST OBSERVED WATER LEVEL (12/26/1976) = 8.513 METERS
MEAN HIGHER HIGH WATER (MHHW) = 6.239 METERS
MEAN HIGH WATER (MHW) = 6.026 METERS
MEAN SEA LEVEL (MSL) = 3.427 METERS
MEAN TIDE LEVEL (MTL) = 3.330 METERS
*NORTH AMERICAN VERTICAL DATUM-1988 (NAVD) = 2.088 METERS
MEAN LOW WATER (MLW) = 0.634 METERS
MEAN LOWER LOW WATER (MLLW) = 0.000 METERS
LOWEST OBSERVED WATER LEVEL (01/29/1979) = -1.545 METERS Bench mark elevation information:
ELEVATION IN METERS ABOVE:
BENCH MARK STAMP/DESIGNATION MLLW MHW
5760 K 1978 12.583 6.557
5760 L 1983 12.695 6.669
5760 M 1983 13.049 7.023
5760 N 1983 26.212 20.186
NIK 1964 11.090 5.064
NIKISKI 2 15.574 9.548
NIKISKI 3 34.642 28.616
NO 7 1973 35.746 29.720
NO 8 1973 33.451 27.425
NO 9 1973 35.736 29.710
PUBLICATION DATE: 05/21/1996 Page 3 of 5
Figure14. A sample of a page from a published bench mark sheet for Nikiski, AK. This page illustrates information pertaining to tidal datums and vertical control. Note that for this station, the tidal datums were computed from a secondary reduction, the control station is indicated, and elevations of the tidal datums are relative to MLLW.
Bench marks are leveled by either a compensator leveling instrument or by an electronic digital/barcode system. Compensator-type leveling instruments require double running. However, under certain circumstances, electronic digital/barcode systems allow for single running. Bench marks are leveled whenever a new tide station is established or when data collection is discontinued at a tide station. Bench marks are also leveled before and after maintenance is performed at a station, and at least annually to perform stability checks. In addition, whenever new bench marks are installed, the existing bench marks are re-leveled.
The Global Positioning System (GPS) is emerging as a global vertical measurement system (Milbert, 1995). The NOS National Geodetic Survey (NGS) is implementing GPS into operations and is developing a nationwide Continuously Operating Reference System (CORS). GPS is being used to measure vertical crustal motion at water level stations at certain test sites. Differential GPS connection of bench marks (i.e., determination of ellipsoidal height of bench marks) enables the seamless integration of tidal datums with geodetic heights measured by GPS (e.g., DeLoach, 1995; Wells et al., 1996; Defense Hydrographic Initiative, 1996). Presently, work is underway to investigate using GPS to minimize the number of bench marks at each station, to provide tidal datums relative to the ellipsoid to facilitate standardization with a future “global” datum, and to better assess localized land movement as opposed to bench mark instability. These efforts will also facilitate understanding of the slopes or differences between tidal datums in different locations. NOS is also investigating the use of Real-Time Kinematic (RTK) GPS in hydrographic surveying, assuming that the relationship between Chart Datum (MLLW) and the ellipsoid is known.
C. Collection of Observations
Due to physical and environmental complexities, including spatial and temporal variability and severe environments in coastal zones, sophisticated instruments are necessary to measure instantaneous water levels, tides, storm surges, tsunamis, and long-term sea level trends. These instrument suites must be very accurate and reliable.
In past years, water levels were measured using float and wire sensors housed in stilling wells, first with analog strip chart mechanical gauges and later with punched-paper-tape to analog digital recorder (ADR) conventional tide gauges (e.g., Schureman, 1941). Tide observers and tide staffs were used to connect the measurements to the local bench mark networks. This technology was suitable for most traditional monitoring requirements for surveying and mapping, however present instrumentation and computer technologies used by NOS enable more accurate, flexible, and automated tide gauge systems to be applied towards eliminating the sources of uncertainty in measurement that the older systems exhibited and towards the emerging programmatic real-time automated needs of NOAA programs (NRC, 1986). A more accurate system of measurement also supports the requirement of the long term measurements to estimate relative sea level trends with amplitudes of a few millimeters.
Figure 15. A schematic diagram of the main systems associated with NGWLMS.
The NWLON Station and Its Equipment
Present water level stations use modern sensor technology (NRC, 1986), improved instruments, digital recording, satellite communication, modern database programming and management techniques, and additional geophysical instruments (Figure 15). Many stations also measure wind speed and direction, barometric pressure, air and water temperature. These are used to interpret the sea level records, perform scientific analyses of the natural phenomena in the coastal zone, and when disseminated to mariners through the Physical Oceanographic Real-Time Systems (PORTSTM), provide real-time environmental conditions suitable for navigational decision making (NRC, 1986; 1996).
The system that accomplishes these tasks is known as the Next Generation Water Level Measurement System (NGWLMS). The NGWLMS equipment was developed by NOS to modernize the NWLON (e.g., Scherer, 1986; Mero and Stoney, 1988). A NGWLMS is a stand alone system that acquires, stores and transmits water level, weather and other data from the field unit (Edwing, 1991). The main requirement for the unit is to accurately measure water level information with low power consumption, high reliability, and defined accuracy. The goal is to monitor waters levels with an accuracy of better than 1.0 cm, as the present global estimate of sea level rise is 0.15 cm per year. Considering all the variability in water level measurements, resulting from the contributions noted earlier, this level of accuracy presents a challenge for instrumentation
Figure 16. A schematic diagram illustrating the design of a standard NGWLMS.
and research. The NGWLMS water level sensors have an accuracy of about 1.0 cm for each sample (Schultz, et al., 1998).
Instruments
The NGWLMS field unit is a fully automated, data acquisition and transmission system. It was developed and procured from off the shelf components in the mid-1980s, and underwent extensive evaluation prior to delivering data from which operational products are calculated. In addition, the internal firmware and some of the internal modules of the field unit have received periodic upgrades to maintain or enhance capabilities.
The data collection platform (DCP) (Figure 16) consists of a Sutron 9000 Remote Terminal Unit (RTU). This is a modular unit that contains power supply, communications controller, Geostationary Operational Environmental Satellite (GOES) satellite transmitter, central processor unit, memory expansion module, telephone modem, general purpose Input/Output (I/O) module, and an Aquatrak water level sensor controller manufactured by Bartex. The unit receives data from the sensors which measure the water level and geophysical parameters (Edwing, 1991). This measurement sub-system accommodates up to eleven additional instrument channels. The field unit is fully automated for remote installations. The unit’s design and satellite data transmission streamlines the digital data relay and processing.
The NGWLMS field unit is a multi-tasking, programmable computer. The unit is fully automated, password protected, and is easily sited. The Sutron 9000 accommodates two water level