IZA DP No. 3491
Would a Legal Minimum Wage Reduce Poverty?
A Microsimulation Study for Germany
Kai-Uwe Müller Viktor Steiner
DISCUSSION P
APER SERIES
Forschungsinstitut zur Zukunft der Arbeit Institute for the Study of Labor
Would a Legal Minimum Wage
Reduce Poverty?
A Microsimulation Study for Germany
Kai-Uwe Müller
DIW Berlin
Viktor Steiner
Free University of Berlin, DIW Berlin and IZA
Discussion Paper No. 3491
May 2008
IZA P.O. Box 7240
53072 Bonn Germany Phone: +49-228-3894-0 Fax: +49-228-3894-180
E-mail: iza@iza.org
Anyopinions expressed here are those of the author(s) and not those of IZA. Research published in this series may include views on policy, but the institute itself takes no institutional policy positions. The Institute for the Study of Labor (IZA) in Bonn is a local and virtual international research center and a place of communication between science, politics and business. IZA is an independent nonprofit organization supported by Deutsche Post World Net. The center is associated with the University of Bonn and offers a stimulating research environment through its international network, workshops and conferences, data service, project support, research visits and doctoral program. IZA engages in (i) original and internationally competitive research in all fields of labor economics, (ii) development of policy concepts, and (iii) dissemination of research results and concepts to the interested public. IZA Discussion Papers often represent preliminary work and are circulated to encourage discussion. Citation of such a paper should account for its provisional character. A revised version may be available directly from the author.
IZA Discussion Paper No. 3491 May 2008
ABSTRACT
Would a Legal Minimum Wage Reduce Poverty?
A Microsimulation Study for Germany
*In view of rising wage inequality and increasing poverty, the introduction of a legal minimum wage has recently become an important policy issue in Germany. We analyze the distributional effects of the introduction of a nationwide legal minimum wage of € 7.5 per hour on the basis of a microsimulation model which accounts for the complex interactions between individual wages, the tax-benefit system and net household incomes. Simulation results show that the minimum wage would be rather ineffective in reducing poverty, even if it led to a substantial increase in hourly wages at the bottom of the wage distribution and had no negative employment effects. The ineffectiveness of a minimum wage in Germany is mainly due to the existing system of means-tested income support.
JEL Classification: I32, H31, J32
Keywords: minimum wage, wage distribution, working poor, poverty reduction, micro-simulation
Corresponding author: Viktor Steiner
DIW Berlin Mohrenstraße 58 10117 Berlin Germany
E-mail: vsteiner@diw.de
*
Financial support by the German Science Foundation under project STE 681/5-2 is gratefully acknowledged. We thank Johannes Geyer for providing some of the data used in this study, Anthony
1
Introduction
Germany is one of the few OECD countries where no general legal minimum wage currently exists (see Immervoll, 2007). However, in view of rising wage inequality and increasing poverty, the in-troduction of a legal minimum wage has recently become an important policy issue in Germany. One argument for the introduction of a legal minimum wage view is that the existing wage bargain-ing system no longer prevents “excessive” downward wage flexibility. This is said to be related to the significant decline of union coverage in the economy and an expanding low wage sector partly as a result of recent labor market reforms in Germany. In this view, a minimum wage prevents “un-fair” competition as a result of wage subsidies aimed at increasing employment in the low-wage sector. Another argument is that earnings of anyone working full-time should be sufficient to cover at least the means-tested social minimum. In this view, a minimum wage is a means to prevent pov-erty among the working poor, which can only be achieved by a statutory nationwide minimum wage. Proponents of this approach, including the governing Social Democratic Party and the un-ions, have suggested a legal minimum wage of 7.5 € per hour. It is this latter view on which we focus in this paper. In particular, we will investigate whether the suggested legal minimum wage would achieve the stated goal to reduce the degree and depth of poverty among the working popula-tion.
Whereas the extensive literature on the economic effects of minimum wages primarily fo-cuses on their wage and employment effects (see, e.g., Brown, 1999; Neumark and Wascher, 2007), there has been comparatively little research on the important policy question to what extent mini-mum wages affect the income distribution at the household level and may thus serve as a policy instrument to reduce poverty.1 This literature, which mostly deals with the U.S., has shown that only a small fraction of poor families includes workers that are employed at the minimum. Those households often do not work at all or have only a single wage earner with the spouse caring for children. Therefore, a change of minimum wages is only weakly or not at all related to household income and has no significant effect on the reduction of poverty. In order to comprehensively ana-lyze the potential income effects of minimum wages, the composition of households and the inter-play of minimum wages and the tax-benefit system have to be taken into account.
For Germany, there are hitherto only a few explorative studies on the potential effects of a statutory minimum wage on the wage and income distribution. On the basis of data from the Ger-man Socioeconomic Panel (SOEP), DIW (2006) documents that in West GerGer-many very low wages
1
This literature includes Johnson and Browning (1983), Burkhauser et al. (1996), Burkhauser and Sabia (2005), Bluestone and Ghilarducci (1996), MaCurdy and McIntyre (2001); Neumark and Wascher (1997, 2000), Neumark (2008) for the US; Goldberg and Green (1999) for Canada; Gosling (1996) and Sutherland (2001) for the UK. OECD (1998) and Brown (1999) summarize the older literature.
are concentrated among “marginally” employed persons working small hours in jobs exempted for social security contributions (“mini jobs”), whereas in East Germany low-wage jobs are also com-mon acom-mong regularly employed people. It is also shown that minimum wages would disproportion-ately affect employees working in small firms and certain sectors of the economy, in particular agri-culture and services. Moreover, the relationship between lower wages and low incomes is found to be rather weak since low wages contribute only a relatively small share to household incomes. Bosch and Weinkopf (2006) report similar results for full-time employed people on the basis of administrative employment register data. Using SOEP data for 2004, Kalina and Weinkopf (2007) show that about 14 % of all dependent employed persons would have received a hypothetical mini-mum wage of 7.50 € in Germany, with higher shares among unskilled workers, women, youth, and people in “marginal” employment. Similar results are also reported by Ragnitz and Thum (2007) who use individual wage data from the Earnings Survey for Germany from the year 2001.
The focus of our paper is on the effects of the introduction of a nationwide minimum wage of 7.5 € per hour on the wage distribution, household incomes and on poverty. In a first step, it is shown how a minimum wage in the suggested amount would affect the distribution of hourly wages abstracting from behavioral responses this policy change may induce. To move from changes in hourly wages to changes in net household incomes, we apply a microsimulation model based on the German Socioeconomic Panel. This model accounts for the complexity of the German tax-benefits system, in particular various means-tested income-support schemes, exemptions of very low earn-ings from social security contributions, and the joint income taxation of married couples which im-pose relatively high marginal tax rates on secondary earners. Simulation results show that the pro-posed minimum wage would have little impact on the overall distribution of net household incomes as well as the incidence and depth of poverty among households with at least one low-wage worker, even if it led to a substantial increase in hourly wages at the bottom of the wage distribution and had no negative employment effects. To a large extent, the ineffectiveness of a minimum wage to in-crease net household incomes of the working poor to raise them above the poverty line and to re-duce the depth of poverty in the poor population can be explained by the system of means-tested income support already existing in Germany.
In the next section, we provide the reader with some relevant information on the evolution of the low-wage sector as well as the relationship between low wages, means-tested income support and household incomes in Germany. Section 3 describes our methodological approach to estimate minimum wage effects on poverty. Simulation results on the effects of the introduction of a mini-mum wage on hourly wages, net household income and poverty are presented and discussed in Sec-tion 4. SecSec-tion 5 summarizes our main results and concludes.
2
Wage Inequality, Poverty, and the Minimum Wage Debate in Germany
Policy proposals to introduce a legal minimum wage in Germany are often made with reference to the alleged increase in poverty among the working poor associated with an expanding low-wage sector and increasing wage inequality. These developments are often said to have especially af-fected women, who are disproportionately employed in low-wage jobs, and people in East Germany due to the still much higher unemployment and weak union coverage prevailing in the east.
Figure 1 documents the evolution of wage inequality between the mid-1990s and 2006 based on representative data from the German Socioeconomic Panel (SOEP).2 Changes in the overall wage inequality, as measured by the ratio between the median and the mean of the hourly wage distribution in the respective group of employed people (excluding the self-employed), is mainly driven by the increasing divergence between the median and wages at the bottom of the wage dis-tribution, as measured by the ratio between the first decile (p10) and the median. The decline in this wage ratio is particularly pronounced for men in West Germany and for both men and women in East Germany. By 2006, it had declined by a third to about 0.4 for men, which is roughly the same level as obtained by women in both regions. Except for women in West Germany, the decline of the p10/median wage ratio was much more pronounced in this period than the one recorded for the p25/median ratio.
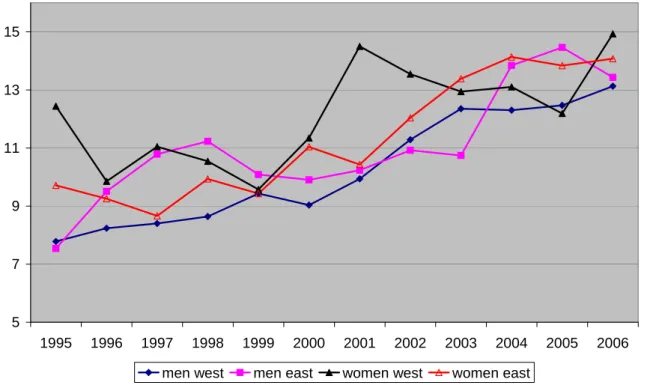
Figure 2 documents that the share of low-wage employment, defined by an hourly wage of less than 50 % of the median, has been increasing markedly since the late 1990s, and in particularly during the past few years. For men this share almost doubled in the observation period, reaching about 13 % in 2006, but the incidence of low-wage employment has also been increasing substan-tially for women, especially in East Germany. This strong increase occurred well before the recent labor market reforms which improved financial incentives to take up low-wage jobs, as described below.
Figure 3 plots the poverty rate, i.e. the share of the working population with an equivalent net income of less than half the median, which is taken as the common poverty line for both regions here.3 Measured this way, the poverty line amounts to about 650 € per month in 2008. Whilst the poverty rate has been increasing both in West and East Germany in the observation period, in East Germany this increase has been very dramatic where it has more than doubled, from less than 6 % in 1995 to more than 12 % in 2006. In contrast, in West Germany the slight increase in the poverty rate in the 1990’s did not continue in recent years.
2
For more on the SOEP, see Section 3.
3
The new OECD scale has been used for the calculation of equivalent income which gives a factor of 1 to the head of household, of 0.5 to each adult person and of 0.3 to each family member younger than 17. For a discussion on the measurement of the poverty rate, see Section 3.
Figure 1 Evolution of wage inequality in Germany, 1995-2005
Men West
0.3 0.4 0.5 0.6 0.7 0.8 0.9 1
1995 1996 1997 1998 1999 2000 2001 2002 2003 2004 2005 2006 median/mean p25/median p10/median
Men East
0.3 0.4 0.5 0.6 0.7 0.8 0.9 1
1995 1996 1997 1998 1999 2000 2001 2002 2003 2004 2005 2006 median/mean p25/median p10/median
Women West
0.3 0.4 0.5 0.6 0.7 0.8 0.9 1
1995 1996 1997 1998 1999 2000 2001 2002 2003 2004 2005 2006 median/mean p25/median p10/median
Women East
0.3 0.4 0.5 0.6 0.7 0.8 0.9 1
1995 1996 1997 1998 1999 2000 2001 2002 2003 2004 2005 2006 median/mean p25/median p10/median
Notes: p10 is the 10th percentile, p25 is the 25th percentile of the wage distribution. Calculations are based on personal SOEP weights. Only employed people aged 18-65 are included, the self-employed are excluded.
Figure 2 Share of low-wage employment (< 50% median hourly gross wage, in %), 1995-2006
5 7 9 11 13 15
1995 1996 1997 1998 1999 2000 2001 2002 2003 2004 2005 2006
men west men east women west women east
Notes: Low-wage share: share of people with an hourly wage < 0.5 median wage in the respective population subgroup (men in East Germany etc.). Only employed people aged 18-65 are included, the self-employed are excluded.
Source: Own calculations based on SOEP, waves 1995-2006, using sampling weights.
Figure 3 Poverty rate (in %), Germany total and by region, 1995-2006
0 2 4 6 8 10 12 14
1995 1996 1997 1998 1999 2000 2001 2002 2003 2004 2005 2006
PR total PR west PR east
Notes: The poverty rate (PR) is measured as the share of people (in %) with an equivalent income < 0.5 of the median, where this poverty line is assumed the same in East and West Germany. Equivalent income is based on the new OECD scale. Weighted estimates using personal SOEP sampling weights. The self-employed are not included.
The empirical evidence indeed seems to support the claim that inequality at the bottom of the wage distribution has been strongly increasing, and that this is related to an expanding share of low-wage employment. Contrary to what is usually assumed, though, the empirical evidence also shows that men have been even more strongly affected by this development than women, and that the low-wage sector has been expanding strongly in both West and East Germany. In terms of increasing poverty, however, the situation is much worse in East Ger-many, where the poverty rate more than doubled during the last 10 years.
What are possible reasons for these developments? One factor for the widening of the wage distribution might be that union coverage has been declining since the mid 1990’s (see, e.g., Schnabel and Wagner, 2006). Another explanation may be the labor market reforms of recent years. In particular, in 2003 the “mini-jobs” reform was introduced in Germany with the aim to boost employment in the low-wage sector.4 However, this policy change cannot be responsible for the strong increase in the share of low-wage employment among men in West Germany and women in both regions which already set in before 2003. More recently, means-tested income support and unemployment insurance have been reformed with the aim to im-prove financial work incentives and increase the pressure on unemployed people to take up jobs in the low-wage sector of the economy (see, e.g., Schmitz and Steiner, 2007). Since these latter policy changes became only effective in 2005, they alone cannot explain the dramatic increase in the poverty rate in East Germany. Part of this increase could also be related to the substantial reduction in expenditures on “active” labor market policies in East Germany, such as public works and training programs, which already started in the late 1990s (for a recent survey, see Caliendo and Steiner, 2005).
Whatever the reasons for these developments, they are used in support for the introduc-tion of a minimum wage in the current German economic policy debate. As menintroduc-tioned in the Introduction, basically two arguments can be distinguished: First, the existing wage bargain-ing system no longer prevents “excessive” downward wage flexibility, partly due to subsidies of “mini jobs” and unemployment benefits which are not fully withdrawn when low-paid jobs are taken up. In this view, the government has therefore to intervene either by declaring exist-ing industry wage contracts as generally bindexist-ing or, where this is not applicable, by introduc-ing a legal minimum wage.5 The second view holds that earnings of anyone working full-time
4
There already existed special regulations for “mini jobs” regarding social security contributions. The “Mini Jobs” reform abolished the maximum hours restriction and expanded the range of exempted earnings up to € 400; and reduced the social security contribution rate on earnings between € 401 and € 800 (for details, see Steiner and Wrohlich, 2005).
5
Contract wages set at the industry level can be declared generally binding by the government based on a special regulation contained in the so called “Entsendegesetz” which was initially introduced in the construc-tion industry in 1997 with the aim to prevent firms from other EU countries to compete at lower than the
con-should be sufficient to at least cover the means tested social minimum. In this view, a mini-mum wage is a means to prevent poverty among the working poor, which can only be achieved by a statutory nationwide minimum wage.
Proponents of this view, including the governing Social Democratic Party and the un-ions, have suggested a legal minimum wage of 7.5 € per hour. Although this suggested mini-mum is well below the union wages already declared legally binding for all employees in some industries (see footnote 5), it is said to raise incomes of employees in industries with low union coverage and a large share of low-wage jobs. However, this view does not take into account that low hourly individual wages need not translate into low household income due to the existing system of means-tested income support and the distribution of low wage earners among households. The German transfer system is characterized by a high “social minimum” relative to net in-work income of low qualified people and benefit-withdrawal rates close to 100 %. It includes a basic rate for each family member, which depends on the age of children, and a maximum amount for housing costs also depending on family size. Since 2005, the so-cial minimum defines the amount of means-tested unemployment benefits (UB II) for people deemed “employable” by the labor agency.6 People not fulfilling this criterion receive “social assistance” (“Sozialgeld”) which is also means tested and paid at similar amounts as UB II.
Table 1 shows average amounts of UB II for various types of households.7 For a single person the monthly UB II amount is quite close to the poverty line defined above. As Table 1 also illustrates, for people entitled to UB II the hourly wage which would yield the same net income in a full-time job may well come close to or even exceed the current wage in the low-wage sector. The implicit minimum wage, given by UB II levels for different household types (see the note to Table 1 for an exact definition), is especially high for one-earner couples with children.8 A wage ratio exceeding 100 % means that net household income of people entitled to means-tested income support would exceed their potential in-work income and they would,
tract wage set by German employers and unions. Since then, this regulation has been extended to the cleaning and maintenance industry, the temporary work’s industry and most recently to the postal service industry. In these industries, minimum wages range from about 6.5 € per hour in the cleaning and maintenance industry in East Germany to almost 12 € in the West-German construction industry. A prerequisite for the applicabil-ity of this regulation is that any existing union wage contract covers at least 50 % of all regularly employed people in the respective industry.
6
“Employability” is defined as the ability to work at least 3 hours a day and thus excludes persons with severe physical and mental disabilities only.
7
The standard rate of UB II is derived from consumption expenditures of low income households observed in the Income and Expenditure Survey (EVS) of the Federal Statistical Office which is conducted every five years. The amounts reported in Table 1 may differ between East and West Germany because of differences in housing costs.
8
Given the scarcity of subsidized child care especially in West Germany (see, e.g., Wrohlich, 2007), full-time employment of both spouses is often not an option.
therefore tend not to work.9 For one-earner couples and for single women with at least one child, this wage ratio exceeds 100 %. This wage gap is particularly large in East Germany where it is close to 200 % for couples with children.10
Table 1 Means-tested unemployment benefits, the “implicit minimum wage”, and its relation to
ob-served wages at the bottom of the wage distribution and a minimum wage of 7.5 € / hour, 2008
West Germany East Germany
Wage ratio Wage ratio
UB II Implicit
MW 2008 MW
UB II Implicit
MW 2008 MW
€/month €/hour % % €/month €/hour % %
Single women
no children 601.42 4.81 88.28 64.15 563.63 4.51 95.94 60.12
1 child, < 7 years 1,015.17 6.89 126.41 91.86 1,010.13 6.85 145.72 91.32
Couples (men working)
no children 959.17 7.67 102.04 102.31 954.13 7.63 162.41 101.77 1 child, < 7 years 1,198.62 8.36 111.13 111.43 1,161.45 8.06 171.48 107.46 2 children, 13 years 1,447.95 9.12 121.27 121.59 1,408.98 8.81 187.40 117.44 Notes: It is assumed that the household is eligible to UB II and that, in couple households, only one person
would work full-time, i.e.150 hours per month. Regular UB II benefits according to § 20 SGB II (“Sozialgesetzbuch II”) include subsidized housing costs (including heating) which are borne up to cer-tain maximum amounts, depending on the number of people living in the household; instead of these maximum amounts we use average housing costs for UB II recipients and heating costs differentiated by size of household as derived from the SOEP data here.
Implicit MW = ([UB II – child benefit] / 150) × 1.2, including the employee's share of social security contributions of 20%, but no income tax paid and no transfers other than the child benefit which de-pends on the number and age of children. UB II is means tested unemployment benefit which varies by number of household members and age of children.
Wage ratio = (implicit MW / wage)×100, where wage is either the average hourly wage in the bottom decile of the 2008 wage distribution, or the proposed minimum wage of 7.5 € per hour. The average hourly wage in 2008 is taken from Table 2 in Section 4 (men west = 7.52, men east = 4.53, women west = 5.45, women east = 4.70).
Source: Own calculations based on data from SOEP/STSM.
Table 1 also reveals that a legal minimum wage of € 7.5 per hour would fall short of the im-plicit minimum wage for couples, although it would exceed the imim-plicit minimum for singles without children and would be roughly equal to the one for singles with children. Further-more, these illustrative calculations also show that the minimum wage would not change the wage ratio and hence net household income for couples living in West Germany. Although net household income would be substantially higher for couples in East Germany, a minimum wage of € 7.5 per hour would still not be sufficient to raise net household income in full-time
9
Since take-up of means-tested income support is incomplete, not all eligible people would refrain from work-ing, however. On the issue of incomplete take-up of means-tested income support in Germany, see, e.g. Riphahn (2001), and Kayser and Frick (2001).
10
If maximum rather than average amounts for housing and heating costs were assumed, the wage ratio for one-earner couples in East Germany would be even higher than those reported in Table 1 but would differ lit-tle in West Germany.
employment above the level of the means-tested unemployment benefit. Thus, to prevent families with children with one low-wage worker to become eligible for means-tested income support, the minimum wage would have to be set at a considerably higher level than the pro-posed 7.5 € per hour, perhaps as high as 10 € per hour for families with more than one child.
Although these illustrative calculations do indicate that, at least for certain types of households, there might only be a weak link between minimum wages and net household in-come, they do not account for various important features of the German tax-benefit system. These include income taxation, especially the joint taxation of couples, other means-tested transfers, such as housing benefits, the exemption of “mini jobs” from social security contri-butions, and unemployment benefit withdrawal rates below 100 %. Furthermore, not all households are entitled to means-tested unemployment benefits, and not all couple households with children consist of only one earner. In the subsequent empirical analysis we will analyze the relationship between the minimum wage, the hourly wage and net household income on the basis of a microsimulation model, as described in the next section.
3
Methodology
As mentioned in the Introduction, there is an extensive literature on the economic effects of minimum wages which primarily focuses on their wage and employment effects. In their re-cent survey of this literature, Neumark and Wascher (2007) conclude that the majority of stu-dies to date, which mainly refer to the US, have found no clear-cut evidence on the labor market effects of minimum wages. For Germany, the only related empirical study we are aware of is by König and Möller (2007) which refers to the construction sector, where the contract wage was declared generally binding by the “Entsendegesetz” (see footnote 5). The authors find negative employment effects in parts of the East German construction sector but insignificant or even positive effects for West Germany.
In this paper, we follow most previous empirical studies analyzing minimum wage ef-fects on the distribution of household incomes and poverty and abstract from any induced potential labor supply and employment effects. This may be rationalized by the argument, as in, e.g., Burkauser and Sabia (2005), that potential employment effects, on average, tend to be small and rather uncertain. Of course, these effects should be accounted for in a more com-plete analysis of the impact of a minimum wage on the income distribution and poverty. The subsequent analysis may thus be viewed either as the first step in a more complete evaluation of the overall impact of the introduction of a minimum wage or as measuring its short-run (“day after”) effects.
In a first step, we thus simply substitute the suggested minimum wage of € 7.5 per hour for the hourly gross wage of employed people in our sample if a person’s observed wage falls short of the minimum. For each employed person, the gross hourly wage is obtained by divid-ing reported gross earndivid-ings in the month before the interview by the number of hours worked in that month, where paid overtime hours are included.11 Using SOEP sampling weights, we then compare the observed wage distribution (no minimum wage) and the hypothetical wage distribution conditional on the minimum wage under the assumption of no labor market ad-justment.
To analyze minimum wage effects on the distribution of net household incomes we make use of the microsimulation model STSM which incorporates all major components of the German tax-benefit system. STSM is based on the Socio-Economic Panel (SOEP) which is a representative sample of households living in Germany with detailed information on household incomes, working hours and household structure.12 The tax-benefit calculator em-bedded in STSM allows us to compute net household incomes not only under the current wage structure but also for alternative wage structures, such as the one resulting from the in-troduction of a minimum wage. Earnings from dependent employment is the most important income component for the great majority of households. The SOEP also contains information on earnings (and working hours) from a “secondary job”, i.e. a job held in addition to the main job, which we add to wage income for the calculation of net household income. Em-ployees’ social security contributions and the income tax are deducted from gross household income and social transfers are added to get net household income. Social transfers include child allowances, child-rearing benefits, educational allowances for students and apprentices, unemployment compensation, the housing allowance, and social assistance. Taxable income is calculated by deducting certain expenses from gross household income.
The data we use for the following empirical analysis are from the current SOEP wave for the year 2006. Since the STSM is based on retrospective information on income compo-nents for the computation of net household incomes for a given year, incomes computed on basis of the SOEP wave from 2006 refer to the year 2005. Because our analysis is focused on to the year 2008, we extrapolate incomes to that year on the basis of realized average growth
11
This hourly wage measure may underestimate the effective hourly wage, for at least two reasons: First, since the majority of people in the SOEP is interviewed in the first three months of the year, fringe benefits are un-derrepresented. Second, ”paid hours” may partly be paid for in later months, or may be compensated for by working less than normal hours in the future.
12
STSM basically consists of two parts: a tax-benefit calculator that computes net household incomes for each sample household on the basis of information on gross incomes, and for different (hypothetical) legislations and different working hours of individuals, and an empirical labor supply model. A detailed description of STSM is contained in Steiner, Haan and Wrohlich (2005). For more information on the SOEP, see http://www.diw.de/soep.
rates for the period 2005-2007 and expected growth rate for 2008.13 The tax-benefit system is also updated to include all known changes in regulations up to 2008.
An important methodological issue in poverty measurement is how to define the income level which draws the poverty line. Here, we define the poverty line to be 50 % of median equivalent household income. We use the same poverty line for both East and West Germany, since the means-tested income support for unemployed people also does not, in principle, dif-ferentiate between the two regions, except for slight differences in covered housing costs. Equivalent income accounts for household size and is derived by dividing net household in-come by the new OECD scale (defined in footnote 3 above). We use this scale here because it gives similar weights as the weighting scheme implicit in the German means-tested income support system which defines the legally set “social minimum”. We use 50 % of the median, rather than the more commonly applied 60 %, to define the poverty line here, because this corresponds more closely to the social minimum used in the simulations of net household income below.
To measure minimum wage effects on the level and depth of poverty, and also to differ-entiate these effects between various groups in the population, we use several decomposable poverty measures. Forster, Geer and Thorbecke (1984) have defined a class of poverty meas-ures given by:
(
)
1
1 / ,
n e
i i
Pα =N−
∑
= ⎡⎣ z−y z⎤⎦αwhere ye is equivalence income, z is the poverty line, n is the number of people with equiva-lence income below the poverty line (ye < z), and N is the overall number of people in the population. Depending on the chosen parameter α, several measures found in the literature can be derived:
• for α= 0, P0 = n/N, which is the poverty rate, PR;
• α= 1 yields the so called poverty gap, PG, with 0 ≤ PG≤PR;
• for α= 2, the poverty measure P2 results which also accounts for the severity of pov-erty in the poor population.
PR is simply the ratio of the number of people with (equivalent) income below the poverty line; it is also referred to as the “head count” measure in the literature. PG measures the
13
Since most interviews in the SOEP refer to the first quarter of the year, we have assumed that they will in-crease with the annual growth rate in that year. Average annual growth rates are derived from the following indices for the years 2006, 2007, and 2008: 1.017, 1.016, 1.016 for consumer prices; 1.008, 1.020, 1.025 for wages; 1, 1.003, 1.012 for old-age pensions; 1.017, 1.016, 1.016 for income from rents; and 1.05, 1.04, 1.04 for income from profits (source: national accounts; BMWi (2007); own calculations). We check the sensitiv-ity of our simulation results to the assumptions underlying the forecasting of wages below.
age deviation of the incomes of the poor from the poverty line, expressed relative to the total population, and thus measures the extent to which the population is poor, on average. PG can also be written as the product of the poverty rate and the average deviation of the equivalent income of the poor population from the poverty line, also called the “income gap ratio” in the literature.14 P2 also measures the depth of poverty by giving poor households with incomes
further below the poverty line more weight, and thus also factors in income inequality among the poor population.15
As shown by Foster, Geer and Thorbecke (1984), the P2 measure is consistent with
standard requirements for poverty indicators introduced by Sen (1976) and discussed more generally by Atkinson (1987) 16, while the PR and the PG are not. However, since these meas-ures, and the PR in particular, are widely used in the policy debate, we will use all three indi-cators to evaluate the impact the introduction of a legal minimum wage would have on pov-erty in Germany. Another advantage of these povpov-erty measures is that they are additively de-composable by subgroup with population share weights, which allows us to assess the effects of changes of poverty within subgroups, such as differentiated by gender, on the total change in poverty.
4
Results
4.1 Wage effects
In Table 2 we summarize our results concerning the effects the introduction of a minimum wage of € 7.5 per hour would have on the wages of already employed people in the absence of employment effects. The upper part of the table shows for Germany overall and for various subgroups the average gross hourly wage prevailing in 2008 and the average wage of cur-rently employed people if the minimum was introduced.17 The numbers in parentheses give, for each group, the absolute and relative differences in these two wage measures. We also
14
PG=PR IGR× ,where IGR=
(
z−ye)
/ ,z with 1 1n
e e
i i
y =n−
∑
= y , is known as the “income gap ratio”, see Sen (1976).15
(
2) (
2)
22 / [ ] / P,
P = PG PR + PR−PG PR ×CV with 2
P
CV ≡squared coefficient of variation of income among the poor population (see Foster, Greer and Thorbecke, 1984, and Kakwani, 1980).
16
That is, the “monotonicity axiom” (a reduction in the income of a poor household must, other things being equal, increase the poverty measure) and the “transfer axiom” (an income transfer from a poor to a richer household must increase the poverty measure) are fulfilled.
17
Note that expected wages of currently not employed people would also be affected by the minimum wage and thus also potentially increase labor supply and employment. As mentioned in Section 3, we abstract from these effects in the current paper.
report the median and the mean of these two wages.18 On average, a minimum wage of € 7.5 per hour amounts to about 50 % of the median and 46 % of the average gross hourly wage in the German economy.19 For the median, this share varies between about 40 % for men in West Germany to about two third for women in East Germany.
Table 2 Wage distribution before and after the introduction of a legal minimum wage of € 7.5/hour, currently employed people only, 2008 (wage projections based on average growth rates)
Total Men Women
Germany West East West East
No MW MW No MW MW No MW MW No MW MW No MW MW
1st-10thpercentile 5.74 7.50 7.52 8.34 4.53 7.50 5.45 7.50 4.70 7.50 (1.76; 30.66) (0.82; 14.29) (2.97; 51.74) (2.05; 35.71) (2.80; 48.78) 1st-5th percentile 4.55 7.50 5.86 7.53 3.71 7.50 4.47 7.50 3.44 7.50
(2.95; 64.84) (1.67; 36.70) (3.79; 83.30) (3.03; 66.59) (4.06; 89.23) 6st-10thpercentile 6.89 7.50 9.13 9.13 6.01 7.50 6.42 7.50 5.83 7.50 (0.61; 8.85) (0.00; 0.00) (1.49; 21.63) (1.08; 15.67) (1.67; 24.24) 11th-15thpercentile 8.23 8.23 10.94 10.94 6.99 7.50 7.66 7.74 6.62 7.50
(0.00; 0.00) (0.00; 0.00) (0.51; 6.20) (0.08; 0.97) (0.88; 10.69) 16th-25thpercentile 9.80 9.80 12.56 12.56 8.16 8.16 9.01 9.01 7.50 7.61
(0.00; 0.00) (0.00; 0.00) (0.00; 0.00) (0.00; 0.00) (0.11; 1.12) Median 14.74 14.74 17.66 17.66 12.21 12.21 13.45 13.45 11.29 11.29
(0.00; 0.00) (0.00; 0.00) (0.00; 0.00) (0.00; 0.00) (0.00; 0.00)
Mean 16.01 16.19 19.03 19.12 13.00 13.32 14.41 14.62 12.17 12.52
(0.18; 1.12) (0.09; 0.56) (0.32; 2.00) (0.21; 1.31) (0.35; 2.19) MW as % of
median 50.88 42.47 61.43 55.76 66.43
mean 46.32 39.23 56.31 51.30 59.90
People affected (%)
overall 9.44 4.01 14.90 11.60 12.17
within 1st decile 93.05 39.66 100.00 100.00 100.00
Δ wage bill
(1000 € / month) 498,985.27 114,852.30 80,468.65 214,465.62 89,198.69
% of wage sum 0.76 0.32 1.68 1.04 2.22
Notes: Only employed people aged 18-65 are included. Percentiles are defined for the wage distribution with-out the minimum wage. Means are calculated within the range of given percentiles. Δ wage bill is the difference between the wage sum with and without the minimum wage, with wage sum = Σ (hourly wage×weekly working hours×4.2); employers’ social security contributions not included.
Source: Own calculations based on SOEP, wave 2006.
18
To account for measurement errors in the hours and wage data, we have excluded wages below 3 €/hour (<1 % percentile of the raw hourly wage distribution) received in regular employment. We have included hourly wages below 3 €/hour if they refer to supplementary work of people drawing unemployment benefits (see Section 2).
19
People in full-time vocational and apprenticeship training as well as „secondary jobs“, i.e. jobs held in addi-tion to the main job, are excluded here; regarding the latter exclusion restricaddi-tion see discussion below.
As shown in the lower part of the table, in Germany overall less than 10 % of all employees would be affected by the minimum wage. Whilst among men in West Germany only about 4 % of all employees would be affected, almost 15 % of males in East Germany and 12 % of all employed women are currently employed below this minimum. Except for men in West Germany, all currently employed people in the bottom decile of the wage distribution would be affected by the minimum wage. Table A1 in the Appendix shows that the minimum wage would disproportionately affect younger employees, those with low qualification, “margin-ally” employed people (i.e., those in “mini jobs”), employees in certain industries, in particu-lar in agriculture and forestry, in the textile and food industry and in wholesaled and retail trade, and those working in small firms.
Overall, the introduction of the minimum wage would increase the total wage bill by about 500 million € per month, or 6 billion € per year, which is about 0.76 % of the wage bill in 2008. In absolute terms, the lion’s share of this increase would go to female employees in West Germany, which reflects the still existing gender wage differential. The largest relative increase in the wage bill is estimated for women in East Germany (2.2 %), while the wage bill would only increase by about 0.3 % for men in West Germany.
Despite this substantial increase in the wage bill, the minimum wage would have very little effect on average wages: Overall, the average hourly gross wage would increase by less than 20 cent, or by about 1 %. This direct wage effect varies between about 0.5 % for men in West Germany to about 2 % for employees in East Germany. Table 2 also shows that for men in West Germany the modest wage increase would only occur in the bottom decile of the wage distribution, whereas wages would also slightly increase for the other groups with cur-rent wages just above the 10th percentile. However, compared to the very pronounced increase in the first decile of the distribution, and in particular in the 1st-5th percentile, these changes seem negligible. For Germany overall, the minimum wage would raise the average hourly gross wage in the first decile by about 30 %, from 5.7 to 7.5 € per month. Within the first dec-ile, the wage increase varies between 14.3 % for men in West Germany to about 50 % in East Germany. Within the 1st-5th percentile of wage distribution, the average wage increase amounts to about 65 %, ranging from about 37 % for men in West Germany to almost 90 % for women in East Germany.
Table A1 in the Appendix documents that these wage changes differ surprisingly little by age and qualification, but significantly by employment status. As mentioned in Section 2, the perceived low-pay of people in “marginal employment”, i.e. in jobs earning less than 400 € per month and not covered by social security, has been one alleged reason for introduc-ing a minimum wage. As shown by Table A1, hourly gross wages of people holdintroduc-ing such jobs
would be raised by more than 40 %, on average, compared to 20 % for full-time employed people. Regarding industry effects, the average wage increase would be relatively modest in the mining and energy industry and the iron and steal industry, and would be relatively high in public services and wholesale and retail trade. Corresponding to the well-known firm-size wage differentials, minimum wage effects are declining in firm size, with the expected wage increase amounting to almost 40 % in firms with less than 5 employees, about double the in-crease in large firms.
In view of the recent development of wage inequality documented in Section 2 (see Figure 1), forecasting wages to 2008 on the basis of common growth rates may be questioned. To check the sensitivity of simulation results to this assumption, we have forecast wages on the basis of individual specific growth rates derived from dynamic wage growth regressions estimated on SOEP data for the years 1995-2006.20 Although the correlation between wages updated this way and on the basis of the common growth rates reported in footnote 13 is sur-prisingly high (correlation coefficient of 0.99), the level of individually predicted wages is slightly below that obtained by updating wages by common growth rates, especially in the bottom decile of the wage distribution. The overall wage bill would increase by 0.96 % in-stead of 0.76 % with this rise being mainly driven by the relatively strong increase estimated for men and especially women in East Germany (compare Table 3 and Table A2 in the Ap-pendix). Still, the effects of the minimum wage on the 2008 wage distribution are very similar if wages were updated on the basis of individual rather than common growth rates. Since es-timated individual growth rates are derived from a period with an extraordinary decline in wages at the bottom of the distribution (see Figure 1 in Section 2), our wage growth regres-sions underestimate the relatively high wage gains realized between 2006 and 2008. The use of average growth rates seems therefore more appropriate from an empirical standpoint and we will, therefore, base the following analysis of how wage increases affect net household incomes on the simulation results in Table 3.
20
Δln( )wit = + ×α β trend+ × Δγ ln
(
wi t, -1)
+vit,where wit is the hourly gross wage of individual i in year t (t =1997, 1998, … 2006), α is a constant, trend is a linear time trend and vit = uit-ui t, -1.is a MA(1) error term.
Since the error term is correlated with the lagged dependent variable, we estimated the equation with ln(wi,t-2)
and trend as instrumental variables separately for men and women and for East and West Germany. IV esti-mates yielded statistically significant positive γ coefficients and significant negative β coefficients for all groups, although both turned out relatively small in absolute terms. On the basis of the estimated wage growth equations expected growth rates for the years 2006, 2007, and 2008 were derived recursively, with
(
ln | ln , 1)
, 2006, 2007, 2008i i i
gτ =E Δ wτ Δ wτ− τ = . Using these estimated growth rates and the relation
( )
2008 ,2008 ,2005 2006 1
i i i
w =w
∏
τ= +gτ , individual wages for 2008 are then derived for all persons for whom a wagewas observed for 2006. For those individuals for whom growth rates could not be calculated due to sample attrition (at least three successive individual observations are required in the dynamic growth rate regres-sions), mean values of growth rates within the estimation sample were imputed.
Another sensitivity check concerns the treatment of “secondary jobs”. Since the 2003 “Mini Jobs” reform, jobs with earnings below € 400 per month have also been exempted from employees’ social security contributions if held in addition to a main job (see, e.g., Steiner and Wrohlich, 2005). Our calculations of the wage effects of the introduction of a legal mini-mum wage do not include secondary jobs. Although it is currently not clear how they would be treated if a legal minimum wage were actually implemented in Germany, it seems rather difficult, both legally and politically, to exclude secondary jobs. Since the SOEP contains information on both earnings and hours worked in secondary jobs, we can include them in our analysis of the wage effects of the introduction of a minimum wage. Estimation results, which are summarized in Table A3 in the Appendix, show that the results deviate only slightly within the first decile of the wage distribution. Since only a limited number of people is af-fected by potential changes of secondary incomes, the overall findings change only margin-ally and do not affect any of our conclusions. We thus continue our analysis on the basis of our estimation results in Table 3.
4.2 Effects on the income distribution and on poverty
To which extent are the substantial increases in hourly wages we observe at the bottom of the wage distribution translated into higher net household incomes and a reduction in poverty? This question is answered by Table 3 which summarizes, for various types of households af-fected by a legal minimum, income changes which would be induced by the minimum wage. The second column of the table shows that, whilst the overall share of households affected by the minimum wage in Germany is 8.6 %, it amounts to 14.4 % in East Germany, about double the share in West Germany. In the total population, the share is considerably above average for families with children if both spouses work, and also for singles with children. As docu-mented in Table A4 in the Appendix, these differences by type of household can also be ob-served within the two regions, although they are much more pronounced in West Germany.
The minimum wage would increase net monthly household incomes by about 60 €, on average, in Germany overall; the increase in income would amount to about 53 € in West Germany and 77 € in East Germany. Relative to the current situation, net household income would increase by about 2 % in West Germany and 4 % in East Germany. Compared to the very large wage increases at the bottom of the wage distribution documented in the previous section, income changes are rather small and reflect the weak link between (hourly) wages and net household income. Since means-tested transfers are related to the presence of children in the household and to the employment status of the spouse, the minimum wage would have only very small effects on families with children and couples with only one employed spouse.
As Table A4 shows, this pattern is somewhat more pronounced in West Germany but can also be observed in the East.
Table 3 Effects on net incomes of households affected by a minimum wage of 7.5 €/hour, 2008 (income projections based on average growth rates)
MW of 7.5 €/hour Households
affected by MW No MW Δ average income Δ total income % € / month € / month % 1000 € / month %
West Germany 7.28 2,567.07 53.14 2.07 71,765.77 60.14
East Germany 14.39 1,914.36 76.76 4.01 47,566.18 39.86
Germany, overall 8.62 2,361.78 60.56 2.56 119,331.95 100.00 without children 6.83 1,597.44 76.53 4.79 71,374.87 59.81
with children 11.27 3,048.73 46.22 1.52 47,957.08 40.19
Germany, couples 10.57 3,035.24 60.00 1.98 76,440.22 64.06 without children 8.75 2,484.27 77.29 3.11 32,021.09 26.83
with children 11.74 3,300.79 51.67 1.57 44,419.13 37.22
both spouses work 14.44 3,217.41 69.14 2.15 68,227.56 57.17
one spouse works 4.27 2,358.33 29.16 1.24 3,554.37 2.98
Germany, singles 6.45 1,129.78 61.59 5.45 42,891.73 35.94
without children 5.81 888.61 75.92 8.54 39,353.78 32.98
with children 9.43 1,831.85 19.87 1.08 3,537.95 2.96
Notes: Households affected by the minimum wage as percentage of all households in each group. Percentage changes of average income refer to households within the respective group, percentage changes of total income are calculated relative to the whole population.
Source: Own calculations based on SOEP, wave 2006.
Table 3 documents how the total income change induced by the introduction of the minimum wage would be distributed across households. In total, the income change would amount to about 120 million € per month, or roughly 1.5 billion € per year, which equals only about 25 % of the total increase in the wage bill (see Table 2). Since our calculations abstract from potential labor demand and supply responses, the relatively small increase in net incomes re-flects the “mechanical” substitution effect between wages and means-tested income support. The relatively large wage increases induced by the minimum wage at the bottom of the wage distribution thus mainly lead to the withdrawal of social transfers, higher income taxes, and increased public savings with relatively little impact on net household incomes.
The last column of Table 3 reveals that about 40 % of the total increase in net household income would go to East Germany, where about 20 % of the total population lives. Only about one third of the income gain would go to single-earner households, including single parents, and families with children would receive only about 40 % of the income gain. Thus, if one of the aims of a legal minimum wage is to prevent poverty of families with children, it does not seem to be an effective policy instrument from this perspective.
Another relevant policy issue is how the minimum wage would affect the distribution of incomes. Table 4 answers this question regarding the distribution of net equivalent incomes of household affected by the minimum wage, as defined in Section 3, by deciles, calculated for the 2008 wage structure.21
Table 4 Effects of a minimum wage of 7.5 €/hour on net equivalent incomes of households affected (€ per month), Germany 2008 (income projections based on average growth rates)
MW of 7.5 €/hour Persons
affected by MW No MW Δ average equivalent income
Decile % € / month € / month %
1st 8.82 616.12 77.26 12.54
2nd 17.82 848.48 56.63 6.67
3rd 17.11 1,046.50 45.32 4.33
4th 10.44 1,293.47 29.46 2.28
5th 11.14 1,489.51 33.06 2.22
6th 7.86 1,651.45 27.08 1.64
7th 5.21 1,903.26 36.63 1.92
8th 4.20 2,156.70 9.04 0.42
9th 2.63 2,519.06 12.29 0.49
10th 0.97 4,630.33 28.93 0.62
Total 8.62 1,294.77 42.28 3.27
Notes: Deciles for the overall equivalent net income distribution are calculated for the wage structure in 2008 (without minimum wage). Persons affected by the minimum wage as percentage of all people within a given decile of the net equivalence income distribution. Percentage changes of average income refer to equivalent persons within the respective group, percentage changes of total income are calculated rela-tive to the whole population, measured in equivalence units.
Source: Own calculations based on SOEP, wave 2006.
For Germany overall, the share of persons in the bottom decile of the net equivalent income distribution affected by the minimum wage is less than 9 %, substantially less than the shares affected in each of the 2nd-5th deciles. Only in the higher deciles of the distribution does this share decline below the level it obtains in the bottom decile. As the regional breakdown in Table A5 in the Appendix reveals, the distribution of people affected by the minimum wage across deciles of the net equivalence income distribution differs substantially between the two regions. Whereas the share of people affected by the minimum would be rather evenly dis-tributed up to the 7th decile in East Germany, this share would be relatively small in the upper part of the distribution in West Germany. However, the share of people affected at the bottom of the distribution is not particularly large in both regions. Thus, the minimum wage does not
21
As mentioned above, income from secondary jobs is assumed to be constant under the minimum wage alter-native in our standard simulation . As a sensitivity check we also adjusted wages from secondary jobs for the minimum wage simulation with results changing only marginally and conclusions remaining unaffected. Estimation results are available from the authors upon request.
seem to be particularly well targeted at the poor also from the perspective of the distribution of net equivalence income implicitly taking into account the composition of households of people whose gross wages might have increased substantially.
On average, net equivalent income would increase by about 40 €, or 3.3 %. The average increase would be slightly larger in East Germany, both in absolute and in relative terms (see Table A5). The largest relative increase in average equivalent income would occur in the bot-tom deciles of the income distribution and amount to € 77 per month, or 12.5 % of this group’s net equivalent income in 2008. In relative terms, the income gain declines quickly in higher income deciles. However, the regional breakdown in Table A5 shows that this pattern holds for West Germany only, whereas in East Germany relatively large income gains would also occur in the middle of the distribution.
Table 5 Effects of a minimum wage of 7.5 €/hour on the overall income distribution and on poverty, 2008 (income projections based on average growth rates)
Germany West Germany East Germany
No
MW MW Δ
No
MW MW Δ
No
MW MW Δ
Inequality measures × 100
Gini coefficient 28.97 28.83 -0.140 28.77 28.67 -0.102 26.26 25.99 -0.263
MLD 14.50 14.36 -0.139 14.39 14.28 -0.101 11.67 11.45 -0.222
Atkinson (ε = 2) 29.60 29.41 -0.183 29.61 29.48 -0.130 25.40 25.12 -0.283 Poverty measures × 100
PR 11.75 11.56 -0.188 9.54 9.54 -0.007 21.25 20.28 -0.971
PG 2.07 2.04 -0.033 1.73 1.72 -0.009 3.54 3.41 -0.132
IGR 17.63 17.64 0.006 18.13 18.05 -0.086 16.66 16.80 0.146
P2 0.78 0.76 -0.014 0.70 0.69 -0.006 1.11 1.07 -0.042
2 P
CV 5.15 5.13 -0.031 6.01 5.95 -0.128 3.52 3.52 0.008
Notes: The Gini coefficient is sensitive to changes in the middle of the income distribution. MLD is the mean log deviation of equivalent income which is a “bottom-sensitive“ inequality measure. The Atkinson ine-quality measure is calculated for a high degree of ineine-quality aversion (ε = 2). For exact definition and properties of these inequality measures, see, e.g., Cowell (1995). PR is the poverty rate, PG is the pov-erty gap, IGR is the income gap ratio, CV is the squared coefficient of variation in the group of poor P2
people and P2 is the Foster-Greer-Thorbecke poverty measure, as defined in Section 3. Source: Own calculations based on SOEP, wave 2006.
To investigate the potential effect the introduction of a legal minimum wage would have on the overall income distribution, Table 5 reports several standard summary inequality meas-ures. The Gini coefficient, which is sensitive to income changes in the middle of the distribu-tion, does not record any significant change in the income distribution. Using the bottom-sensitive mean logarithmic deviation (MLD) measure shows a very small decline in income inequality, which is also recorded by the Atkinson measure assuming a relatively high value
for the inequality aversion parameter, i.e. ε = 2. Although all three measures indicate that the reduction in income inequality would be slightly larger in East Germany, these changes are still very small and probably not statistically significant. Thus, in neither region would the minimum wage have any noticeable effect on overall income inequality.
Turning to results for the poverty measures, Table 5 shows that the introduction of the minimum wage would also have very little effect on the incidence and depth of poverty. For Germany overall, the poverty rate would change very little, and the poverty gaps would not change at all. This also holds for the poverty measure P2, which also accounts for the depth of poverty in the total population. As shown by the income gap ratio and the squared coefficient of variation (see Section 3), the minimum wage would also hardly change, respectively, the depth of poverty and the inequality of income in the poor population. Except for a slight de-crease in the poverty rate in East Germany, the ineffectiveness of the proposed minimum wage in reducing poverty however measured holds true for both regions. These results are also fairly robust to the definition of the poverty line, as documented by Table A6. Although the level and depth of poverty depends, of course, very much on the definition of the poverty line, relative changes in the various poverty indicators are all very small and similar irrespec-tive of how we define poverty. This also holds if we define poverty not as some ratio of mean or median equivalent income but by the equivalized level of UB II.
To check whether these results are driven by compositional effects, we have decom-posed the poverty measures by several groups suggested by results of the analysis of differen-tial wage effects in Section 4.1, where it was shown that wage increases would differ greatly by gender and, for couple households, by employment status. Regarding the decomposition by gender, results documented in Table A7 show, however, that there is very little difference in changes in both the poverty rate and the two alternative measures of the poverty gap be-tween men and women, both in Germany overall and in the two regions. The decomposition of these inequality measures by employment status also shows no differential impact of the minimum wage on, respectively, single earners or double earners living in couple households, while poverty slightly increases in those households with both spouses non-employed. Alto-gether, the decomposition analysis indicates that compositional effects are not responsible for the main result that the proposed minimum wage would have very little effect on poverty in Germany overall and within population subgroups.
5 Summary and Conclusion
Since the mid-1990s, wage inequality has been increasing significantly in Germany, mainly driven by a marked relative decline of hourly gross wages at the bottom of the wage distribu-tion and an increasing share of the low-wage sector. Although the decline in relative wages was most pronounced in East Germany, on average, male employees in West Germany were also strongly affected by it. Furthermore, the poverty rate, as measured by the number of peo-ple with net equivalence incomes below half the median income has been increasing in recent years, mainly driven by a very strong increase in East Germany over the past few years. These developments have led to the proposed introduction of a general statutory minimum wage in the amount of 7.5 € in Germany, one of the few OECD countries where a legal minimum wage does currently not exist. One popular rationale for the introduction of this proposed le-gal minimum wage is to prevent poverty among the working-poor. However, as stressed by previous minimum wage studies, there might only be a weak link between low hourly wages and net household incomes which renders minimum wage policy a rather ineffective tool to combat poverty among the working poor. This may be of particular relevance for Germany, due to the existence means-tested income support system with a high social minimum relative to net in-work income and high benefit withdrawal rates.
To account for this important relationship we have analyzed the distributional effects of the introduction of a nationwide minimum wage of € 7.50 per hour on the basis of a micro-simulation model which accounts for the complex interactions between individual wages, the tax-benefit system and net household incomes. Simulation results on the basis of individual-level data from the German Socio Economic Panel (SOEP) show that the proposed minimum wage would have only a modest overall impact on average wages in the German economy, but would have very substantial effects on wages at the bottom of the hourly wage distribu-tion. Overall, the incidence of the minimum wage varies from about 4 % for men in West Germany to 15% in the east. Except for men in West Germany, all currently employed people in the bottom decile of the wage distribution would be affected by the minimum wage. It would disproportionately affect younger employees, those with low qualification, and “mar-ginally” employed people. The average hourly gross wage would increase by about 30 % in the bottom decile of the wage distribution, and by about 65 % in the 1st-5th percentile, where these wage effects would vary substantially by gender and region. Expected wage increases at the bottom of the wage distributions would differ surprisingly little by age and qualification, but do differ significantly between full-time, part-time and “marginally” employed people.
In contrast to the substantial wage effects at the bottom of the wage distribution, the in-troduction of a minimum wage in the proposed amount would have little impact on net household incomes: On average, the increase in monthly net income of households affected by the minimum wage would amount to about 50 € (2 %) in West Germany and 80 € (4 %) in East Germany, and would be even smaller for families with children and couples with one employed spouse. These relatively small income changes reflect the weak link between (hourly) wages and net household income. In total, the income change induced by the pro-posed minimum wage would amount to roughly 1.5 billion € per year, which is only about 25 % of the total expected increase in gross earnings. About 40 % of the total increase in net household income would go to East Germany, where about 20 % of the population live. Fami-lies with children would receive less than half of the income gain and only a relatively small share of the income gain would be received by single-earner households.
The minimum wage would also not be particularly well targeted at the poor: For Ger-many overall, the share of persons in the bottom decile of the distribution of net equivalent household income who are affected by the minimum wage is just 10 %, below the respective share in the middle of the distribution. This effect is even more pronounced in East Germany, where only a relatively low share of people in the bottom decile would be affected by the pro-posed minimum wage. However, the largest relative increase in average equivalent income would occur in the bottom deciles of the income distribution, with only small gains in higher deciles in both East and West Germany.
The suggested legal minimum wage would only have negligible effects on the overall income distribution, as indicated by standard summary inequality measures. Furthermore, the minimum wage would neither reduce the poverty rate nor the poverty gap significantly, and would also not affect the distribution of income or depth of poverty in the poor population. This result is not sensitive to the definition of the poverty line. The decomposition of these poverty measures by various groups has also shown that the insensitivity of overall poverty to the minimum wage is not driven by compositional effects.
Thus, the suggested minimum wage does not seem to be an effective policy instrument to redistribute income and to reduce poverty. To a large extent, these results can be related to the structure of the means-tested income support existing in Germany with its relatively high social minimum and high benefit withdrawal rates. This also implies that the lion’s share of the costs of income support for households with people earning low wages would be shifted from the tax-benefit system to the costs employing these people. Given the relatively high wage elasticities for the demand of low-skilled labor, and in particular “marginal” employ-ment (see Freier and Steiner, 2007), it seems likely that taking into account the effects of a
minimum wage on employment in the low-wage sector would lead to an even more pessimis-tic view on the usefulness of a minimum wage as a means to reduce poverty. On the other hand, a minimum wage may increase effective labor supply and reduce the problem of in-complete take-up of means-tested income support and thereby reduce the degree of “hidden” poverty. These effects should be taken into account in a more complete evaluation of mini-mum wage effects on the distribution of incomes and on poverty, which is an important task for future research.
References
Atkinson, A.B. (1987), On the measurement of poverty. Econometrica 55, 759-764.
Bluestone, B. and T. Ghilarducci (1996), Making Work Pay. Wage Insurance for the Working Poor, Public Policy Brief. The Jerome Levy Economics Institute of Bard College. BMWi (Federal Ministry of Economics and Technology) (2007): Projektion der
gesamtwirt-schaftlichen Entwicklung in Deutschland bis 2011. Monatsbericht 07/2007, Teil III.
http://www.bmwi.de/BMWi/Redaktion/PDF/P-R/projektion-monatsbericht-juli-2007,property=pdf,bereich=bmwi,sprache=de,rwb=true.pdf.
Bosch, G. and C. Weinkopf (2006), Gesetzliche Mindestlöhne auch in Deutschland? Gelsen-kirchen: Institut für Arbeit und Technik (IAT).
Brown, C. (1999), Minimum Wages, Employment, and the Distribution of Income, O. Ashenfelter and D. Card, Handbook of Labor Economics. Amsterdam et al.: Elsevier, 2101-63.
Burkhauser, R. V., K. A. Couch and D. C. Wittenburg (1996), ‚Who Gets What’ from Mini-mum Wage Hikes: A Re-Estimation of Card and Krueger's Distributional Analysis in Myth and Measurement: The New Economics of the Minimum Wage. Industrial and Labor Relations Review, 49(3), 547-52.
Burkhauser, R.V. and J. Sabia (2005), Raising the minimum wage: another empty promise for the working poor. Employment Policies Institute. August, 2005.
Caliendo, M. and V. Steiner (2005), Aktive Arbeitsmarktpolitik in Deutschland: Bestandsauf-nahme und Bewertung der mikroökonomischen Evaluationsergebnisse, Zeitschrift für Ar-beitsmarktforschung, 38, 2/3, 386-418.
Cowell, F. (1995), Measuring Inequality (2nd ed.). LSE Handbooks in Economics. Prentice Hall.
DIW (2006), Wachsender Niedriglohnsektor in Deutschland – sind Mindestlöhne sinnvoll? DIW Wochenbericht No. 15-16/2006. Deutsches Institut für Wirtschaftsforschung, Ber-lin.
Foster, J., J. Greer, and E. Thorbecke (1984), A Class of Decomposable Poverty Measures, Econometrica 52, 761-765.
Freier, R., V. Steiner (2007), ´Marginal Employment´ and the demand for heterogeneous la-bour: Empirical evidence from a multi-factor labour demand model for Germany. IZA Discussion Paper No. 2577, Bonn.
Goldberg, M. and D. Green (1999), Raising the Floor. The Social and Economic Benefits of Minimum Wages in Canada. Canadian Centre of Policy Alternatives.
Gosling, A. (1996), Minimum wages: Possible effects on the distribution of income. Fiscal Studies 17(4), 31-48.
Immervoll, H. (2007), Minimum Wages, Minimum Labour Costs and the Tax Treatment of Low-Wage Employment, IZA Discussion Paper. Bonn: Forschungsinstitut zur Zukunft der Arbeit (Institute for the Study of Labor).
Johnson, W.R., E.K. Browning (1983), The distributional and efficiency effects of increasing the minimum wage: a simulation. American Economic Review 73(1), 204-211.
Kakwani, N. (1980), On a class of poverty measures. Econometrica 48(2), 437-446.
Kalina, T. and C. Weinkopf (2007), Einführung eines gesetzlichen Mindestlohnes in Deutsch-land – Eine Modellrechnung für das Jahr 2004, Institut Arbeit und Technik (IAT), Jahr-buch 2006. Gelsenkirchen: Institut für Arbeit und Technik (IAT), 97-109.