O
n March 11, 2010, President Barack Obama issued an executive order creat-ing the National Export Initiative (NEI), which aims to double U.S. exports over the next fi ve years in support of 2 million jobs here at home.Th e NEI recognizes that exports will play a critical role in catalyzing America’s near- and long-term economic growth, and it represents the fi rst time the United States will have a governmentwide export promotion strategy with focused attention from the president and his Cabinet.
Th e report that follows is an analytical complement to the NEI, demonstrating the fundamental role that exports already play in the U.S. economy and provid-ing the methodological framework that will be used to track progress in meeting the president’s goals.
As the report lays out, in 2008 exports represented 12.7 percent of U.S. gross domestic product (GDP), the highest level in almost a century. Th ese exports supported jobs for over 10 million Americans, mak-ing very clear that our ability to access and compete in global markets is an integral part of economies in cities and towns across the country—and became more so in the years leading up to the worldwide re-cession. Despite sluggish economywide job growth between 2003 and 2008, export-related jobs actually increased by nearly 3 million during this period.
It is important to note that the increase in export-supported jobs occurred despite the fact that the
U.S. government lacked a comprehensive export policy, and while the budget for export promotion activities was fl at. Enhanced trade promotion ef-forts, like those described in the NEI, will help speed a return to pre-recession export levels.
An additional fi nding of this report is the role that exports play in supporting a healthy, vibrant manufacturing sector. Indeed, the nearly 3.7 million manufacturing jobs supported by exports contribute to 27 percent of all employment in the manufactur-ing sector. Th is report suggests that success in sup-porting American manufacturing is fundamentally dependent on a successful export policy.
Th e report also highlights the broader implications of exports for our economic well-being. Exports are concentrated in sectors, such as manufacturing, that are a critical source of the productivity gains that increase living standards for Americans throughout the country. Now more than ever, exports are central to a strong U.S. economy.
Th e year 2009 was a diffi cult one for the global econ-omy, which hit U.S. exporters and their employees particularly hard. Th is report clearly illustrates that recovery in our economy, employment, productiv-ity, and manufacturing is tied to our ability to drive export competitiveness. For this reason, the chal-lenge presented by the president’s NEI is crucial to U.S. economic success, both in the short term and for years to come.
Exports Support American Jobs
Updated measure will quantify progress as global
economy recovers.
This summary describes a report on trade and the U.S. economy published by the International Trade Administration, a unit of the U.S. Department of Commerce. It was written in collaboration with the Department of Commerce’s Economics and Statistics Administration. For more information, contact the International Trade Administration, www.trade. gov; or the Economics and Statistics Administration, www.esa.gov.
U.S. Department of Commerce
International Trade Administration
Th is examination of the relationship between U.S. exports and the jobs they support covers 1993–2008, with preliminary estimates for 2009 and 2010. Th e report shows the following information:
• Exports of goods and services supported 10.3 mil-lion jobs in 2008.
• Export-supported jobs accounted for 6.9 percent of total U.S. employment in 2008. Th e value of total ex-ports, as measured in this study, totaled nearly $1.7 trillion—or nearly $165,000 per export job in 2008.
• Additional analyses indicate that the number of jobs supported by exports declined sharply in 2009 from 2008. Th e drop refl ected a large decrease in the nominal value of exports and a modest gain in the ratio of exports per job. Th e yearly movements in the ratio strongly correlate with that of nominal labor productivity (nominal output per hour) and with capacity utilization in the manufacturing sector.
• Further analyses indicate that the value of exports per job will increase from $175,000 to $185,000 in 2010. Regression analyses, combined with forecasts
of nominal productivity and capacity utilization, yield the lower bound of the range. Extending trend growth of 5.9 percent per year suggests the upper bound.
Francisco J. Sánchez
Under Secretary for International Trade U.S. Department of Commerce
Gary F. Locke
Secretary
I
n 2008, U.S. exports supported more than 10 million full- and part-time jobs during a histor-ic time, when exports as a percentage of gross domestic product (GDP) reached the highest levels since 1916. Th e new record, 12.7 percent, shows that the upward growth of trade in an expanding global market holds great opportunities for U.S. businesses whose leaders are thinking strategically about the future growth of their companies. Th e importance of exports and trade in the U.S. economy was acceler-ating during the past 7 years, but was interrupted by the economic downturn that began in December 2007. Because of the weak global economy, exports and export-supported jobs dropped sharply through the fi rst half of 2009; however, they began to recover in the second half. Government and private-sector economists expect that the recovery in exports will continue in 2010 and beyond, which will increase the opportunities for U.S. businesses to grow.For government and business leaders to chart their way forward, they must measure the importance of exports in the national economy by using generally accepted tools. In an analysis by the Department of Commerce’s Economics and Statistics tion (ESA) and the International Trade Administra-tion (ITA), this interagency white paper fi nds that the value of exports to support one job will increase
to as much as $185,000 in 2010. Th at fi gure was last offi cially estimated in 1996 at $92,000 per job and refl ects the high and increasing productivity of the U.S. workforce in exported-related production.
Th is report represents the work of a panel of experts from several government agencies, led by the Work-ing Group on Analysis and Data of the Trade Promo-tion Coordinating Committee (TPCC). Th is group included representatives of 20 federal agencies and was chaired by Mark Doms, chief economist at the
U.S. Department of Commerce, and David Walters, chief economist in the Offi ce of the U.S. Trade Representative. Among the other participat-ing agencies were the Department of Agriculture’s Economic Research Service and Foreign Agricul-tural Service, the Export–Import Bank of the United States, U.S. International Trade Commission, and the U.S. Small Business Administration.
Th is examination of the relationship between U.S. exports and the jobs they support covers 1993–2008, with preliminary estimates for 2009 and 2010. Table 1 shows the following information:
• Exports of goods and services supported 10.3 mil-lion jobs in 2008.
• Export-supported jobs accounted for 6.9 percent of total U.S. employment in 2008. Th e value of total
Exports Support American Jobs
Updated measure will quantify progress as global
economy recovers.
by John Tschetter
This report is one in series of papers on trade and the U.S. economy published by the International Trade Administration, a unit of the U.S. Department of Commerce. It was written in collaboration with the Department of Commerce’s Economics and Statistics Administration. For more information, contact the International Trade Administration, www.trade. gov; or the Economics and Statistics Administration, www.esa.gov.
U.S. Department of Commerce
International Trade Administration
International Trade Research Report no. 1
John Tschetter is an economist in the U.S. Department of Commerce’s Economics and Statistics Administration.
exports, as measured in this study, totaled nearly $1.7 trillion—or nearly $165,000 per export job in 2008.
• Additional analyses indicate that the number of jobs supported by exports declined sharply in 2009 from 2008. Th e drop refl ected a large decrease in the nominal value of exports and a modest gain in the ratio of exports per job. Th e yearly movements in the ratio strongly correlate with that of nominal labor productivity (nominal output per hour) and with capacity utilization in the manufacturing sector.
• Further analyses indicate that the value of exports per job will increase from $175,000 to $185,000 in 2010. Regression analyses, combined with forecasts of nominal productivity and capacity utilization, yield the lower bound of the range. Extending trend growth of 5.9 percent per year suggests the upper bound.
Methodology and Caveats
Researchers have used widely diff erent forms of economic analyses to demonstrate the relationship between exports and jobs. Th is study uses input–out-put (IO) analysis to measure the links for 1993–2008. IO analysis, sometimes referred to as interindustry analysis, is an economic tool that measures the rela-tionships between various industries in the econo-my.1 Th is research uses a time series of IO matrixes
that provide detailed and consistent information on the fl ow of goods and services that make up the pro-duction processes of U.S. industries.2 Findings refl ect
the number of jobs supported across the entire chain of export production, such as material and service inputs, fi nal assembly, and transportation. Th e em-ployment numbers are annual snapshots of the size of export contribution to overall employment. It is important to note the following:
• Th ese snapshots refl ect average (sometimes labeled accounting) relationships. In IO analyses, if 10 percent of an industry output is exported, then 10 percent of the industry’s employment is
attrib-Number (thousands)
Table 1. Jobs Supported by Exports
Source: U.S. Department of Commerce, Bureau of Economic Analysis. Jobs supported by
exports in 2008 Exports in 2008(billions of dollars)
Percent of employment
Value of exports per job
2008 ratio (thousands of dollars)
Percent change, 2002–2008
Total
Goods
Services
10, 293 6.9 1,694 165 5.9
7,525 5.0 1,132 150 6.5
2, 768 1.9 562 203 4.3
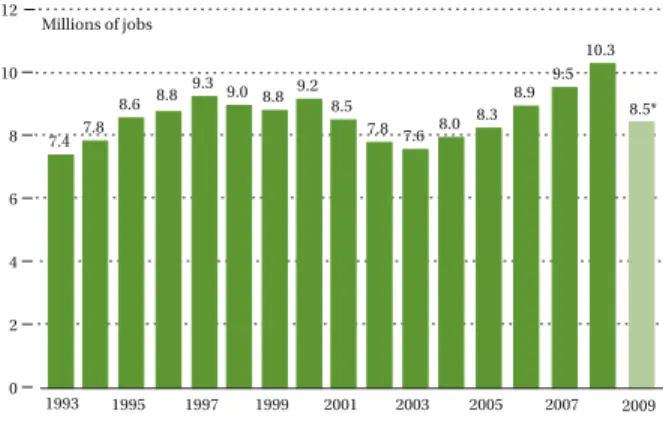
Figure 1.Jobs Supported by Exports of Goods and Services, 1993–2009
Millions of jobs
1993 1995 1997 1999 2001 2003 2005 2007 2009 0
2 4 6 8 10 12
7.4 7.8
8.6 8.8 9.3 9.0 8.8 9.2 8.5
7.8 7.6 8.0 8.3 8.9 9.5
10.3
8.5*
Estimates compiled by U.S. Department of Commerce, Office of the Chief Economist. * Note: 2009 is a preliminary estimate.
Share of GDP
Share of employment
1993 1996 1999 2002 2005 2008
0 2 4 6 8 10 12 14
Figure 2. Export Share of GDP and Employment, 1993–2008
Estimates compiled by U.S. Department of Commerce, Office of the Chief Economist. Note: data for 2009 are preliminary estimates.
International Trade Research Report no. 1: Exports Support American Jobs
3
uted to exports. Th e averages tell us nothing about employment requirements for the fi rst or last dollar of output.
• Averages derived from IO analysis should not be used as proxies for change. Th ey should not be used to estimate the net change in employment that might be supported by increases or decreases in total exports, in the exports of selected products, or in the exports to selected countries or regions.
• Th e averages are not proxies because the number of jobs supported by exports usually does not change at the same rate as export value. Th e rate is not the same because other factors, such as prices, resource utilization, business practices, and productivity, do not usually change at the same rate. In addition, the material and service inputs and the labor and capital inputs diff er signifi cantly across types of exports. For example, the labor requirements for an exported aircraft are signifi cantly diff erent from those of an exported agricultural product or an educational service.
Th e fi ndings shown in Table 1 take all those factors into account. Th e ratio of exports per job for total exports was $165,000 in 2008. Th is ratio varied from $150,000 for goods to $203,000 for services. Th e ratio for total exports grew 5.9 percent per year from 2002 to 2008, a period of strong export growth. Th e ratio for goods grew 6.5 percent per year during that period, which is faster than the 4.3 percent increase for services.
Th e ratios refl ect the stages of the business cycle in which they occurred. Th ey are directly aff ected by changes in aggregate output, including the output for exports, which infl uence the size of the overall workforce, employment, and unemployment. During periods of slack business activity, increased output, such as exports, would tend to increase employ-ment, to lower unemployemploy-ment, and to increase labor force participation. Conversely, during periods of high business activity, when industry operates at
Figure 3. Exports of Goods and Services as Percent of GNP or GDP, 1869–2009 (national income accounts basis)
1869 1879 1889 1899 1909 1919 1929 1939 1949 1959 1969 1979 1989 1999 2009 0
2 4 6 8 10 12 14
as percent of GDP (1929–2009) as percent of GNP (1889–1929)
Estimates compiled by U.S. Department of Commerce, Office of the Chief Economist.
10-year averages (GNP, 1869–1889)
Thousands of dollars
0 50 100 150 200
84 86 89 92 96 99104
109 110117 124134
143150 158165
185
1993 1996 1999 2002 2005 2008 2010 175
Figure 4.Value of Exports per Job, 1993–2010: Total Exports
Estimates compiled by U.S. Department of Commerce, Office of the Chief Economist. Note: Data for 2009 and 2010 are preliminary estimates.
Index (1993 = 100, ratio scale)
1993 1996 1999 2002 2005 2008
0 100 120 140 160 180 200 220
Export value per job
Nominal nonfarm business productivity (nominal output per hour)
Figure 5. Exports per Job and Nominal Productivity, 1993–2008
or near full capacity and employment, increased output, including output for exports, tends to raise employment less—if at all—and instead mainly shifts employment to industries that pay higher wages.
Th e fi ndings presented in this paper are only snapshots of the relationships between exports and employment. Th e fi gures do not illustrate other im-portant dynamic links. Th e most important contribu-tion of exports (and imports) to the U.S. economy is its role in increasing the industrial effi ciency and standard of living of the United States. International trade encourages structural changes in domestic in-dustries that, in turn, result in increased effi ciencies, economies of scale, and more productive invest-ments that enhance the competitiveness of foreign and U.S. producers alike.
Findings
Exports of goods and services supported a record 10.3 million jobs in 2008 (see Figure 1). Th e number of jobs supported by exports has been increasing since 2003, when exports supported 7.6 million jobs.
Preliminary estimates suggest, however, that export-supported employment fell sharply in 2009 to 8.5 million. Th e drop refl ects a 15-percent decline in nominal value of exports and a 4.3 percent increase in nominal productivity (nominal output per hour) in the nonfarm business sector. However, 2009 in-cluded a shift in the growth of nominal exports from a decline during the fi rst half to a gain in the second half. It is widely expected that the recovery will con-tinue in 2010 and beyond.
Jobs supported by exports accounted for 6.9 percent of total employment in 2008. Th is share has fl uctu-ated within a narrow range over time (see Figures 2 and 3).
Th e value of exports totaled nearly $1.7 trillion in 2008 (as measured in the IO framework, see appen-dix A for historical series) or 11.9 percent of GDP (see
Manufacturing 36%
Transport and warehousing Wholesale trade
Financial activity Agriculture
Information Leisure and hospitality
Government Retail trade (1%)
Other industries
11% 10% 6% 4% 3%
3%2% 4%
Figure 7. Export-supported Jobs in 2008, by Major Industry
Estimates compiled by U.S. Department of Commerce, Office of the Chief Economist. Professional and
business services 20 %
Percentage of total export-supported jobs
1993 1996 1999 2002 2005 2008 0
10 20 30 40 50
Professional and business services Manufacturing
Figure 8. Export-supported Jobs in Manufacturing and Professional and Business Services, 1993–2008
Estimates compiled by U.S. Department of Commerce, Office of the Chief Economist.
1993 1996 1999 2002 2005 2008
98 100 102 104 106 108 110
72 74 76 78 80 82 84 Figure 6.Ratio of Exports per Job to Nominal Productivity and Capacity Utilization, 1993–2008
Estimates compiled by U.S. Department of Commerce, Office of the Chief Economist.
Left scale: Ratio of exports per job to nominal productivity (1993 = 100)
Right scale: Capacity utilization in manufacturing
International Trade Research Report no. 1: Exports Support American Jobs
5
Figure 2). Figure 3 (on page 3) shows that the export share of GDP in 2009 was a historical record dating back to the 1870s. Figure 3 also shows that the share generally went up during the past six decades, with some large swings in the middle.
Th e ratio of export-supported employment to total employment is smaller than the ratio of exports to GDP (Figure 3). Th e smaller employment ra-tio refl ects that a signifi cant porra-tion of exports is produced in the manufacturing sector. Productivity levels in the manufacturing sector are well above the economy-wide average, and a signifi cant share of the material and service inputs to manufacturing is imported. Both factors reduce the labor intensity of exports relative to labor intensity of other spending categories, such as consumer spending for services and residential construction.
Figure 4 shows that the value of exports per job was $165,000 in 2008. Th is ratio has trended steadily up since 2002, growing 5.9 percent per year from 2002 to 2008. Th e ratio began to accelerate in 2001.
Figure 5 shows that the ratio of exports per job (shown as an index) has gone up at about the same pace as nominal productivity in the nonfarm busi-ness sector. Nominal productivity is the ratio of nominal output to hours worked. Th e strong upward trends shown in Figure 5 are favorable long-term developments because they underlie the growth of the nation’s living standards.
Figure 6 shows that medium-term variations in the two series refl ect, in part, the movements in capacity use in the manufacturing sector.
Analyses by the Offi ce of the Chief Economist sug-gest that the value of exports per job increased from $170,000 to $175,000 in 2009 and will increase to $185,000 in 2010 (see Figure 4).
Regression analyses that related the yearly move-ments in the ratio of exports per job to nominal
Manufacturing Transport and warehousing Agriculture Wholesale trade Mining Professional and business services Information Financial activity Utilities Average for all sectors Leisure and hospitality Other industries
0 5 10 15 20 25 30
27 23 19 17 11 11 10 7 7 7 2 1
Figure 9.Shares of Industry Jobs Supported by Exports in 2008
Estimates compiled by U.S. Department of Commerce, Office of the Chief Economist.
Percentage of industry employment
Percentage of total manufacturing employment
1993 1996 1999 2002 2005 2008
0 5 10 15 20 25 30
Figure 10. Export-supported Jobs in Manufacturing, 1993–2008
Estimates compiled by U.S. Department of Commerce, Office of the Chief Economist.
Millions of jobs
1993 1995 1997 1999 2001 2003 2005 2007 2009 0
2 4 6 8 10 12
6.0 6.3
6.9 7.0 7.4 7.1 6.9 7.2 6.6
5.9 5.7 5.9 6.1 6.6 6.9
7.5 6.0* Figure 11.Jobs Supported by Exports of Goods, 1993–2009
Estimates compiled by U.S. Department of Commerce, Office of the Chief Economist. * Note: 2009 is a preliminary estimate.
productivity and capacity use in manufacturing, combined with forecasts of the productivity and use series,3 yield the lower part of the range.
Export-Supported Jobs by
Industry
More than half of the 10.3 million jobs supported by exports in 2008 occurred in two industries: (a) manu-facturing and (b) professional or business services. Export-supported manufacturing jobs totaled nearly 3.7 million, or 36 percent of the total jobs supported by exports (see Figure 7). Export-supported jobs in professional and business services totaled nearly 2.1 million, or 20 percent of the total.
Manufacturing’s share has gone modestly down since 1993, while the share of professional and busi-ness services has gone modestly up (see Figure 8). Th e nearly 3.7 million manufacturing jobs supported by exports in 2008 accounted for 27 percent of all jobs in the manufacturing sector (see Figure 9).
Exports also accounted for signifi cant shares of employment within transport and warehousing (23 percent), agriculture (19 percent), and wholesale trade (17 percent).
Th e export-supported share of total manufacturing jobs rose to a record in 2008 from the 1993–2004 av-erage of about 20 percent (see Figure 10). Th at share refl ects jobs supported by total exports of goods and services, including manufactured goods. Th e increase occurred because of strong foreign demand for U.S. goods and sluggish domestic demand.
Th e export-supported share likely fell in 2009 be-cause exports fell 19 percent while manufacturing shipments excluding exports dropped by 15 percent. However, the share started to recover as the year pro-gressed. Exports of manufactured goods increased 19 percent from their low in April 2009, while shipments excluding exports rose by a much smaller 4 percent. Millions of jobs
Manufacturing Professional and business services Wholesale trade Transport and warehousing Agriculture Financial activity Leisure and hospitality Information Other industries
0 1 2 3 4
3.5 1.2
1.0 0.5 0.4 0.2 0.2 0.1
0.5
Figure 12.Jobs Supported by Exports of Goods in 2008, by Major Industry
Estimates compiled by U.S. Department of Commerce, Office of the Chief Economist.
Millions of jobs
1993 1995 1997 1999 2001 2003 2005 2007 2009 0
0.5 1.0 1.5 2.0 2.5 3.0
1.4 1.6
1.7 1.7 1.8 1.9 1.9 1.9 1.9 1.9 1.9 2.1 2.2
2.4 2.6
2.8 2.5* Figure 13.Jobs Supported by Exports of Services, 1993–2009
Estimates compiled by U.S. Department of Commerce, Office of the Chief Economist. * Note: 2009 is a preliminary estimate.
0 0.2 0.4 0.6 0.8 1.0 0.9
0.7
0.4
0.2
0.2
0.1
0.1
0.2
Figure 14.Jobs Supported by Exports of Services in 2008, by Major Industry
Estimates compiled by U.S. Department of Commerce, Office of the Chief Economist. Millions of jobs
Professional and business services
Manufacturing Transport and warehousing
Government Financial activity
Leisure and hospitality Information
International Trade Research Report no. 1: Exports Support American Jobs
7
Jobs Supported by Exports of
Goods
In 2008, exported goods (including manufactured goods) supported 7.5 million, or 73 percent, of the 10.3 million jobs supported by total exports (see Figure 11).
Th e number of jobs supported by exports of goods has been increasing since 2003. But again, available data, including a 20 percent drop in nominal exports of goods, suggest that the number fell sharply in 2009 from the 2008 level.
Of the 7.5 million jobs supported by exports of goods in 2008, 3.5 million (or 47 percent) occurred in manufacturing (see Figure 12). Goods exported include agricultural products, raw materials, and manufactured goods.
Th e export of goods also supported 1.2 million jobs in professional and business services and 1 million jobs in wholesale trade.
Jobs Supported by the Exports of
Services
Exported services supported 2.8 million jobs, or 27 percent, of all jobs supported by exports (see Figure 13).
Th e number of jobs supported by service exports has been increasing since 1993 (the starting point for these estimates). But again, available data, including a 7 percent drop in the nominal exports of services, suggest that the number fell in 2009.
Of the 2.8 million jobs, 0.9 million, or 32 percent, were in professional and business services (see Figure 14).
A Comparison: Goods Exports per
Job and Service Exports per Job
Th e value of goods exports per job was nearly $150,000 in 2008 (Figure 15). Th e ratio of serviceThousands of dollars
1993 1996 1999 2002 2005 2008
0 75 150 225
72 75 78 81
85 87 91 96 97 103 111
120 129
137 146 150 200
100
50
Figure 15.Value of Exports per Job for Goods, 1993–2008
Estimates compiled by U.S. Department of Commerce, Office of the Chief Economist.
Thousands of dollars
1993 1996 1999 2002 2005 2008
0 75 150 225
130 130 133 138 141 142
147 156 154 157 163 172
180 185 192
203 Figure 16.Value of Exports per Job for Services, 1993–2008
Estimates compiled by U.S. Department of Commerce, Office of the Chief Economist.
200
100
exports per job was much higher at $203,000 (Figure 16).
Th e ratio for service exports is boosted signifi -cantly by services such as professional and business services, which include the leasing of nonfi nancial intangible assets; the management of companies; and architectural, engineering, and related services.
Th e ratio for goods exports per job grew 6.5 percent per year from 2002 to 2008, which is faster than the 4.3-percent growth for service exports per job. Th e growth in the ratio for goods exports was boosted by the productivity gains posted within the manufactur-ing sector and by the expandmanufactur-ing—and important— role played by imports in manufactured goods.
International Trade Research Report no. 1: Exports Support American Jobs
9
Year Value of exports (billions of dollars)
Jobs supported by exports (thousands of jobs)
Total Goods Services Total Goods Services
1993 617.9 429.8 188.1 7,394.5 5,950.7 1,443.8
1994 675.3 473.4 201.9 7,839.5 6,289.3 1,550.2
1995 759.2 539.6 219.7 8,568.1 6,911.4 1,656.7
1996 809.3 571.4 237.9 8,768.6 7,042.9 1,725.7
1997 890.6 633.7 256.9 9,245.8 7,425.0 1,820.8
1998 886.1 621.9 264.2 8,970.6 7,109.1 1,861.5
1999 911.8 628.4 283.4 8,806.0 6,879.8 1,926.2
2000 996.3 692.4 303.9 9,171.5 7,225.8 1,946.0
2001 935.1 641.5 293.6 8,514.2 6,607.1 1,907.1
2002 909.5 608.5 301.0 7,802.4 5,890.3 1,912.1
2003 937.7 629.7 307.9 7,566.2 5,671.3 1,894.9
2004 1,062.1 706.3 355.8 7,949.9 5,883.1 2,066.9
2005 1,177.6 782.6 385.0 8,249.6 6,052.4 2,197.2
2006 1,338.2 900.2 438.0 8,949.8 6,575.7 2,374.1
2007 1,510.4 1,008.2 502.2 9,539.7 6,920.1 2,619.6
2008 1,693.6 1,131.5 562.1 10,293.4 7,525.3 2,768.1
Appendix A: Exports of Goods and Services and Jobs Supported by Them, 1993–2008
T
he following highlights the methodology and caveats of the IO-based fi gures. Th is research is based on the IO framework. Th e Bureau of Labor Statistics (BLS) developed and pub-lished the accounts used in this research.Th e BLS Web site at www.bls.gov provides fi les of IO data for the U.S. economy from 1993 to 2008. Th e IO tables produced by the BLS are derived from IO data initially developed by the Bureau of Economic Analysis (BEA).
Th e BLS IO accounts provide detailed, consistent in-formation on the fl ow of goods and services that are involved in the production processes of industries. For each year, the accounts show how industries in-teract as they provide inputs to and use outputs from each other to produce GDP.
IO accounts begin with make and use tables. Th e make table shows the commodities produced by each industry. Th e use table shows the inputs to industry production and the commodities consumed by fi nal users (including exports to foreign custom-ers).
Requirements tables are derived from the make and use tables. Th e direct requirements table shows the amount of a commodity that is required by an industry to produce a dollar of the industry’s output. A total requirements table shows the production required, directly and indirectly, from each industry and commodity to deliver a dollar of a commodity to fi nal users. A domestic requirements table shows the domestic output of goods and services required to meet fi nal demand (including exports). To calcu-late the domestic output requirements, one must subtract imports from the use table before calculat-ing the total requirements matrix. Th is subtraction is made for each industry. Th e ratio for the subtraction
is the value of imports over domestic supply:
Import ratio = Imports / (Commodity output – Imports + Exports) (1)
BLS published an additional table of domestic em-ployment requirements. Th e table shows the direct and indirect eff ect of changes in fi nal demand on employment. Th e changes stem from the domestic requirements tables. First, a ratio for jobs per dollar of output was calculated. Th is ratio was then ap-plied to the domestic output requirement for each industry to derive the employment requirement. Th e requirement was found by multiplying the indus-try employment ratio with the respective domestic requirements data contained in each row.
Employment in the requirements tables is based on a count of jobs. Th e job count includes wage and salaried workers, self-employed workers, and unpaid family workers.
Th e jobs in this research are not full-time equivalents (FTEs). FTEs are estimates for adjusted industry em-ployment for the mix of full- and part-time workers. BLS’s IO accounts include substantial detail on more than 200 industries (including 84 manufacturing industries) and more than 200 categories of fi nal demand (including exports of goods and services).
BLS data for exports of goods and services can be regrouped to allow estimates of jobs supported by exports of goods, services, manufactured items, agri-cultural products, and other sources.
BLS focuses on employment outlook by industry and occupations for the next decade (2008–18). Th e November issue of the Monthly Labor Review presents fi ve comprehensive articles that describe the outlook.4
International Trade Research Report no. 1: Exports Support American Jobs
11
BLS makes the underlying data and methodology of these projections available to researchers. Th e details include time series of industry output and employ-ment and interindustry relationships, including fi nal demand expenditures and IO matrixes.
BLS presents the formulas for calculating the require-ment matrixes in “Employrequire-ment Outlook: 2008–2018,” which is available on its Web site. Th e fi nal demand and employment requirement matrixes were critical components of the fi ndings.
Exports in this study refl ect IO concepts and, as a result, exclude reexports and reimports of goods. Re-exports are foreign-origin goods that have previously entered the United States and, at the time of exporta-tion, have undergone no change in form, condiexporta-tion, or enhancement in value by further manufacturing in the United States. Reimports are U.S. merchandise that has been returned. Exports of military goods are included in goods exports.
Exports are measured by their value at the point of leaving the country and are equivalent to their pur-chase price. Th e national income accounts and the U.S. Census Bureau data on exports of goods are also measured at the value leaving the country.
IO analysis, however, shows exports at producer prices, and the transportation costs and margins re-quired to move the export to the port are included in the respective commodities for transport and trade.
Th is paper’s introduction highlighted a number of caveats to IO analyses, including the following:
• IO analyses (and this analysis) refl ect average (sometimes labeled accounting) relationships. If 10 percent (or 20 percent) of an industry output is ex-ported, then 10 percent (or 20 percent) of its employ-ment is attributed to exports. Th ose averages tell us nothing about employment requirements for the fi rst or last dollar of output.
• Th e fi ndings are sensitive to numerous factors,
including macroeconomic developments. Th ose developments include the pace of overall economic growth; the degree of resource use; and the pace of productivity growth and industry-level develop-ments, such as the speed of innovation, attitudes toward out- and in-sourcing shifts, and the use of imports as material and service inputs.
BLS IO and fi nal demand data do not refl ect the BEA Comprehensive National Income and Product Ac-counts revisions that were published in July 2009. Th e data also do not refl ect BLS’s annual revisions to the nonfarm payroll employment that were published in February 2010. Because BLS published its projections of industry and occupational employment every other year, the analyses presented in this white paper will not be updated until November 2011.
End Notes
1. Th e Department of Commerce has published previous IO analyses of jobs supported by exports. Th is research updates Lester A. Davis, “U.S. Jobs Supported by Goods and Services, 1983–1994,” U.S. Department of Commerce, Economics and Statistics Administration, November 1996. Th e U.S. Census Bureau also produces reports on jobs sup-ported in each state by exports of manufacturing goods. One example is the“Exports from Manufacturing Establish-ments: Preliminary Report for 2006,” U.S. Census Bureau, April 2008.
2. Th e Bureau of Labor Statistics published this time series of IO tables, industry and commodity output, and employ-ment in December 2009. For more information, see http:// stats.bls.gov/news.release/ecopro.toc.htm and http://bls.gov/ emp. Th e Offi ce of the Chief Economist took great advantage of the considerable eff orts by the Bureau of Labor Statistics. Th e fi nal demand and employment requirement matrixes were critical components of the fi ndings.
3. Macroeconomic Advisers (“Outlook Commentary,” February 2010) forecasted a 4.2 percent increase in nominal nonfarm business productivity (output per hour) in 2010 and a recovery of manufacturing capacity use from 66.8 percent in 2008 to 70.6 percent in 2010.
4. BLS projections were summarized by Kristina J. Bartsch, “Th e Employment Projections for 2008–18,” Monthly Labor Review 132, no. 11 (November 2009): 3–11.
1401 Constitution Ave., NW Washington, DC 20230 T 202.482.3809 F 202.482.5819
www.trade.gov
The International Trade Administration’s mission is to create prosperity by strengthening the competitiveness of U.S. industry, promoting trade and invest-ment, and ensuring fair trade and compliance with trade laws and agreements.