August 2013
National Inpatient Hospital Costs: The Most
Expensive Conditions by Payer, 2011
Celeste M. Torio, Ph.D., M.P.H. and Roxanne M. Andrews, Ph.D.
Introduction
Health care costs continue to grow faster than the economy, and the health share of the Gross Domestic Product (GDP) has maintained its upward trend, reaching 17.9 percent in 2011.1 Policymakers are among those who are increasingly concerned with the growing burden of medical care expenses to governments, consumers, and insurers. Hospital costs are often the focus of this concern, because they constitute the largest single component of health care spending.2
This Statistical Brief presents data from the Healthcare Cost and Utilization Project (HCUP) on costs of inpatient hospital stays in the United States in 2011. This report describes the distribution of costs by expected primary payer and illustrates the conditions accounting for the largest percentage of each payer’s hospital costs. The primary payers examined are Medicare, Medicaid, private insurance, and the uninsured. The hospital costs represent the hospital's cost to produce the services—not the amount paid for services by payers—and they do not include the physician fees associated with the hospitalization. All differences between
estimates noted in the text are statistically significant at the .05 level or better.
Findings
Hospital costs by primary payer, 2011
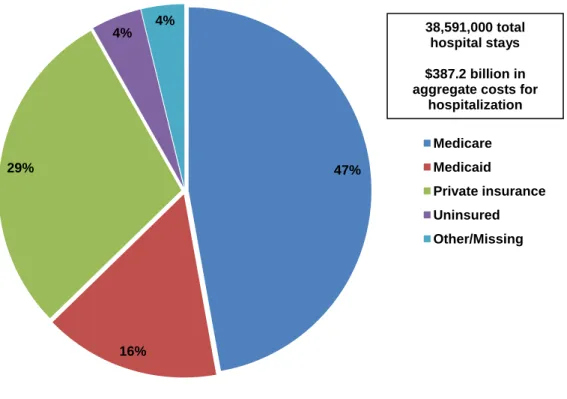
In 2011, the aggregate cost for nearly 39 million hospital stays totaled $387 billion. Medicare and Medicaid bore responsibility for 63 percent of the national inpatient hospital costs (Figure 1). Medicare incurred approximately $182.7 billion in aggregate hospital costs in 2011 for 15.3 million hospital stays, representing 47.2 percent of the total aggregate costs.
During the same time period, Medicaid incurred approximately $60.2 billion in aggregate hospital costs for 7.6 million hospital stays, representing 15.6 percent of the total aggregate costs. Private insurance incurred approximately $112.5 billion in
aggregate hospital costs in 2011, representing 29.0 percent of the total aggregate costs for 12.2 million
1
Centers for Medicare & Medicaid Services. National Health Expenditure Accounts. http://www.cms.gov/Research-Statistics-Data-and-Systems/Statistics-Trends-and-Reports/NationalHealthExpendData/NationalHealthAccountsHistorical.html . Accessed July 17,
HEALTHCARE COST AND UTILIZATION PROJECT
Agency for Healthcare Research and Quality
Highlights
■ In 2011, the aggregatehospital cost for nearly 39 million hospital stays totaled $387 billion.
■ The top five conditions— septicemia; osteoarthritis; complication of device, implant or graft; liveborn (newborn) infants; and acute myocardial infarction—accounted for nearly one-fifth of the total aggregate cost for
hospitalizations.
■ The primary payer shares of the total aggregate hospital costs were 63 percent for Medicare ($182.7 billion) and Medicaid ($60.2 billion), 29 percent for private insurance ($112.5 billion), and 4 percent ($17.1 billion) for uninsured hospitalizations.
■ Septicemia ranked in the top four most costly conditions in the hospital for all four payer groups.
■ Hospitalizations associated with pregnancy and childbirth accounted for 7 of the top 20 most expensive conditions for hospital stays covered by Medicaid.
■ Complications of surgical procedures or medical care was a top-ranked condition for stays covered by Medicare, Medicaid, and private insurance.
hospital stays. The uninsured accounted for 4.4 percent ($17.1 billion) of the total aggregate costs for 2.1 million stays.
Figure 1. Distribution of national inpatient hospital costs by primary payer, 2011
Source: Agency for Healthcare Research and Quality (AHRQ), Center for Delivery, Organization, and Markets, Healthcare Cost and Utilization Project (HCUP), Nationwide Inpatient Sample (NIS), 2011
47%
16% 29%
4% 4%
Medicare Medicaid
Private insurance Uninsured Other/Missing 38,591,000 total hospital stays $387.2 billion in aggregate costs for
Most expensive conditions treated in U.S. hospitals, 2011
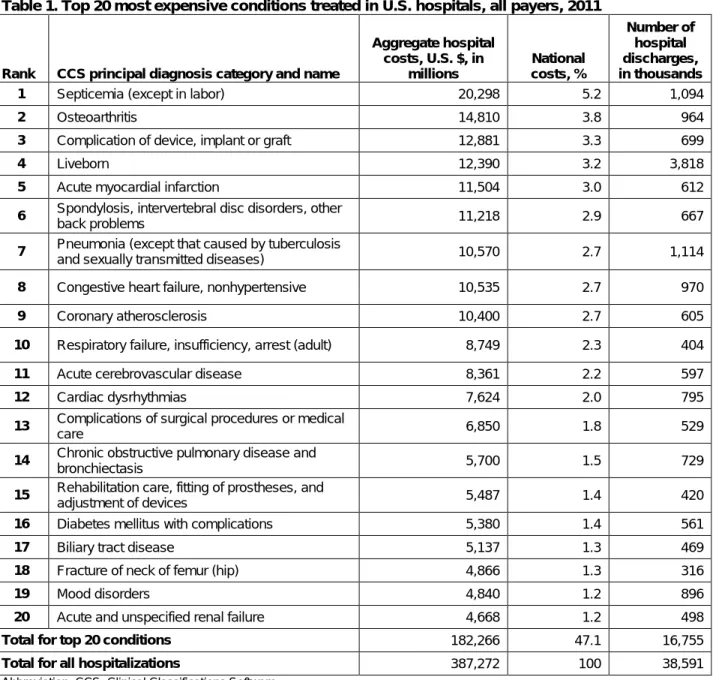
In 2011, 47.1 percent of aggregate hospital costs were for the top 20 most expensive conditions (Table 1). The top five conditions accounted for nearly one-fifth of the total aggregate costs for all
hospitalizations (18.5 percent). Septicemia resulted in an aggregate cost of $20.3 billion or 5.2 percent of the total aggregate cost for all hospitalizations and was the most expensive condition treated. Other high-cost hospitalizations were for osteoarthritis; complication of device, implant or graft; liveborn (newborn) infants; and acute myocardial infarction (heart attack).
Table 1. Top 20 most expensive conditions treated in U.S. hospitals, all payers, 2011
Rank
CCS principal diagnosis category and name
Aggregate hospital costs, U.S. $, in
millions
National costs, %
Number of hospital discharges, in thousands
1 Septicemia (except in labor) 20,298 5.2 1,094
2 Osteoarthritis 14,810 3.8 964
3 Complication of device, implant or graft 12,881 3.3 699
4 Liveborn 12,390 3.2 3,818
5 Acute myocardial infarction 11,504 3.0 612
6 Spondylosis, intervertebral disc disorders, other
back problems 11,218 2.9 667
7 Pneumonia (except that caused by tuberculosis
and sexually transmitted diseases) 10,570 2.7 1,114
8 Congestive heart failure, nonhypertensive 10,535 2.7 970
9 Coronary atherosclerosis 10,400 2.7 605
10 Respiratory failure, insufficiency, arrest (adult) 8,749 2.3 404
11 Acute cerebrovascular disease 8,361 2.2 597
12 Cardiac dysrhythmias 7,624 2.0 795
13 Complications of surgical procedures or medical
care 6,850 1.8 529
14 Chronic obstructive pulmonary disease and
bronchiectasis 5,700 1.5 729
15 Rehabilitation care, fitting of prostheses, and
adjustment of devices 5,487 1.4 420
16 Diabetes mellitus with complications 5,380 1.4 561
17 Biliary tract disease 5,137 1.3 469
18 Fracture of neck of femur (hip) 4,866 1.3 316
19 Mood disorders 4,840 1.2 896
20 Acute and unspecified renal failure 4,668 1.2 498
Total for top 20 conditions 182,266 47.1 16,755
Total for all hospitalizations 387,272 100 38,591
Abbreviation: CCS, Clinical Classifications Software
Source: Agency for Healthcare Research and Quality (AHRQ), Center for Delivery, Organization, and Markets, Healthcare Cost and Utilization Project (HCUP), Nationwide Inpatient Sample (NIS), 2011
Most expensive conditions by primary payer, 2011
Tables 2 through 5 illustrate the 20 most expensive conditions billed to Medicare, Medicaid, private insurance, and the uninsured in 2011.
There were some commonalities across payers in the conditions that generated high costs. For all four payer groups, septicemia ranked among the top four most expensive conditions.
Other conditions that appeared in the top 20 for all four payer groups were: Acute cerebrovascular disease
Pneumonia
Acute myocardial infarction Congestive heart failure Coronary atherosclerosis
Complication of device, implant or graft Respiratory failure, insufficiency, arrest
Several conditions were ranked among the highest cost across three of the four payer groups: Complications of surgical procedures or medical care was top ranked for stays covered by
Medicare, Medicaid, and private insurance.
Diabetes with complications was top ranked for hospitalizations covered by Medicare and Medicaid as well as the uninsured.
Mood disorders and stays for liveborn infants were top ranked for Medicaid, private insurance, and the uninsured.
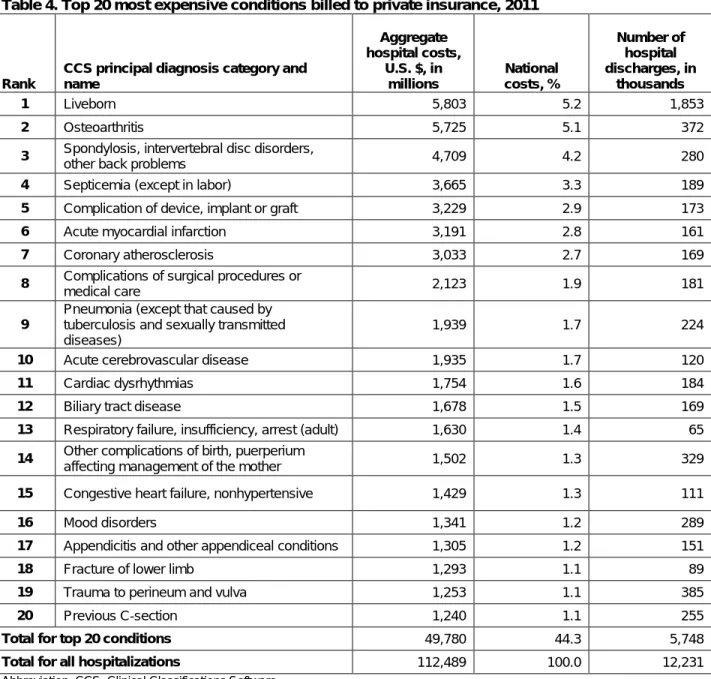
Predictably, given payer differences in demographic mix and service coverage, certain conditions were relatively more prominent in the top ranking of some payer groups than in others. Osteoarthritis was ranked the second most expensive condition only for Medicare ($8.0 billion) and private insurance ($5.7 billion). Over 90 percent of the hospitalizations for osteoarthritis involved a knee or hip replacement. Cardiac dysrhythmias and back problems were also top ranked among hospital stays covered by Medicare and private insurance.
Hospitalizations associated with pregnancy and childbirth accounted for 7 of the top 20 most expensive conditions for hospital stays covered by Medicaid and 4 of the top 20 covered by private insurance. Appendicitis and biliary tract disease were among the most expensive conditions for private payers and for the uninsured. Skin infections were top ranked for hospital stays covered by Medicaid and for the uninsured.
In terms of injury-related hospital stays:
Hip fracture was a top-ranked condition for Medicare.
Fracture of the lower limb was top ranked for private insurance and the uninsured. Intracranial injury and crushing or internal injury was top ranked only for the uninsured. Other conditions seen only in the top 20 most expensive conditions for the uninsured were:
Unspecified chest pain Alcohol-related disorders Pancreatic disorders
Schizophrenia was the only condition that appeared in the top 20 only for Medicaid. Conditions seen only in the top 20 most expensive stays for Medicare included:
Chronic obstructive pulmonary disease Rehabilitation
Acute and unspecified renal failure Heart valve disorder
Urinary tract infections
Intestinal obstruction without hernia
Table 2. Top 20 most expensive conditions billed to Medicare, 2011
Rank
CCS principal diagnosis category and name
Aggregate hospital costs, U.S. $, in
millions
National costs, %
Number of hospital discharges, in thousands
1 Septicemia (except in labor) 12,670 6.9 722
2 Osteoarthritis 7,989 4.4 525
3 Congestive heart failure, nonhypertensive 7,641 4.2 739
4 Complication of device, implant or graft 7,469 4.1 414
5 Pneumonia (except that caused by tuberculosis
and sexually transmitted diseases) 6,709 3.7 667
6 Acute myocardial infarction 6,274 3.4 351
7 Coronary atherosclerosis 5,959 3.3 346
8 Respiratory failure, insufficiency, arrest (adult) 5,487 3.0 263
9 Cardiac dysrhythmias 5,099 2.8 529
10 Acute cerebrovascular disease 4,600 2.5 381
11 Spondylosis, intervertebral disc disorders, other
back problems 4,493 2.5 271
12 Chronic obstructive pulmonary disease and
bronchiectasis 4,074 2.2 517
13 Fracture of neck of femur (hip) 3,959 2.2 261
14 Rehabilitation care, fitting of prostheses, and
adjustment of devices 3,470 1.9 285
15 Complications of surgical procedures or medical
care 3,395 1.9 245
16 Acute and unspecified renal failure 3,167 1.7 346
17 Heart valve disorders 3,085 1.7 76
18 Urinary tract infections 2,712 1.5 406
19 Diabetes mellitus with complications 2,623 1.4 239
20 Intestinal obstruction without hernia 2,304 1.3 200
Total for top 20 conditions 103,178 56.5 7,783
Total for all hospitalizations 182,703 100 15,337
Abbreviation: CCS, Clinical Classifications Software
Source: Agency for Healthcare Research and Quality (AHRQ), Center for Delivery, Organization, and Markets, Healthcare Cost and Utilization Project (HCUP), Nationwide Inpatient Sample (NIS), 2011
Table 3. Top 20 most expensive conditions billed to Medicaid, 2011
Rank
CCS principal diagnosis category and name
Aggregate hospital costs, U.S. $, in
millions
National costs, %
Number of hospital discharges, in thousands
1 Liveborn 5,936 9.9 1,705
2 Septicemia (except in labor) 2,730 4.5 113
3 Complication of device, implant or graft 1,426 2.4 71
4 Mood disorders 1,377 2.3 244
5 Pneumonia (except that caused by tuberculosis
and sexually transmitted diseases) 1,325 2.2 152
6 Schizophrenia and other psychotic disorders 1,230 2.0 130
7 Other complications of birth, puerperium
affecting management of the mother 1,176 2.0 257
8 Respiratory failure, insufficiency, arrest (adult) 1,156 1.9 47
9 Other complications of pregnancy 1,062 1.8 271
10 Previous C-section 1,054 1.8 218
11 Acute cerebrovascular disease 1,043 1.7 45
12 Diabetes mellitus with complications 964 1.6 109
13 Congestive heart failure, nonhypertensive 955 1.6 73
14 Complications of surgical procedures or medical
care 864 1.4 63
15 Acute myocardial infarction 858 1.4 38
16 Trauma to perineum and vulva 755 1.3 240
17 Cardiac and circulatory congenital anomalies 739 1.2 12
18 Other perinatal conditions 734 1.2 33
19 Skin and subcutaneous tissue infections 733 1.2 115
20 Coronary atherosclerosis 716 1.2 46
Total for top 20 conditions 26,832 44.5 3,984
Total for all hospitalizations 60,236 100.0 7,578
Abbreviation: CCS, Clinical Classifications Software
Source: Agency for Healthcare Research and Quality (AHRQ), Center for Delivery, Organization, and Markets, Healthcare Cost and Utilization Project (HCUP), Nationwide Inpatient Sample (NIS), 2011
Table 4. Top 20 most expensive conditions billed to private insurance, 2011
Rank
CCS principal diagnosis category and name
Aggregate hospital costs,
U.S. $, in millions
National costs, %
Number of hospital discharges, in
thousands
1 Liveborn 5,803 5.2 1,853
2 Osteoarthritis 5,725 5.1 372
3 Spondylosis, intervertebral disc disorders,
other back problems 4,709 4.2 280
4 Septicemia (except in labor) 3,665 3.3 189
5 Complication of device, implant or graft 3,229 2.9 173
6 Acute myocardial infarction 3,191 2.8 161
7 Coronary atherosclerosis 3,033 2.7 169
8 Complications of surgical procedures or
medical care 2,123 1.9 181
9
Pneumonia (except that caused by tuberculosis and sexually transmitted diseases)
1,939 1.7 224
10 Acute cerebrovascular disease 1,935 1.7 120
11 Cardiac dysrhythmias 1,754 1.6 184
12 Biliary tract disease 1,678 1.5 169
13 Respiratory failure, insufficiency, arrest (adult) 1,630 1.4 65
14 Other complications of birth, puerperium
affecting management of the mother 1,502 1.3 329
15 Congestive heart failure, nonhypertensive 1,429 1.3 111
16 Mood disorders 1,341 1.2 289
17 Appendicitis and other appendiceal conditions 1,305 1.2 151
18 Fracture of lower limb 1,293 1.1 89
19 Trauma to perineum and vulva 1,253 1.1 385
20 Previous C-section 1,240 1.1 255
Total for top 20 conditions 49,780 44.3 5,748
Total for all hospitalizations 112,489 100.0 12,231
Abbreviation: CCS, Clinical Classifications Software
Source: Agency for Healthcare Research and Quality (AHRQ), Center for Delivery, Organization, and Markets, Healthcare Cost and Utilization Project (HCUP), Nationwide Inpatient Sample (NIS), 2011
Table 5. Top 20 most expensive conditions billed to the uninsured, 2011
Rank
CCS principal diagnosis category and name
Aggregate hospital costs, U.S. $, in millions
National costs, %
Number of hospital discharges, in
thousands
1 Acute myocardial infarction 819 4.8 43
2 Septicemia (except in labor) 774 4.5 44
3 Acute cerebrovascular disease 538 3.2 34
4 Biliary tract disease 441 2.6 47
5 Diabetes mellitus with complications 440 2.6 62
6 Skin and subcutaneous tissue infections 421 2.5 75
7 Coronary atherosclerosis 403 2.4 27
8 Mood disorders 398 2.3 103
9 Pancreatic disorders (not diabetes) 359 2.1 45
10 Fracture of lower limb 359 2.1 25
11
Pneumonia (except that caused by tuberculosis and sexually transmitted diseases)
352 2.1 44
12 Alcohol-related disorders 339 2.0 69
13 Intracranial injury 337 2.0 20
14 Crushing injury or internal injury 306 1.8 17
15 Congestive heart failure, nonhypertensive 296 1.7 29
16 Appendicitis and other appendiceal conditions 293 1.7 33
17 Respiratory failure, insufficiency, arrest (adult) 260 1.5 16
18 Nonspecific chest pain 253 1.5 52
19 Complication of device, implant or graft 247 1.4 15
20 Liveborn 220 1.3 137
Total for top 20 conditions 7,857 46.0 937
Total for all hospitalizations 17,085 100 2,068
Abbreviation: CCS, Clinical Classifications Software
Source: Agency for Healthcare Research and Quality (AHRQ), Center for Delivery, Organization, and Markets, Healthcare Cost and Utilization Project (HCUP), Nationwide Inpatient Sample (NIS), 2011
Data Source
The estimates in this Statistical Brief are based upon data from the Healthcare Cost and Utilization Project (HCUP) 2011 Nationwide Inpatient Sample (NIS). The statistics were generated from HCUPnet, a free, online query system that provides users with immediate access to the largest set of publicly available, all-payer national, regional, and State-level hospital care databases from HCUP.
Definitions
Diagnoses, ICD-9-CM, and Clinical Classifications Software (CCS)
The principal diagnosis is that condition established after study to be chiefly responsible for the patient’s admission to the hospital. Secondary diagnoses are concomitant conditions that coexist at the time of admission or develop during the stay.
ICD-9-CM is the International Classification of Diseases, Ninth Revision, Clinical Modification, which assigns numeric codes to diagnoses. There are approximately 14,000 ICD-9-CM diagnosis codes. CCS categorizes ICD-9-CM diagnoses into a manageable number of clinically meaningful categories.3 This "clinical grouper" makes it easier to quickly understand patterns of diagnoses. CCS categories identified as “Other” typically are not reported; these categories include miscellaneous, otherwise unclassifiable diagnoses that may be difficult to interpret as a group.
Types of hospitals included in HCUP
HCUP is based on data from community hospitals, which are defined as short-term, non-Federal, general, and other hospitals, excluding hospital units of other institutions (e.g., prisons). HCUP data include obstetrics and gynecology, otolaryngology, orthopedic, cancer, pediatric, public, and academic medical hospitals. Excluded are long-term care, rehabilitation, psychiatric, and alcoholism and chemical dependency hospitals. However, if a patient received long-term care, rehabilitation, or treatment for psychiatric or chemical dependency conditions in a community hospital, the discharge record for that stay will be included in the NIS.
Unit of analysis
The unit of analysis is the hospital discharge (i.e., the hospital stay), not a person or patient. This means that a person who is admitted to the hospital multiple times in one year will be counted each time as a separate "discharge" from the hospital.
Costs and charges
Total hospital charges were converted to costs using HCUP Cost-to-Charge Ratios based on hospital accounting reports from the Centers for Medicare & Medicaid Services (CMS).4 Costs will reflect the actual expenses incurred in the production of hospital services, such as wages, supplies, and utility costs;
charges represent the amount a hospital billed for the case. For each hospital, a hospital-wide cost-to-charge ratio is used. Hospital cost-to-charges reflect the amount the hospital billed for the entire hospital stay and do not include professional (physician) fees. For the purposes of this Statistical Brief, costs are reported to the nearest hundred.
Payer
Payer is the expected primary payer for the hospital stay. To make coding uniform across all HCUP data sources, payer combines detailed categories into general groups:
– Medicare: includes patients covered by fee-for-service and managed care Medicare
– Medicaid: includes patients covered by fee-for-service and managed care Medicaid
– Private Insurance: includes Blue Cross, commercial carriers, and private health maintenance organizations (HMOs) and preferred provider organizations (PPOs)
3
HCUP Clinical Classifications Software (CCS). Healthcare Cost and Utilization Project (HCUP). U.S. Agency for Healthcare Research and Quality, Rockville, MD. Available at
– Other: includes Worker's Compensation, TRICARE/CHAMPUS, CHAMPVA, Title V, and other government programs
– Uninsured: includes an insurance status of "self-pay" and "no charge.”
Encounters billed to the State Children’s Health Insurance Program (SCHIP) may be classified as Medicaid, Private Insurance, or Other, depending on the structure of the State program. Because most State data do not identify SCHIP patients specifically, it is not possible to present this information separately.
When more than one payer is listed for a hospital discharge, the first-listed payer is used. About HCUP
HCUP is a family of powerful health care databases, software tools, and products for advancing research. Sponsored by the Agency for Healthcare Research and Quality (AHRQ), HCUP includes the largest all-payer encounter-level collection of longitudinal health care data (inpatient, ambulatory surgery, and emergency department) in the United States, beginning in 1988. HCUP is a Federal-State-Industry Partnership that brings together the data collection efforts of many organizations—such as State data organizations, hospital associations, private data organizations, and the Federal government—to create a national information resource.
HCUP would not be possible without the contributions of the following data collection Partners from across the United States:
Alaska State Hospital and Nursing Home Association Arizona Department of Health Services
Arkansas Department of Health
California Office of Statewide Health Planning and Development Colorado Hospital Association
Connecticut Hospital Association
Florida Agency for Health Care Administration Georgia Hospital Association
Hawaii Health Information Corporation Illinois Department of Public Health Indiana Hospital Association Iowa Hospital Association Kansas Hospital Association
Kentucky Cabinet for Health and Family Services Louisiana Department of Health and Hospitals Maine Health Data Organization
Maryland Health Services Cost Review Commission Massachusetts Center for Health Information and Analysis Michigan Health & Hospital Association
Minnesota Hospital Association Mississippi Department of Health Missouri Hospital Industry Data Institute
Montana MHA - An Association of Montana Health Care Providers Nebraska Hospital Association
Nevada Department of Health and Human Services New Hampshire Department of Health & Human Services New Jersey Department of Health
New Mexico Department of Health New York State Department of Health
North Carolina Department of Health and Human Services
North Dakota (data provided by the Minnesota Hospital Association) Ohio Hospital Association
Oklahoma State Department of Health
Oregon Association of Hospitals and Health Systems Oregon Health Policy and Research
Pennsylvania Health Care Cost Containment Council Rhode Island Department of Health
South Carolina Budget & Control Board
South Dakota Association of Healthcare Organizations Tennessee Hospital Association
Texas Department of State Health Services Utah Department of Health
Vermont Association of Hospitals and Health Systems Virginia Health Information
Washington State Department of Health West Virginia Health Care Authority Wisconsin Department of Health Services Wyoming Hospital Association
About the NIS
The HCUP Nationwide Inpatient Sample (NIS) is a nationwide database of hospital inpatient stays. The NIS is nationally representative of all community hospitals (i.e., short-term, non-Federal, nonrehabilitation hospitals). The NIS is a sample of hospitals and includes all patients from each hospital, regardless of payer. It is drawn from a sampling frame that contains hospitals comprising more than 95 percent of all discharges in the United States. The vast size of the NIS allows the study of topics at both the national and regional levels for specific subgroups of patients. In addition, NIS data are standardized across years to facilitate ease of use.
About HCUPnet
HCUPnet is an online query system that offers instant access to the largest set of all-payer health care databases publicly available. HCUPnet has an easy step-by-step query system, allowing for tables and graphs to be generated on national and regional statistics as well as trends for community hospitals in the United States. HCUPnet generates statistics using data from HCUP's Nationwide Inpatient Sample (NIS), the Kids' Inpatient Database (KID), the Nationwide Emergency Department Sample (NEDS), the State Inpatient Databases (SID), and the State Emergency Department Databases (SEDD).
For More Information
For more information about HCUP, visit http://www.hcup-us.ahrq.gov/. For additional HCUP statistics, visit HCUPnet, our interactive query system, at http://hcupnet.ahrq.gov/.
For information on other hospitalizations in the United States, download HCUP Facts and Figures: Statistics on Hospital-Based Care in the United States in 2009, located at
http://www.hcup-us.ahrq.gov/reports.jsp.
For a detailed description of HCUP, more information on the design of the Nationwide Inpatient Sample (NIS), and methods to calculate estimates, please refer to the following publications: Introduction to the HCUP Nationwide Inpatient Sample, 2009. Online. May 2011. U.S. Agency for
Healthcare Research and Quality. http://hcup-us.ahrq.gov/db/nation/nis/NIS_2009_INTRODUCTION.pdf. Accessed July 22, 2013.
Houchens R, Elixhauser A. Final Report on Calculating Nationwide Inpatient Sample (NIS) Variances, 2001. HCUP Methods Series Report #2003-2. Online. June 2005 (revised June 6, 2005). U.S. Agency for Healthcare Research and Quality.
http://www.hcup-us.ahrq.gov/reports/CalculatingNISVariances200106092005.pdf. Accessed July 22, 2013.
Suggested Citation
Torio CM (AHRQ), Andrews RM (AHRQ). National Inpatient Hospital Costs: The Most Expensive Conditions by Payer, 2011.HCUP Statistical Brief #160. August 2013. Agency for Healthcare Research and Quality, Rockville, MD.
http://www.hcup-us.ahrq.gov/reports/statbriefs/sb160.pdf. ∗∗∗
AHRQ welcomes questions and comments from readers of this publication who are interested in obtaining more information about access, cost, use, financing, and quality of health care in the United States. We also invite you to tell us how you are using this Statistical Brief and other HCUP data and tools, and to share suggestions on how HCUP products might be enhanced to further meet your needs. Please e-mail us at [email protected] or send a letter to the address below:
Irene Fraser, Ph.D., Director
Center for Delivery, Organization, and Markets Agency for Healthcare Research and Quality 540 Gaither Road