Asia Pacific Journal of Research in Business Management
Vol. 7, Issue 12, December 2016 Impact Factor: 5.16, ISSN: (2229-4104) www.skirec.org Email Id: skirec.org@gmail.com
A Study on Rural Taluk Size Distribution of SC and ST Population in Tamil Nadu State Dr.M.Kalaiarasi
Assistant Professor of Statistics, Sri Ganesh College of arts and science,
Ammapet, Salem-14, TamilNadu, India.
Ruralisation is the process of growth with respect to the area and population. Rural areas are the geographical regions which are located out of the town or cities. Rural areas are also known as countryside or a village in India and it has a very low density of population (population of 5000 people or less). The lowest unit of a rural area is a village which is defined as an area having minimum 100 hamlets. Mahatma Gandhiji believed and advocated that the prosperity of India lies on the empowerment of the villages. His main vision becomes the empowerment of Indian rural. Villages still remain as villages and India is quoted as a rich country with poor people. In rural areas agriculture is the largest and one of the most important sectors of the rural economy and contributes both to economic growth and employment.The rural Scheduled Castes (SC) population of Tamil Nadu in 2001 census is observed as 8.309 million and in 2011 as 9.5 million. It shows the increasing nature of rural Scheduled Castes population in Tamil Nadu State. The rural Scheduled Tribes (ST) population of Tamil Nadu in 2001 census is observed as 0.551 million and in 2011 as 0.66 million. It shows the increasing nature of rural Scheduled Tribes population in Tamil Nadu State. 2011 census data indicates that in India out of the 201.3 million Scheduled Castes populations 153.8 million live in rural areas but in 2001 census data indicates that out of the 166.6 million Scheduled Castes populations 133 million live in rural areas. Thus, the rural scheduled caste population are having increasing tendency during the period 2001-2011 at India level. 2011 census data indicates that in India out of the 104.2 million Scheduled Tribe populations 93.8 million live in rural areas but in 2001 census data indicates that out of the 84.3 million scheduled tribe population 77.3 million live in rural areas. Thus, the rural scheduled Tribe population are having increasing tendency during the period 2001-2011 at India level. Thus the growth of the rural SC and ST population in India as well as in Tamil Nadu motivates to carry out the statistical study on ruralisation in Tami Nadu state. Statistical models such as Exponential and lognormal models are proposed to study the nature of the rural taluk size distribution of SC and ST population using 2011 population census data of Tamil Nadu state.
Asia Pacific Journal of Research in Business Management
Vol. 7, Issue 12, December 2016 Impact Factor: 5.16, ISSN: (2229-4104) www.skirec.org Email Id: skirec.org@gmail.com
Census 1971 recorded 79,092,841 Scheduled Castes population which is increased to 201,378,372 in 2011 in India. The share of rural Scheduled Castes population was 88 percent in 1971 which reduced to 76.4 percent in 2011, consequently the Scheduled Caste urban population in India rose from 12 percent to 23.6 percent in the same period. Total Scheduled Castes population of India in terms of percentage indicates increasing trend in 1971 to 2011 except in 2001. The total, rural and urban Scheduled Castes population observe declining trend between 1991 and 2001. The percentage of Scheduled Castes population in rural area is higher than the percentage of total Scheduled Caste population. But overall higher growth rate is observed in urban Scheduled Castes population. As per 2011 census data, the population of scheduled castes is now 16.6 percent and scheduled tribes 8.6 percent together forming a quarter of the total Indian population. During the period 2001-2011, the scheduled caste population growth is 20.8 percent and scheduled tribe population is 23.7 percent in comparison to the total population.
Primary census abstract (2011) indicates that the total scheduled caste population in 2011 is 16.6 percent and in 2001 is 16.2 percent with a growth rate of 20.8 percent. The rural scheduled caste population is 18.5 percent in 2011 and in 2001 is 17.9 percent with a growth rate of 15.7 percent. The total of scheduled tribe population is 8.6 percent in 2011 and in 2001 is 8.2 percent with ah growth rate of 23.7 percent. The scheduled tribe population in rural area in 2011 is 11.3 percent and in 2001 is 10.4 percent with the growth rate of 21.3 percent. Thus, the SC and ST population in rural areas of India are having increasing tendency.
As per the census 2001, the total SC population is 11.857 million. Of this, 8.309 million are in rural areas and 3.548 million in urban areas. As per the census 2011, the total SC population is 14.4 million. Of this, 9.5 million are in rural areas and 4.9 million in urban areas. The SC population shows an increase of 2.5 million and marked a decadal growth of 21.8 percent. As per the census 2001, the total ST population is 0.651 million. Of this, 0.551 million are in rural areas and 0.1 million in Urban areas. As per the census 2011, the total ST population is 0.79 million. Of this, 0.66 million are in rural areas and 0.13 million in Urban areas. The ST population is increased by 0.139 million constituting a decadal growth of 22 percent. Thus, the SC and ST population in rural areas of Tamil Nadu state are having increasing tendency.
Asia Pacific Journal of Research in Business Management
Vol. 7, Issue 12, December 2016 Impact Factor: 5.16, ISSN: (2229-4104) www.skirec.org Email Id: skirec.org@gmail.com
Objectives
To study the growth nature of rural taluk size distribution of Scheduled castes (SC) and Scheduled tribes (ST) population in Tamil Nadu state using the statistical models such as exponential and lognormal model.
To test the suitability of the two statistical models using 2011 census SC and ST Population data of Tamil Nadu state.
Data Source
Census 2011 SC and ST population data are applied for analyzing the nature of taluk size distribution in Tamil Nadu state.
Methodology
Definition
Variable
Number of population living in rural taluk is defined as rural taluk size. It is referred as a random variable because changes in rural taluk size population are random in nature.
Rural area
An area outside the limits of a city or town or a designated on the basis of commercial, industrial, or residential center are the rural area. Rural areas are characterized by farms, vegetation and open spaces. Farmlands, homes and buildings are spread out with larger distance. Rural is the natural environmentand the opposite of the city life and pertaining to the less-populated areas.
Taluk size distribution
Taluk size is the no. of population living in the taluk. Taluk size distribution is the distribution of Taluk with respect to their population size.
Models
A model establishes the main variables involved and connects them by means of mathematical statements. Thus, a model simplifies the reality and points out the basic features of the problem and denotes a set of hypothesis.
Methods
Method of Moments
X1,X2,…Xn be a random sample of size n drawn from a given population having the probability density function f(x;θ1,θ2...,θk) with k parameters θ1,θ2...,θk.
Asia Pacific Journal of Research in Business Management
Vol. 7, Issue 12, December 2016 Impact Factor: 5.16, ISSN: (2229-4104) www.skirec.org Email Id: skirec.org@gmail.com
and µr' is defined as follows. µr' =∫ r
f(x; θ1,θ2...,θk)dx , r =1, 2…k.
Estimate the parameters θ1, θ2...,θkin terms of µ1',µ2',…,µk' by the method of moments (i.e.) by solving the k equations µr', r =1,2,…,k and replacing the population moments µr', r =1,2,…,k by the sample moments mr', r =1,2,…,k, the rth moment about origin are obtained as,
µr' = mr', r =1, 2… k.
mr' = ∑ r/n where, mr' is the rth sample moments about origin and µr' is the rth
Population moments about origin.
Graphical Method
Diagrams and graphs are used to present pattern of rural taluk size distribution and they are described as follows.
Diagrams
Diagrams are based on scale but not confined to points or lines. There are various geometrical shapes such as bars, circles, square, etc. Diagrams are visual presentation of categorical and geographical data. It furnishes only approximate information. Diagrams are more appealing to the eyes and even laymen can understand the concept easily under study.
Graphs
Graphs are more appropriate to represent the time series data and the frequency distribution. Graphs are more precise and accurate than the diagrams. Graphs can be effectively used to study the slopes, rate of change and forecasting. Frequency curve, O give curve, trend line etc., are graphs representing the data related to the study.
Techniques
Statistical models
Exponential model
Let X be a random variable having the p.d.f, f(x) = λe-λx; x>0,
0 ; otherwise
Here, λ>0 is the parameter of the distribution and is estimated by the method of moments The distribution function of the exponential model is,
Asia Pacific Journal of Research in Business Management
Vol. 7, Issue 12, December 2016 Impact Factor: 5.16, ISSN: (2229-4104) www.skirec.org Email Id: skirec.org@gmail.com
The mean and variance are obtained as, E(x) = , V(x) =
The parameter of the exponential model is, ̂ = ̅
Lognormal model
Let X be a random variable having the lognormal p.d.f, f(x) = √
( ) , x>0
0; otherwise
The random variable Y=log x is normal random variable having mean and variance
estimated by the method of moments, which log x denotes the natural logarithm of the rural population of taluks.
The distribution of the lognormal model is, ( )= P (X≤x) = ( √ )
Where erf denotes the error function associated with the normal distribution. The estimates of
̂ = ∑ ̂ =√
∑ ( )
(∑ ) , Where, N is the sample size.
The mean and variance of the lognormal model are obtained as, ̅ = ̂
̂
, S2 = ̂ ( ̂ - ̂ )
Statistical measures
Mean
The mean of the variable Xi, i=1, 2, 3… n is defined as, ̅ = ∑
In case of frequency distribution,
Asia Pacific Journal of Research in Business Management
Vol. 7, Issue 12, December 2016 Impact Factor: 5.16, ISSN: (2229-4104) www.skirec.org Email Id: skirec.org@gmail.com
Variance
The variance of a variable , i=1, 2, 3… n is defined as, µ2 =V(X) = ∑ ((Xi- ̅)2
Where, ̅ = ∑ , s the frequency of the variable .
Coefficient of variation
The coefficient of variation is 100 times the coefficient of dispersion based upon the standard deviation as follows:
Coefficient of variation =100X√ ̅ , Where, µ2 = ∑ ((Xi- ̅)2, ̅ = ∑
Professor Karl Pearson suggested that the measure coefficient of variation is the percentage variation in the mean, standard deviation being considered as the total variation in the mean.
Skewness
The coefficient of Skewness based upon the moments about mean as follows. = , Where, µ2 = ∑ ((Xi- ̅)2,
µ3 = ∑ ((Xi- ̅)3
Kurtosis
The coefficient of Kurtosis based upon the moments about mean as follows. = , Where, µ2 = ∑ ((Xi- ̅)2,
µ4 = ∑ ((Xi- ̅)4
Test statistic
Chi square test
If ,i=1,2,3,…,n are n independent normal variates with mean and variances ,i=1,2,3,…,n,then
= ∑( ) , is a chi-square ( ) variate with n degrees of freedom.
Asia Pacific Journal of Research in Business Management
Vol. 7, Issue 12, December 2016 Impact Factor: 5.16, ISSN: (2229-4104) www.skirec.org Email Id: skirec.org@gmail.com
= ∑
( )
] ( ) when ∑ = ∑
Where, is the observed no. rural taluk and is the expected no. of rural taluk
Normal test
A random sample X1,X2,…Xn of size n has been drawn from a normal population with mean µ and variance σ2.The sample mean ̅ is distributed normally with mean and variance σ2/n when X represents rural taluk size.
ie, ̅ (µ σ2/n).The standard normal variate based on the sample mean ̅ is described as, Z = ̅
The standard normal variate Z is distributed as normal distribution with mean 0 and variance 1when H0 is true. In such a situation the standard normal statistic is called normal test statistic for testing the null hypothesis H0. The normal test statistic, fortesting the equality of the two sample means, the normal test statistic is described as follows:
Let X1 be the observed taluk rural size and X2 be the expected taluk rural size, N1 be the observed no. of rural taluks and N2 be the expected no. of rural tauks from the population with means µ1and µ2 and variances S12 and S22 respectively.
Z = ̅ ̅
√
~ N (0, 1)
Where, ̅ = Mean of the observed taluk size, ̅ = Mean of the expected taluk size.
Find the Z table value at the desired level of significance and compared with the Z calculated value. H0 is accepted if Z Zα at α% level of significance
H0 is rejected if Z Zα at α% level of significance
EMPIRICAL RESULTS
Rural population data in Tamil Nadu State provided by 2011 census of India are used to test the goodness of fit of the statistical models proposed in the present investigation of Rural Taluk Size Distribution. Rural Taluk Size Distribution of SC and ST population based on 2011 census resembles the skew distribution as seen in Table no.1.
Asia Pacific Journal of Research in Business Management
Vol. 7, Issue 12, December 2016 Impact Factor: 5.16, ISSN: (2229-4104) www.skirec.org Email Id: skirec.org@gmail.com
Table No.1EMPIRICAL DISTRIBUTION OF RURAL TALUK SIZE IN 2011
Exponential Model
Exponential Model is fitted using 2011 population data given in the Table no. 1 as follows. The mean of the empirical rural taluk size distribution is obtained as,
̅ = 47.5728,
The estimates of the parameter of the exponential model is obtained as, ̂ 0.0210>0
The fitted model is stated as,
f(x) = (0.021) ( ) ; x 0 ; otherwise
The expected no. of rural taluks is obtained using the fitted function f(x) and it is presented in Table no. 2below.
Rural Taluk Size (in'000) No. of rural taluks
2011
0-20 34
20-40 70
40-60 47
60-80 22
80-100 16
100-120 11
120-140 4
140 2
Asia Pacific Journal of Research in Business Management
Vol. 7, Issue 12, December 2016 Impact Factor: 5.16, ISSN: (2229-4104) www.skirec.org Email Id: skirec.org@gmail.com
Table -2 Observed and the expected distribution of rural taluks for
SC & ST Population – 2011
Rural Taluk Size (in'000)
Observed no. of rural taluks
Probability values
f(x)
Expected no. of rural taluks
0-20 34 0.3429 71
20-40 70 0.2253 46
40-60 47 0.1481 30
60-80 22 0.0973 20
80-100 16 0.0639 13
100-120 11 0.0420 9
120-140 4 0.0276 6
>140 2 0.0529 11
Total 206 1.0000 206
Using theinformations given in table-2, statistical measures of the rural taluk size distribution are computed and presented as follows.
The mean of the rural taluk size, ̅ = 46.5048 The variance of the rural taluk size, = 1646.0364 The coefficient of variation, C.V = 87% The measures of skewness, = 1.2958 The measures of Kurtosis, = 3.372
Normal test Statistic value, | | = 0.2994 is less than the table value of Z = 1.96 at 5% level of significance. It implies that the null hypothesis is accepted at 5% level of significance.
2
test statistic value, 2 = 50.8037 is greater than the table 2value at 5% level of significance with 6 d.f is 12.592. It shows that the null hypothesis is rejected at 5% level of significance; the goodness of exponential model to the Rural Taluk Size Distribution in 2011 is not good.
Lognormal Model
Lognormal model is fitted using 2011 population data given in the Table no.1as follows. The estimates of the parameters in the normal distribution are obtained as,
̂ =3.6257, ̂ =0.7320
Asia Pacific Journal of Research in Business Management
Vol. 7, Issue 12, December 2016 Impact Factor: 5.16, ISSN: (2229-4104) www.skirec.org Email Id: skirec.org@gmail.com
̅ = 49.0873
The variance of the empirical rural taluk size distribution, S2= 1709.1371
The fitted model is described as, f(x) = ( )√
( ) ( ) ;
0 ; otherwise
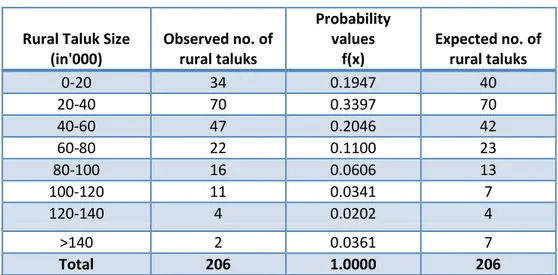
The expected no. of rural taluks is obtained using the fitted function f(x) and it is presented in table no.3below.
Table no.3 Observed and the expected distribution of rural taluks for
SC & ST Population – 2011
Rural Taluk Size (in'000)
Observed no. of rural taluks
Probability values
f(x)
Expected no. of rural taluks
0-20 34 0.1947 40
20-40 70 0.3397 70
40-60 47 0.2046 42
60-80 22 0.1100 23
80-100 16 0.0606 13
100-120 11 0.0341 7
120-140 4 0.0202 4
>140 2 0.0361 7
Total 206 1.0000 206
Using the informations given in table no.3, statistical measures of the rural taluk size distribution are computed and presented as follows.
Asia Pacific Journal of Research in Business Management
Vol. 7, Issue 12, December 2016 Impact Factor: 5.16, ISSN: (2229-4104) www.skirec.org Email Id: skirec.org@gmail.com
Normal test Statistic value, | | = 0.0373 is less than the table value of Z = 1.96 at 5% level of significance. It implies that the null hypothesis is accepted at 5% level of significance.
2
test statistic value, 2 = 6.7894 is less than the table 2value at 5% level of significance with 4 d.f is 9.49. It shows that the null hypothesis is accepted at 5% level of significance; the goodness of lognormal model to the Rural Taluk Size Distribution in 2011 is good.
SUMMARY AND COCLUSION
Summary
Inferences based on Statistical test
Inferences about the suitability of the models are obtained using 2011 census population data and presented as follows.
Chi-square test of goodness of fit
Table no.4Inferences based on 2 Statistics- Rural Taluk SC&ST population
Model
Test Statistic
Chi-square values Inference
Exponential 2=50.8037
rejected at 5% level of significance
Lognormal 2=6.7894
accepted at 5% level of significance
∑ (Oi- Ei)2/ Ei], when ∑ = ∑
H0: The fit of the models such as exponential and lognormal to the rural taluk size distribution of the SC & ST population are good.
Asia Pacific Journal of Research in Business Management
Vol. 7, Issue 12, December 2016 Impact Factor: 5.16, ISSN: (2229-4104) www.skirec.org Email Id: skirec.org@gmail.com
Statistical measures- 2011 SC & ST population
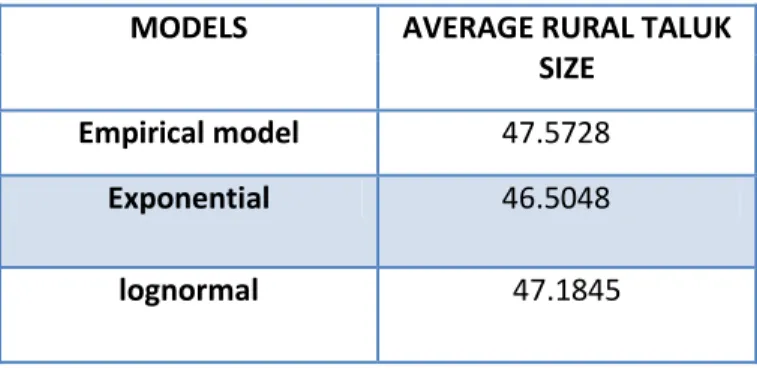
Model wise averages of rural taluk size were obtained and presented in the Table no.5 below.
Table no.5Averages of Rural Taluk Size - SC and ST population 2011
MODELS AVERAGE RURAL TALUK
SIZE
Empirical model 47.5728
Exponential 46.5048
lognormal 47.1845
The average lognormal rural taluk size distribution is deviated in least from the average rural taluk size of empirical distribution and exponential model having the larger deviations in the year 2011. It indicate that lognormal model may be preferred than the exponential model.
The variability of rural taluk size for the fitted distributions such as exponential and lognormal models are measured in terms of coefficient of variation and presented in the Table no.6.
Table no.6 Coefficient of variation of rural taluk size -SC&ST population2011
MODELS COEFFICIENT OF
VARIATION
Exponential 87%
lognormal 72%
The coefficient of variation in both the years due to lognormal model is minimum than the exponential model. It shows that the lognormal model may be preferred than the exponential because less amount of variation in lognormal rural taluk size distribution has been observed.
The skew nature of the models were studied in terms of measures of skewness .It was obtained and presented in the Table no.7.
Table no.7Skewnessvalues of rural taluk size -SC&ST population 2001 and2011
MODELS Skewness measure( )
2011
Exponential 1.2958
Asia Pacific Journal of Research in Business Management
Vol. 7, Issue 12, December 2016 Impact Factor: 5.16, ISSN: (2229-4104) www.skirec.org Email Id: skirec.org@gmail.com
Values are greater than zero in the two models. Hence the exponential and lognormal models are referred as a skew model.Hene these models may be used to describe the taluk size distribution. The kurtosis of the four models are obtained and presented in the Table no.8.
Table no.8 Kurtosisvalues of rural taluk size -SC&ST population 2001 and2011
MODELS Kurtosis measure( )
2011
Exponential 3.372
Lognormal 4.2922
Based on the SC & ST population exponential model having values where very closed to three than the other models in the year 2011.It indicate that these models are moving towards the symmetric nature in the long run.
Graph
Graphs are drawn using rural taluk SC and ST Population data of 2011 census and presented in the Figure.
Rural taluk SC & ST population 2011
Fig.1
It indicates that the expected curve of lognormal model isvery closed to the observed curve but the expected curve of exponential model is deviated from the observed curve. Thus, lognormal model is
0 10 20 30 40 50 60 70 80
0 20 40 60 80 100 120 140 160
N
o
.
o
f
rura
l
ta
luk
Taluk rural size
Observed
Expected(Expo)
Asia Pacific Journal of Research in Business Management
Vol. 7, Issue 12, December 2016 Impact Factor: 5.16, ISSN: (2229-4104) www.skirec.org Email Id: skirec.org@gmail.com
more suitable than the exponential model and also it is the best description of the growth nature of the rural taluk SC&ST population in the year 2011.
Conclusion
The exponential and lognormal models were fitted to the empirical rural taluk size distribution based on the 2011 census data for SC & ST population. Inferences were made that lognormal for rural taluk size distribution for SC and ST population in 2011 in Tamil Nadu State has been identified as a best model because
*its goodness of fit is good at 5% level of significance,
*it is having a average taluk size very closed to the average taluk size of empirical distribution, *it is having a skew nature because values are greater than zero,
* it has a least amount of variation in taluk size than the other models, *its curve is moving towards the curve of empirical taluk size distribution.
Thus, the lognormal model is used to describe the nature of the rural taluk size distribution of SC and ST population.The present investigation is useful to analyze the nature of rural taluk size in rural system in Tamil Nadu State. Rural taluk size can be forecasted using lognormalmodel which will be useful to the policy makers and planners for rendering the services to the rural population.
REFERENCE
1. Chandana R. C. (1980): “Distributional Pattern of Scheduled Caste Population in India”, Population Geography, Vol. 2, Pp. 78-89.
2. Directorate of census operations, Tamilnadu, Chennai: primary census Abstract, Census-2001&2011. 3. Gosal G. S. (1982): “Recent Population Growth in India”, Population Geography, Vol. IV, Pp. 30-51. 4. R.K .Gupta (2004).”RURAL DEVELOPMENT IN INDIA”.Atlantic publishers and distributors, New Delhi. 5.S.C.Guptaand V.K. Kapoor (2007).”FUNDAMENTALS OF MATHEMATICAL STATISTICS”.Sultan and sons, New Delhi.
6.Joachim Kaldasch (2014). “Evolutionary Model of the City Size Distribution”.Hindawi Publishing Corporation, ISRN Economics, Volume 2014, Article ID 498125, 6 pages.
7. Lakshmana (2008): “The Decadal Variation of Child Population Growth inKarnataka State”, the Deccan Geographer, Vol. 44, No. 1, Pp. 11-23.
8. ParimalMukhopadhyay (2009). “MATHEMATICAL STATISTICS”. Books and allied (P) Limited,Cacutta. 9. V.K. Rohatgi (1985). “AN INTRODUCTION TO PROBABILITY THEORY AND MATHEMATICAL STATISTICS”.John Wiley and sons, Inc.
10. H.C.Saxena, P.U.Surendran (1990).”STATISTICAL INFERENCE”. Sultan chand and company, Ltd., New Delhi.
11. K. Sita (1986): “Spatial Pattern of Scheduled Caste Tribes in Maharashtra”, the Geographer, vol. 37, Pp 53-59.
12. Singh Deva N. (2006): “A Study of Demographic Aspects of ScheduledCaste and Scheduled Tribes in Manipur”, the Deccan Geographer, Vol. 44,No. 1, Pp. 17-28.
13.S. SuddenduBiswas, (2011).“MATHEMATICAL STATISTICS”.Narosa publishing house, New Delhi. 14. Tripathi Rajmani (1999): “Socio-Economic Profile of Scheduled Caste Population in India”, Geographical Review of India, Vol. 61, No. 2, Pp. 47-59.
Website reference
Asia Pacific Journal of Research in Business Management
Vol. 7, Issue 12, December 2016 Impact Factor: 5.16, ISSN: (2229-4104) www.skirec.org Email Id: skirec.org@gmail.com
2. http://www.census2011.co.in/census/state/tamil+nadu.html
3. http://www.yourarticlelibrary.com/population/growth-of-population-in-india-1901-to-2001-with-statistics/39653/
4. Famous tamilnadu.blogspot.com/2011/05/demographics-of-tamilnadu.html. 5. en.wikipedia.org/wiki/scheduled-castes-and scheduled-Tribes
6. vikaspedia.in/social-welfare/scheduled-caste-welfare-1/status-report. 7.Census of india.gov.in/census…/scheduled-castes-and scheduled-tribes aspx