R E S E A R C H
Open Access
Augmented intelligence in educational
data mining
Tapani Toivonen
*, Ilkka Jormanainen and Markku Tukiainen
*Correspondence: [email protected]
School of Computing, University of Eastern Finland, P.O Box 111, FI-80101 Joensuu, Finland
Abstract
Educational data mining (EDM) processes have shifted towards open-ended processes with visualizations and parameter and predictive model adjusting. Data and models in hyperdimensions can be visualized for end-users with popular data mining platforms such as Weka and RapidMiner. Multiple studies have shown how the adjusting and even creating the decision tree classifiers help EDM end-users to better comprehend the dataset and the context where the data has been collected. To harness the power of such open-ended approach in EDM, we introduce a novelAugmented Intelligence method and a cluster analysis algorithmNeural N-Tree. These contributions allow EDM end-users to analyze educational data in an iterative process where the knowledge discovery and the accuracy of the predictive model generated by the algorithm increases over time through the interactions between the models and the end-users. In contrast to other similar approaches, the key in our method is in the model adjusting and not in parameter tuning. We report a study where the potential EDM end-users clustered data from an education setting and interacted with Neural N-Tree models by following Augmented Intelligence method. The findings of the study suggest that the accuracy of the models evolve over time and especially the end-users who have a adequate level of knowledge from data mining benefit from the method. Moreover, the study indicates that the knowledge discovery is possible through AUI.
Keywords: Educational data mining, Machine learning, Augmented Intelligence
Introduction
Educational data mining (EDM) is a collection of methods where raw data sets collected from educational settings are transformed into meaningful presentations of the educa-tional setting to guide the stakeholders related to the context (Baker and Yacef 2009). Such stakeholders include both the students and the teachers. The typical data min-ing approaches applied in EDM are classification (Pandey and Pal2011), cluster analysis (Merceron and Yacef2005a), outlier detection (Goyal and Vohra2012), and association rule mining (Romero et al.2008). Data collected from the educational settings can vary in size and in dimensions. For instance, the data collected from a MOOC (Massive Open Online Course) may contain thousands of data items in comparison to a dataset collected frommaking activitiesof less than 20 students. For the larger datasets, many data mining algorithms perform well but for the smaller samples, there are few algorithms that actu-ally are able to fit to the data. The algorithms that can cope with smaller datasets include for instance support vector machines (Moghaddam and Yang2000) for classification and hierarchical clustering algorithms for cluster analysis (Abbas2008).
Algorithms used in the traditional data mining are also widely used in the EDM context (Sachin and Vijay2012). The most used algorithms are associated with classification, clus-ter analysis, and relationship mining (Baker and Yacef2009). Examples of such algorithms are decision tree classifiers and neural networks (Ahmed and Elaraby 2014) (Sachin and Vijay2012). Another widely used technique in the EDM domain is cluster analysis. The commonly used cluster analysis methods in the EDM arek-means (Merceron and Yacef2005b) and hierarchical cluster analysis algorithms (Antonenko et al.2012). For the visualizations of the dataset, common dimensionality reduction methods such as self-organising maps and principal component analysis are typically used in cases where the dimensionality of the data vectors is more than three.
There are specifically developed tools available for EDM tasks but also general data mining and machine learning tools are commonly used in educational contexts. Among the most used tools are Weka (Hall et al.2009) and RapidMiner (Hofmann and Klinken-berg2013). Both of the tools offer extensive set of algorithms to conduct data mining processes such as cluster analysis and classification. Also, the current tools used for EDM usually operate in a white box manner and the end-users are free to explore and adjust the algorithms and the produced predictive models through several parameters and visualizations. The algorithms and the models produced by the algorithms can be cus-tomized in various ways. For instance in RapidMiner, the end-users can adjust hundreds of parameters that have an influence in the analysis outcomes and the process.
Augmented intelligence (AUI) is a term that describes systems that merge human and the artificial intelligence (AI) (Rouse and Spohrer2018). In contrast to AI, AUI aims to enhance the human’s perception and support humans in decision making, learning or planning with help of AI, instead of replacing human agents in processes automated with AI. In this paper, we demonstrate how AUI can be used in the EDM context to increase the accuracy of predictive models generated by AI algorithms. The principles of this method were presented earlier by Jormanainen and Sutinen (Jormanainen and Sutinen2013) who demonstrated that teachers benefit from an open and adjustable data mining process, which uses white-box data mining algorithms (Delibasic et al. 2013), such as decision trees. The fundamental requirement for an open EDM process is that the output of the selected algorithm is easy to visualize (as decision trees are (Ankerst et al.1999)). The end-users can access the data and gain understanding from the data or the EDM process through the visualizations. Furthermore, the teacher has to be able toadjustthe predic-tive model produced by the selected data mining approach, and also iterate the classifier constructing process as necessary (Jormanainen and Sutinen2013).
Jormanainen and Sutinen (Jormanainen and Sutinen2013) successfully investigated the effect of an open data mining process, but their study was limited for using decision trees only. Multiple platforms currently allow end-users to adjust or even build a decision tree classifier in the EMD context and the studies related to these platforms show that the end-users benefit from such processes (Delibasic et al.2013; Kovanovi´c et al.2017). For a more generalizable AUI method in EDM, there is a need to expand the scope to other commonly used algorithms. However, for example providing an easily interpretable visu-alisation for an output of a clustering algorithm in hyper-dimensional space is not trivial. For the purposes of AUI method, we have developed a novel clustering algorithm called Neural N-Tree(Toivonen et al.2018), which tackles some of the challenges appearing typically in educational data mining settings.
To explore the feasibility of our concept of the AUI, we organised a set of studies to answer to the following research questions.
1 Does the accuracy of a predictive model increase over time through Augmented Intelligence method?
2 Are there any indicators that the Augmented Intelligence method leads to the knowledge discovery?
To answer these research questions, we conducted two studies. In the first study, two groups of users completed a simple clustering task to explore a set of educational data. The second study involved teachers who used the Neural N-Tree and AUI method to analyze data collected from a classroom setting where they were teaching. The exper-iment group in the first study used a data mining tool implemented by following the AUI principles and the control group of the study used traditionally used cluster analy-sis algorithmk-means and also the accuracy of thek-means was recorded. Furthermore, we ran tests with RapidMiner to cluster the same dataset to study how another state-of-art EDM tool performs. However, our intention was not to compare the different cluster analysis algorithms but instead to set a benchmark to model adjusting process in order to get a perspective how widely used and studied algorithms and platforms perform. Both the experiment group and the control group answered to question-naires where the experiences from the methods were discussed. In the second study, the teachers using Neural N-Tree and the AUI method were interviewed and asked to fill a questionnaire that tested the user experience and the level of knowledge dis-covery. Based on the results, we argue that by adjusting not only the parameters of a given algorithm but also the models and interacting with the model visualizations, EDM end-users benefit from the AUI method and AUI method leads to the knowledge discovery.
This paper is organised as follows. First, we introduce the background and key concepts behind the AUI method, including technical details of the Neural N-Tree algorithm that was developed for the AUI tools. Second, we present the research setting, data collections, analysis, and the findings from the empirical study. Finally we discuss the implications of the results and present the directions for the future research on the topic.
Background
technical details of the novel cluster analysis algorithmNeural N-Treethat was developed specifically for the AUI.
Open educational data mining
One of the examples of the open approaches for educational data mining is presented by Jormanainen and Sutinen (2012), who concluded that opening a decision tree classifica-tion algorithm and the EDM process benefits the teachers. While it is not uncommon to use a decision tree as a classifier in an EDM setting (Al-Radaideh et al.2006), the novelty of the research in Jormanainen and Sutinen (2012) was that the teachers were engaged in data mining process while teaching, starting from labelling training data for the selected algorithm.
The Open Monitoring Environment (OME) presented in Jormanainen and Sutinen (2012) allowed teachers to label data collected from an educational robotics classroom setting real-time. The labels of the dataset items were expressing the performance of the students in the classroom, as perceived by the teacher. At any point during teaching, the teacher was able to automatically build a J48-decision tree (Bhargava et al.2013) classifier based on the labelled training set. After the decision tree was built, it was visualised to the teacher, and the rules were presented as if-else conditions expressing the branches of the decision tree. The system had a 2D map view to the classroom, and students’ perfor-mance was reflected realtime in the map as predicted by the newly built classifier. If the teacher was not satisfied with the classifier, he or she was able to re-iterate the process by labelling more data and constructing the classifier again. Alternatively, the teacher was able to modify directly the rules of the classifier.
In the research presented in Jormanainen and Sutinen (2012), the authors noticed that the open EDM process was beneficial for the teachers. The OME system provided oth-erwise unseen views to students’ progress, and it helped the teachers to design better intervention strategies. Even more importantly, the open data mining process with eas-ily interpretable decision trees produced useful information about the students’ progress with relatively small datasets. Many school environment settings, for example in K12 edu-cation, involve smaller groups of learners and thus produce smaller sets of data. This brings problems for mainstream classifiers. In general, most of the the mainstream classi-fiers, such as deep learning methods and neural networks, are difficult to use in the EDM settings because they require high volumes of data to work properly and they often fail to build generalisations. On the other hand, variety of tasks in the EDM domain require more versatile tools than just simple decision tree classifiers. The AUI method provides principles for implementing a wider range of data mining methods in open and inter-pretable way. However, to meet the goal, there is a need to design also novel algorithms, such as Neural N-Tree (see “Neural N-Tree” section for more details).
Figures1and2show how RapidMiner opens the data mining process by providing visual feedback from the clusters in hyper-dimensions. Figure3 illustrates a visual presenta-tion of hierarchical clustering for a sample dataset through a dendogram. Kovanovic et al (Delibasic et al.2013) built a platform where the EDM end-users may build a decision trees from the scratch by using a simple user interface. The studies of these platforms suggest that the open-ended approach to EDM helps the end-user to gain a deeper under-standing from the data mining process and the data itself, but the tools are not very accessible for the end-users, nor do they contain features that open the whole data mining process as our proposed AUI-driven toolset does.
Augmented intelligence method
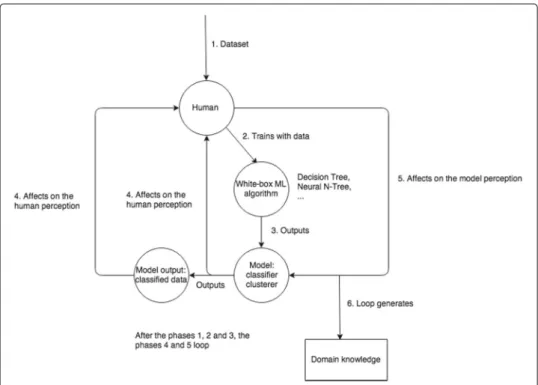
Augmented Intelligence method (AUI) in the educational data mining (EDM) context uses the concept of augmented intelligence where the traditional artificial intelligence (AI) supports the decision making, learning or planning of a human. Moreover, the AUI merges the human and the machine intelligence to generate knowledge in a way where both AI and human add unique value to the process (Rouse and Spohrer2018). Instead of a group of two or more learners, there is a end-user and a machine who together build a solution for a context-specific problem by communicating through a machine learn-ing environment. A role of the end-user is to provide a dataset for the machine learnlearn-ing algorithm, which builds a model from the dataset (computer’s interpretation over the phenomenon under investigation). The model is open and can be adjusted by the EDM end-users. The role of the end-user is active and the aim is not just the experiment with the parameters such as the number of clusters or a learning rate that has an influence in how the given algorithm builds a model. Instead the aim is to adjust the model itself.
The aim of the AUI method is that the EDM end-users generates new knowledge about the educational context based on the gathered dataset and the contextually developed model. Based on the generated knowledge and his or her pedagogical knowledge, the end-user is able to adjust the model built by the computer. Based on end-user’s informed adjustments, the computer re-builds a new model with new knowledge and data it has.
Fig. 2Cluster tree ofk-means in RapidMiner
The process is repeated, and during each step of the cycle, new knowledge about the edu-cational context and the phenomenon under exploration is produced. The AUI method process is described in Fig.4.
The AUI process leads to a cyclic knowledge discovery process of bothend-userand computer outputs of the predictive models from the computer that are adjusted by the end-user (Fig.4). Together, the outputs deepen the previous knowledge of the end-user about the context where the datasets were collected. The knowledge discovery is the union of the perception of the machine learning algorithm, the domain knowledge of the end-user, such as data scientist or a teacher, and a combination of these perceptions
Fig. 4Augmented intelligence in the educational data mining context
(from the end-user’s perspective). As the end-user possesses subjective knowledge from the learning context, the knowledge discovery process is also subjective to the end-user and not necessarily generalisable to the other end-users, e.g. the other teachers.
Neural N-Tree
To expand the scope of the AUI method from the easily interpretable decision trees, there is a need to develop also novel computational methods to serve the variety of different data mining tasks in contemporary smart learning environments. The usually applied data mining methods easily fail to build generalisable results in these highly contextual educa-tional settings because of low volumes and sparsity of data. The Neural N-Tree (Toivonen et al.2018) algorithm for educational cluster analysis is a balanced binary tree with each node containing a point vector. The length of the point vector equals the length of the input vectors. Neural N-Tree is constructed recursively by initialising each point vector with random numbers ranging from the minimum value to the maximum value occurring in the analysed data set. First, the algorithm takes the number of clustersnand creates a vector which length isn×2−1 with random point vectors. Second, from the created vector, a balanced binary tree is constructed as presented in Algorithms 1 and 2.
Algorithm 1Initialisation of Neural N-Tree
1: procedureINIT TREE(vector, min, max)
2: ifmin>maxthen
3: return NULL
4: middle←(min + max) / 2
5: node←Node with point being vector[middle] 6: ifroot =NULL then
7: root←node
8: node.left←Init tree(vector, min, middle - 1) 9: node.right←Init tree(vector, middle + 1, max) 10: ifnode.right=NULL then
11: node.right.parent←node
12: ifnode.left=NULL then 13: node.left.parent←node
14: ifnode.left =NULL∧node.right =NULL then 15: node.isTerminal←true
16: returnnode
Algorithm 2Indexing of Neural N-Tree
1: procedureINDEX(node)
2: ifnode=NULL then 3: index(node.left)
4: index(node.right)
5: index←index+1
6: node.index←index
maximum distance node or the least similar node is chosen as the BMU in order to spread the point adjusting to cover the whole tree. If the most similar terminal node would be chosen instead, then several branches of the created tree would not gain any adjusting. The measurement of the similarity is done by comparing the distance between the input vector and the terminal nodes’ points. When the BMU has been found, BMU is updated to be the parent of the BMU until one of the children of the root node has been reached. Before each update, the level order (Algorithm 6) starting from the BMU is calculated, and for each point of the node from the level order calculate:
Pv(s+1)=Pv(s)+f(ω)×α×(D(t)−Pv(s)))
wheref(ω)is the current level of the sub-tree+1 divided by the height of the sub-tree
+1,αis the learning rate,D(t)is the current input vector andPvis the point vector of the node. The purpose of the backward training is to initially adjust the points of the node to correspond the vectors in the dataset and to spread the adjusting process to cover the whole Neural N-Tree. The algorithm forbackward trainingis shown in Algorithm 3.
Algorithm 3Backward training of Neural N-Tree
1: procedureBACKWARD(Input vector)
2: BMU←NULL
3: fornode∈terminalsdo
4: ifd(Input vector, node)>MAXthen
5: BMU←node
6: whileBMU=rootdo
7: levels←LEVEL ORDER(BMU)
8: forlevel∈levelsdo
9: fornode∈leveldo
10: forpoint∈nodedo
11: Pv(s+1)=Pv(s)+f(ω)×α×(D(t)−Pv(s)))
12: BMU←BMU.parent
the Neural N-Tree from the root node to the one of the terminal nodes. After each step, the level order (Algorithm 6) starting from the current node (except the root node) is calculated and the points of the level order sub-tree starting from the current node are updated. The purpose of the forward training process is to adjust the paths for the input vectors for the cluster analysis process. Theforward training algorithm can be seen in Algorithm 4.
The training of Neural N-Tree is based on updating point vectors of the nodes during the traversal of Neural N-Tree. Besides the point of the current node, also the points of the sub-trees starting from the current node are updated. The sub-tree update enables similar clusters to be located near each others. Yet only the left or the right sub-tree of the root node will be updated during the traversal. After both forward and backward training are complete, the third phase is the clustering itself. The method of clustering is similar to forward training but unlike during the forward training, no updates of the points take place. The clustering process can be seen in Algorithm 5.
Research about the feasibility of the AUI method
In this section, we introduce an experiment that we conducted to study whether the Augmented Intelligence (AUI) method with the Neural N-Tree algorithm in an EDM environment provide benefits for the end-users. Our research had two main objectives. First, we tested whether the AUI method in the EDM environment would generate objec-tively more accurate results after the end-users have interacted with the model. Second, we tested if the AUI method helps knowledge discovery in the dataset. The knowledge discovery aspect was studied with questionnaires and interviews with the teachers who used AUI method to analyze datasets collected from the context.
Research design
Algorithm 4Forward training of Neural N-Tree
1: procedureFORWARD(Input vector)
2: levels←LEVEL ORDER(root) 3: forlevel∈levelsdo
4: fornode∈leveldo
5: forpoint∈nodedo
6: Pv(s+1)=Pv(s)+f(ω)×α×(D(t)−Pv(s)))
7: current←root
8: whilecurrent=NULL do
9: ifcurrent.left=NULL∧current.right=NULL then 10: left←d(current.left, Input vector)
11: right←d(current.right, Input vector)
12: ifleft≤rightthen
13: current←current.left
14: else
15: current←current.right
16: else ifcurrent.left =NULL∧current.right=NULL then
17: current←current.right
18: else
19: current←current.left
20: levels←LEVEL ORDER(current)
21: forlevel∈levelsdo
22: fornode∈leveldo
23: forpoint∈nodedo
24: Pv(s+1)=Pv(s)+f(ω)×α×(D(t)−Pv(s)))
were given an EDM tool with the well-knownk-means clustering algorithm, which was working in a black box. The students in the Group A were able to adjust the models gen-erated by the Neural N-Tree algorithm. The model adjusting in this context does not only mean changing the parameters such as the learning rate or the number of the clusters. The model adjusting implies to process where the node values (the point vectors) are changed in the generated models. The purpose of the study was not to comparek-means’ and Neu-ral N-Tree’s absolute accuracy in the given dataset. Instead, the widely used algorithm k-means offers a benchmark for accuracy level that should be quite equal to the accuracy level of Neural N-Tree in order for Neural N-Tree to be usable in the future studies.
Algorithm 5Clustering data with Neural N-Tree
1: procedureCLUSTER(Input vector)
2: current←root
3: whilecurrent=terminaldo
4: ifcurrent.left=NULL∧current.right=NULL then 5: left←d(current.left, Input vector)
6: right←d(current.right, Input vector)
7: ifleft≤rightthen
8: current←current.left
9: else
10: current←current.right
11: else ifcurrent.left =NULL∧current.right=NULL then
12: current←current.right
13: else
14: current←current.left
15: returncurrent.index
Algorithm 6Level order of Neural N-Tree
1: procedureLEVEL ORDER(node)
2: queue←[]
3: queue QUEUE(node)
4: whilequeue= ∅do 5: proceeding level←[]
6: level←[]
7: whilequeue= ∅do
8: node←queue DEQUEUE()
9: level[]←node
10: left←node.left
11: right←node.right
12: ifleft=NULL then
13: proceeding level[]←left
14: ifright=NULL then
15: proceeding level[]←right
16: levels[]←level
17: queue←proceeding level 18: returnlevels
withsilhouette index(see more detailed explanation later in this article). This metrics was used in the study, and finding an equal starting point for both algorithms was essential.
the teachers were compared to find any similarities between them. After the interviews, four teachers used the platform to analyze data collected from their teaching sessions in making activities. The teachers were given a questionnaire with 1 - 5 Likert scale. The aim of the questionnaires and the interviews was to measure the effect of AUI method in knowledge discovery and the understanding of the dataset and the educational context. Table1illustrates the pahses of the research conducted for this paper.
Research phase 1
Data collection
The participants for the first phase were selected to study on voluntary basis. The partic-ipants were students in an elective robotics course at the University of Eastern Finland, School of Computing. The participants were mainly 3rd or 4th year computer science major students. Some of them had gained previous experience on machine learning or data mining topics from their earlier studies. The students were assigned randomly to the experiment group (Group A, white-box,n=8), and to the control group (Group B, black-box, n=6, where 1 student did not answers to the questionnaire). Then a short introduction to the study was given, alongside with a description of the datasets used in the study. During the introduction, we described how the algorithms work and what the dataset was about. We described to the students that the dataset was collected from an educational setting and that the features within the dataset were individual task scores from a test. Also, principles and purpose of clustering algorithms in machine learning were explained to ensure that everyone understood what they were supposed to do.
For the study, we developed a web-based application for both groups. The experiment group (Group A) used an interface where the Neural N-Tree was visualised to the user in real-time and the nodes of Neural N-Tree were adjustable. If a student changed the point values, a new result produced by the clustering algorithm was rendered to the stu-dent. The students were able to change also the number of the terminal nodes in the Neural N-Tree, learning rate, and the number of iterations used to train the algorithm but the main focus was in the point adjusting: the researches stressed that the Group A should not use much time to select parameters that have an influence to the initial Neural N-Tree model. Furthermore, the students were able to choose whether the algorithm used backward training at all. The distance metrics used by all of the students waseuclidean distancedefined as
d(q,p)=
n
i=1
(qi−pi)2
whereqiis the point of an input vector andpiis the corresponding point of the node dur-ing the traversal. The same distance metrics was used also with the control group (Group
Table 1Phases of the study Phase of the
research
The research method The aim of the research Test subjects
1 Objective accuracy of NNT in AUI method
To measure if AUI method increases NNT’s accuracy over time
Computer science major students
2 Interviews and questionnaires on AUI method
To explore whether AUI leads to knowledge discovery
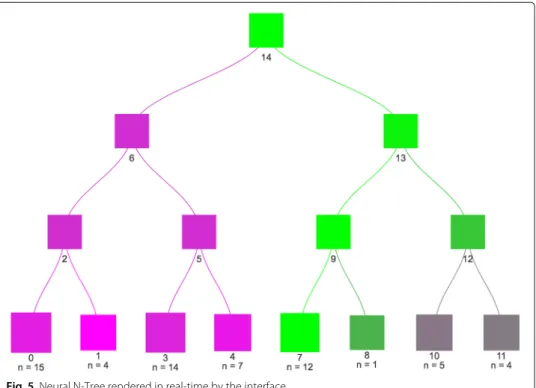
B) whose system was based on thek-means algorithm. An example of the rendered Neu-ral N-Tree in the students’ interface can be seen in Fig.4. The users were able to open any of the nodes in the visualisation to expose the values assigned to the particular cluster (Fig.5).
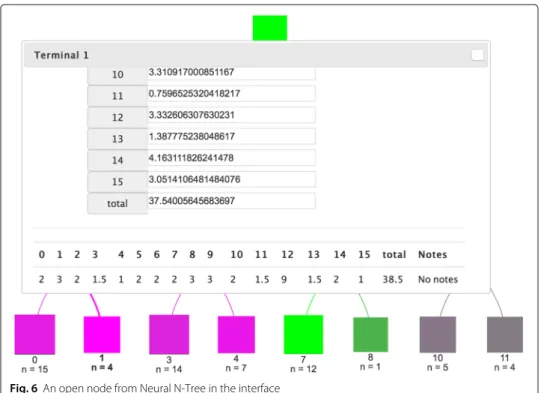
The Group B used an EDM interface that allowed them to cluster datasets with thek -means algorithm. The interface allowed the students to change the number of the clusters, but otherwise the system worked in a black box, and the students did not have a possibil-ity to change any other parameters or the model itself (such as the centroids). After the clustering process, the interface built result tables for each cluster. The tables show the dataset vectors in a cluster, and all features of the assigned vectors were visible in the table cells. An example of the clustering result in the tables is illustrated in Fig.6.
The students were able to change the number of the clusters at any time, and they were informed that they should try to achieve as good silhouette index as possible. In addition to changing the number of the clusters, the interface for Group A students allowed adjust-ing the parameters and the node points in the AUI driven EDM system. The clusteradjust-ing outputs of the algorithms and silhouette index of clusters were recorder on each iteration that the students took to measure and compare how the clusters get developed during the iterations (Fig.7).
The students were given 30 min to get familiar with the dataset, and try to record as high silhouette index as possible. After the students had completed the assigned task, they were asked to fill in a questionnaire, which was designed to measure the participants’ understanding about the clustering algorithms, and also their perceptions about the AUI method.
The questionnaire consisted of two parts. In the first part, the students gave their answers to the following open questions that were developed to capture the students’
Fig. 6An open node from Neural N-Tree in the interface
understanding of clustering as a machine learning approach in general, and their compre-hension about the experiment in particular. The questions tested the students perception about the cluster analysis process and how the cluster analysis process and the results helped them to understand the dataset.
1 What does the cluster analysis mean? 2 What the dataset you used was about?
3 How did the cluster analysis process help you to understand the dataset? 4 How did the final clusters help you to understand the dataset?
5 How did the final clusters help you to understand the differences within the dataset? 6 How would you describe the final clusters?
7 How would you describe the cluster analysis algorithm you used? 8 What did you learn about the context of the dataset that you clustered?
In the second part of the questionnaire, the students answered to 10 claims, that were measured with Likert scale 1-5. The questions measured whether it was easy for the stu-dents to conduct knowledge discovery with the algorithm and the EDM system they used. The questions measured also whether the cluster analysis process and the final clusters were easy to understand for the students.
1 The cluster analysis algorithm helped me to perceive the cluster analysis process. 2 The cluster analysis algorithm helped me to understand the dataset.
3 The cluster analysis algorithm helped me to discover new knowledge from the dataset.
4 The final clusters were justified.
5 I understand what cluster analysis means.
6 I understand differences within the dataset vectors.
7 It is difficult to understand why the dataset was clustered as in the final result. 8 It is difficult to discover new knowledge from the final clusters with the cluster
analysis algorithm.
9 I learned something new about the context of the dataset with the cluster analysis tool.
After the both groups had answered to the questionnaires and used the EDM tools, we also ran tests with a state-of-art data mining tool RapidMiner withk-means and hierarchi-cal clustering. The purpose of the additional study was to get even deeper understanding how the silhouette indices were set by different tools. We acknowledge that the data is not sufficient to compare the exact accuracy of the tools. Instead, thek-means implementa-tion of the black boxed tool, thek-means and hierarchical clustering implementation of RapidMiner were used to see whether the performance level of the different tools and the algorithms would fit in the same range of accuracy in the given context. This also serves as a background information in the future studies where Neural N-Tree is used.
Algorithm performance
Silhouette index is a measurement technique that shows how similar a data item is to its own cluster compared to other clusters. The silhouette index is a decimal value ranging from -1.00 to 1.00. Low positive and negative values mean that data might not be clustered to the correct clusters, and high positive values close to 1.00 mean that the dataset is clustered consistently. Because the students in Group A were able to adjust also the node points of Neural N-Tree, the initial silhouette indexes without adjusting the points were also recorded. In this way, it was possible to find out the effect point adjusting had in the process.
The results show that for every recorded cluster size, the silhouette indices of Neural N-Tree were greater when the point values of the nodes were adjusted. These results indi-cate that when the end-users adjust the models generated by Neural N-Tree, the accuracy of the model increases. Also, the widely used algorithmsk-means for black box imple-mentation of the control group (Group B) andk-means and hierarchical clustering for RapidMiner produced the silhouette indices quite comparable to the Neural N-Tree. The only significant difference can be found in the 2 clusters category. For 2 clusters, Rapid-Miner’s hierarchical clustering seemed to perform poorly. Besides that, the silhouette indices were not significantly higher for any of the tools in comparison to others. This indicates that the different algorithms performed quite equally for the dataset that was used in the study. This somewhat equal performance level of the different methods sets the ground for our assumption that the AUI method and Neural N-Tree would bring additional benefits to teaching and learning process by enabling more deep knowledge discovery process.
Survey about students’ perceptions
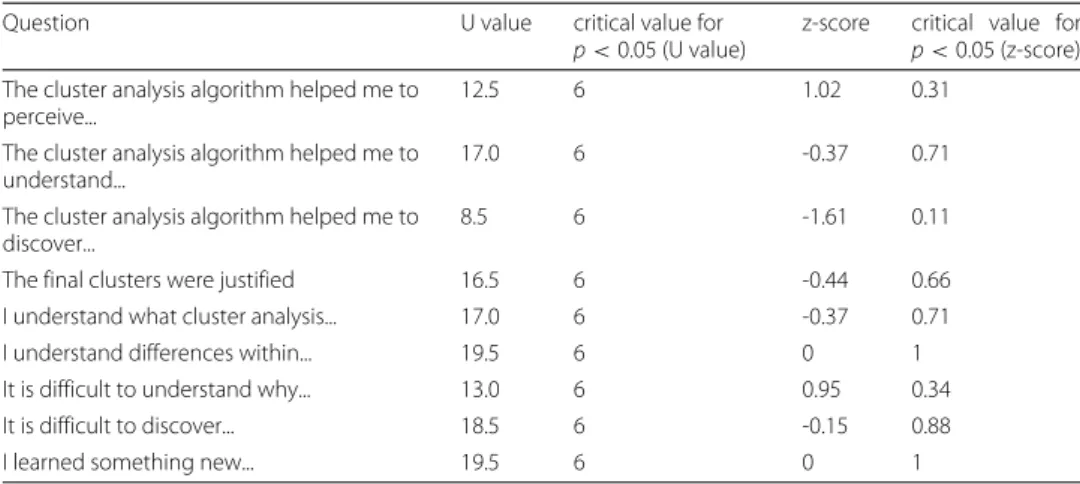
After the clustering task, the students were asked to fill in a questionnaire consisting of two parts. The answers were used to triangulate and deepen students’ answers in the sec-ond part of the questionnaire, which was a survey with 10 questions with Likert scale answer options (1-5; strong disagree - strong agree). We analysed the answers of the stu-dents by using Mann-Whitney U test for the given answers. The answers of the Group A were combined for each question and the answers of the Group B were combined for each questions. The combined answers were compared for the U value to validate whether there exists any significant difference forp<0.05 between the groups.
The results in the Table 2 show that there is no significant difference between the answers of the Group A and the Group B for any of the questions in the questionnaire (Table3). However, as the descriptive statistics in Table4 indicate, the variance of the answers for the questions was greater for the Group A (Neural N-Tree); the answers con-tained more scores from the extreme ends of the scale 1 - 5. Table4shows that both means and standard deviation between the two groups vary. In general, the mean values for the black box group (Group B) are higher than in the white box group (Group A). However, due to small sample size, it is difficult to make any final conclusion from these statistics. For example, the students previous experience in machine learning or related subjects may be reflected strongly in the answers. The results indicate that the from the point of view of knowledge discovery, understanding the dataset and the domain where the data was collected, the two approaches are quite equal.
Table 2Recorded silhouette indexes
Algorithm 2 clusters 3 clusters 4 clusters 7 clusters 8 clusters Group A: NN-T (points unadjusted) 0.53 0.40 0.42 0.31 0.31 Group A: NN-T (points adjusted) 0.62 0.62 0.46 0.36 0.33
Group B:k-means 0.62 0.46 0.37 0.11 0.20
RapidMinerk-means 0.21 0.23 0.17 0.19 0.25
RapidMiner hierarchical clustering 0.008 0.37 0.39 0.45 0.45
task and the EDM system they were using. One of arising themes from the answers was that students from Group A (Neural N-Tree) felt that 30 min was too short time to get familiar with the EDM system, and to comprehend how the algorithm works. Hence, their focus was clearly on increasing the silhouette index and not to understand the dataset, whereas Group B students indicated that they understood dataset and final clusters within the available time span. From this observation, we can conclude that achieving a good result when utilising a white-boxed EDM system and AUI method takes longer in terms of active working and exploration time than with black-boxed systems. One of the fac-tors affecting to this might be the additional overhead that a more complex user interface causes. However, this issue and factors behind it need to be studied more deeply.
Students’ previous knowledge on data mining and machine learning was also reflected in the answers. Those who had been learning the topics during their earlier studies, had more positive perception for the Neural N-Tree EDM system and AUI method than those who were completely novices in the domain. It is important to notice, however, that all the students were computer science majors and in general, they are assumed to have a good understanding in programming and related topics. The focus of this study was not to assess learnability of the EDM system driven with AUI method, but the role of computing expertise is something to take into consideration during future studies when explor-ing the feasibility of the AUI method with end-users who may come from the different backgrounds to exploit EDM and AUI method.
Research stage 2
The teacher interviews
Two secondary school teachers used Neural N-Tree and AUI during and after the teaching sessions. The data that was collected for the analysis contained items from the students’
Table 3U values and z-scores of the answers for the survey (scale 1-5) Question U value critical value for
p<0.05 (U value)
z-score critical value for
p<0.05 (z-score) The cluster analysis algorithm helped me to
perceive...
12.5 6 1.02 0.31
The cluster analysis algorithm helped me to understand...
17.0 6 -0.37 0.71
The cluster analysis algorithm helped me to discover...
8.5 6 -1.61 0.11
The final clusters were justified 16.5 6 -0.44 0.66 I understand what cluster analysis... 17.0 6 -0.37 0.71 I understand differences within... 19.5 6 0 1 It is difficult to understand why... 13.0 6 0.95 0.34 It is difficult to discover... 18.5 6 -0.15 0.88
Table 4Descriptive statistics of the questionnaire (scale 1-5)
Group A Group B
Question Mean sd Mean sd
The cluster analysis algorithm helped me to perceive... 3.125 0.78 2.6 0.49 The cluster analysis algorithm helped me to understand... 2.875 1.1 3.2 0.75 The cluster analysis algorithm helped me to discover... 2.25 1.1 3.4 0.8 The final clusters were justified 3.25 0.83 3.4 0.49 I understand what cluster analysis... 3.375 1.5 4 0.63 I understand differences within... 3.125 1.45 3.2 0.75 It is difficult to understand why... 3.5 1 3.2 0.98
It is difficult to discover... 2.875 1.17 3 0.89
I learned something new... 2.875 1.54 2.6 0.49
making activitiesin the classroom settings where the teachers were teaching. The mak-ing activities consisted of Arduino based craftmak-ing, design, programmmak-ing, and eventually sharing the works among the other students in the class oom. The students used a spe-cial purpose web-based platform for the making activities and the platform passed data vectors to the EDM system that implemented Neural N-Tree. The data vectors contained information from the activities in the web-based making platform such as clicks of UI elements launching and closing different tools and state of the program for the Arduinos. The teachers were able to adjust the generated models of NNT in similar way as the Group A students did in the first phase of the research. However, the aim of the adjusting and re-creating the models was not to increase the accuracy of the models ,but instead to engage the teachers in the knowledge discovery process and facilitate understanding about the context where the data was collected.
After the making activity sessions in the classroom, the participating teachers were interviewed. The teachers were asked to describe their usage of the NNT implementation and AUI method to reflect their experiences. The main interest during the interviews was to evaluate the level of knowledge discovery that was achieved during the use process, to understand how easy it was to use the EDM system, and finally to evaluate whether the teachers would prefer the AUI method over other EDM methods. The interviews were led by the researcher. Both of the interviews were recorded and the recordings were compared to each other to find congruent discussion. Some of the themes such as trust-worthiness and the level of knowledge discovery were recurring and thus, taken into account during the analysis. The interviews included free discussion and the following questions that were asked from of the teachers.
1 How do you find EDM in general?
2 A performance of a predictive algorithm can be evaluated. In the context of EDM this could mean that the used algorithm predicts a grade of a student accurately. Which one do you prefer: the prediction is correct or that theuse of an algorithm leads to a knowledge discovery?
3 In the terms of knowledge discovery, do you think that AUI method can lead to it? 4 In the AUI, you were able to adjust the predictive models through the
5 Did you find the use of AUI challenging or time consuming? Why?
6 Which one do you prefer? A machine would generate the predictions or you and the machine would generate the understanding in the educational context together?
For the first two questions, the teachers regarded the EDM to be a supportive tool that would deepen the domain knowledge for a certain context. That is, the teachers preferred knowledge discovery over the accuracy. The answers to the third question pointed that it is indeed possible to generate knowledge through AUI (and NNT); the combination of the visualization and the adjusting process seemingly increases the understanding by combining the perception of the algorithm on the dataset and the domain knowledge of a teacher. Whereas the teacher posses the intuition and the experience, the machine tends to produce the generalization from the data.
About knowledge discovery
Can lead to knowledge discovery. Because the rules are visible. Visualized the differences between different level of users.
The fourth question compared the traditional black box approach and the AUI method in EDM. Neither one of the approaches was viewed superior to another. A learning curve and time consuming nature of the AUI was seen as negative characteristics. Although, the other teacher noted that if the system with a AUI method would be more automated and easier to use, then the approach would be favourable.
The fifth questions asked whether it is challenging or time consuming to use the AUI. Both of the teachers considered the system to have a steep learning curve. There seems to be too many options and possibilities to consider and too many technical terms, which require previous knowledge in machine learning. However, the visualizations of the gen-erated Neural N-Tree models were seen easy to interpret. One of the two teachers pointed that there would be more motivation to study the system if the projects would have last longer period of time. Within the current time frame, there was only a little bit motiva-tion to study the system. In the case of the sixth quesmotiva-tion, both of the teachers favoured the idea of AUI. The process of AUI should, however, be easy to learn and automated to some extent. The other teachers mentioned about the learning curve :
Even though I understood the tree model (NNT), it took me a lot of time to really understand it... For small projects, learning it would not be feasible.
The last questions was about the improvements that could be implemented in the sys-tem. The challenges that emerged during the previous questions were also present in the answers for the last questions. The system was seen challenging and because the making activities that the teachers taught in the classroom only lasted for a month, there was no or little motivation to study the system. Based on the answers, the AUI method itself was seen positively but the usability of the system could be improved.
During the free discussion, both of the teachers noted that when the predictive model is visualized and adjustable, it is easier to trust the analysis because the clustering process is visible for the end-user. Furthermore, if an algorithm produces a Neural N-Tree model, which in the teacher’s point of view does not generalize the features that have an influence in the similarities of the students, the teacher is able to adjust the model accordingly. The other teacher noted that
The teacher questionnaires
The workshop for the teachers was organized in the fall of 2018. Around 30 teachers participated in total. The participants used a web-based platform for making projects. The teachers worked in small groups of 3 to 7 people. Each group chose a theme for the project and the actions within the web-based making platform were collected to be analyzed in the system that implemented Neural N-Tree algorithm. Each group selected one teacher for the EDM task. Other members of the group were programming, planning and crafting the artefact. The selected group member analyzed the data collected from the learning process. For the analyzer, we showed how the use the EDM system and also gave a brief introduction to the educational data mining. In total, the making activities lasted for 4 h.
After the use of the AUI driven data mining tool, the analyzers were given a ques-tionnaire with 9 questions that were related to the educational data mining (EDM), the knowledge discovery levels of NNT and AUI and the user experience. The questionnaire used Likert scale where the teachers chose the most describing option for the questions from 1 (completely disagree) to 5 (completely agree). The questions presented to the teachers were
1 I understand what Educational data mining means.
2 I understand how to use the platform that implements AUI.
3 I would be able to analyze my students with the platform that implements AUI. 4 I can trust the analysis when the predictive model is visualized for me.
5 I gain new knowledge when I see the models visualized for me and I can change them.
6 AUI method is easy to use.
7 Knowledge discovery is more valuable than correct predictions in educational data mining.
8 I understand why visualizations and possibility to adjust models can lead to new knowledge.
9 I would use NNT and AUI with my students.
The questions were designed so that the answers would be related to the previously conducted interviews with the teachers. The hypothesis for the questionnaire was that the answers given by the teachers for the questionnaire would support the answers given by the teachers for the interviews. Table 5 shows the answers of the teachers for the questionnaires as well as the mean and SD for a specific question.
Table 5Teachers’ answers to the questionnaire
Q Mean SD
1 3.75 0.50
2 3.50 0.58
3 3.25 0.96
4 3.50 1.29
5 3.75 0.50
6 2.50 1.29
7 3.25 0.50
8 3.75 0.96
The results from the questionnaire support the previously conducted researches with the computer science majors (research phase 1) and the interviews with the 2 teachers (research phase 2). AUI method was not seen easy to use in general (Q6). However, the question about the knowledge discovery (Q5) had the lowest SD and the highest mean among the questions (in addition to Q1 that asked about whether the teachers understand what EDM is). This indicates that AUI (and Neural N-Tree) indeed facilitates knowledge discovery. During the interviews, the teachers noted that it is actually easier to trust the analysis when the model is adjustable and visible for the end-users. In the questionnaires, Q4 had the highest SD among the answers, which indicates that for some teachers it is easier to trust the predictive model and the analysis while some teachers disagree.
In general, the answers to the questionnaires and the interviews are congruent. AUI requires time to learn and has a steep learning curve. However, the end-users seem to agree that the use of AUI (and Neural N-Tree) helps in knowledge discovery.
Limitations of the research
The limitations of the research are related to the small sample sizes. The results indicate that the performance of Neural N-Tree algorithm increases over time when the models are adjusted by the possible EDM end-users. However, in the first phase we only used one dataset, which consisted of exam scores and hence, the dataset itself was easy to compre-hend. The conclusions on the accuracy improvements in Neural N-Tree with AUI method require is limited to the context of the study, and more general conclusions require more research.
The interviews and the teachers’ answers to the questionnaires indicate that the knowledge discovery is possible with AUI. In general, all of the answers were in line with each others and the teachers agreed that AUI leads to knowledge discovery. The generalisability again suffers from the small sample size and the the teachers used AUI and Neural N-Tree only in one context that was familiar for them.
The first part of the study with the computer science majors also indicated that the AUI method leads to knowledge discovery. However, the students who took part to the research were not familiar with the context where the dataset was collected. We introduced the dataset and the features but it is possible that the true knowl-edge discovery in AUI method occurs when the end-users are familiar with the context. Otherwise the subjective experience and new knowledge rising though AUI method might be biased that does not reflect the factual knowledge of the educational context.
In the future, AUI and Neural N-Tree need to be tested with more potential EDM end-users and multiple datasets to more deeply evaluate the accuracy of the algorithm and the adjustable models.
Conclusions
N-Tree would increase its accuracy over time when the end-users were adjusting the predictive models.
We have introduced AUI method for EDM, where the understanding about the edu-cational context is created in a collaboration between a computer and an end-user. In the AUI method, learning is iterative and cumulative; the computer builds a model from which the end-user discovers knowledge and adjusts the created model based on the subjective interpretation. The computer, in turn, adjusts the model based on the interpretations that the end-user has expressed in the system.
Our results show that an EDM system following the AUI method can produce more accurate results over time but there is was no significant difference between of the dif-ferent algorithms in the terms of silhouette indices. Also, using only one dataset and one metrics for the cluster evaluation is not sufficient to show that one algorithm would be superior to another. Our results show that achieving a good result with the AUI method takes longer time and more iterations than with the black boxed algorithm. Under-standing the approach and the associated tools takes longer time, but despite the longer process, the AUI method helps the EDM end-user to discover new knowledge from the context more easily.
Furthermore, the results indicate that those who have previous knowledge about data mining related topics, were more comfortable using the AUI method than those novices in the context. The test participants from the first stage of our research with no previ-ous experience found it challenging to understand mechanism behind Neural N-Tree and concentrated more in increasing the silhouette index. These findings suggest that the AUI method is beneficially especially to mediocre users with some degree of existing knowl-edge about educational data mining and learning analytics systems. However, the Likert scale for the questionnaire showed no significant difference between the answers of the groups using eitherk-means or Neural N-Tree when for instance the level of knowledge discovery is being measured.
The second stage of the research casts the light to the knowledge discovery process of AUI. The results from the second stage of the research indicates that AUI method leads to knowledge discovery but is not easy to use. The participants implied that the knowledge discovery is possible but unlike in the first phase of the research, the test subjects were also familiar with the dataset context and the dataset. Also, some indicated that when the predictive model (in this case the Neural N-Tree) is visualized to the end-user and is adjustable, it is easier to trust the output of the model. However, the trustworthiness of AUI depends on the user and not all of the test subjects in the second stage of the research found AUI to be more trustworthy.
In this paper, we introduced two research questions, for which we have provided the answers based on the conducted research. The research questions were as follows:
1 Does the accuracy of a predictive model increase over time through Augmented Intelligence method?
The resulting silhouette indices indicate that the Augmented Intelligence method and model adjusting increase the accuracy, hence leading to better context-specific models.
The results from the study indicate that the knowledge discovery is possible though the Augmented Intelligence method especially when the context of the dataset is familiar to the EDM end-users.
The results indicate that AUI method in an EDM system is challenging for the end-users who do not posses of required skill set in data mining. On the other hand, the results indicate also that especially mediocre users may benefit from the AUI method when they are able to use enough time to comprehend the system and focus on knowledge discovery process through the AUI method.
Future work and discussion
The results in this paper indicate future directions for the research. We will experiment the AUI method in real educational contexts with bigger end-user groups. Also, one of the aspects for the future development include expanding the selection of the algorithms in the AUI method with decision tree classifiers. Decision trees have proven to be easily interpretable even by non-expert teachers (Jormanainen and Sutinen2013). In such sys-tems, a decision tree is rendered in the system and the teacher can modify the nodes in the visualisation and in this way have an influence in the model produced by the algorithm.
In the future studies about AUI method, the longer time requirement for familiarising with the system has be taken into the account. For computer science majors, a binary tree and the traversals in the binary tree are quite easy to explain when comparing to non-expert end-users such as the teachers, who have no experience in data structures or data mining whatsoever. This sets requirements for sufficient introductory material to scaffold the novice users (teachers) when they are using the system.
The model of the AUI method can be seen as a product of both end-user’s and com-puter’s interpretation of an educational context. Changes to the model made by the end-user always reflect to the subjective experiences and knowledge of the user. The sub-jective understanding from the context forms a basis to the knowledge that the computer and the user generate. In the field of computer-based modelling, Empirical Modelling (EM) (Beynon1997) have a similar relationship between the model - the construal - and the phenomenon being modelled - the referent - and it is called state-as-experienced (Harfield2007). This emphasises that a state of a construal can not in general be viewed in the way that a state of a traditional computer program is viewed, but a construal is far more subjective. The AUI method possess similar view as the state of a model produced by the AUI method is always subjective.
Because the AUI produces models, which are described by the subjective understanding of a end-user, the future evaluations of the AUI need to take the subjective nature of the model and the results into the account. For instance, a question arises whether a silhouette index is a good metrics for subjective knowledge in educational settings? Also, knowledge generated in collaboration between a computer and an end-user does not solely depend on the predictive results of the approach but also the knowledge is implicitly generated by the collaboration and knowledge sharing.
interpretability of the visualisation suffers if the depth of the tree is too high. Thus, AUI should be used for relatively small datasets where some of the commonly used methods, such as deep learning algorithms, fail to build the generalisations. This sets also a requirement to develop novel computational methods specifically for the AUI method.
Abbreviations
AI: Artificial intelligence; AUI: Augmented intelligence; EDM: Educational data mining; EM: Empirical modeling
Acknowledgments Not applicable.
Authors’ contributions
TT and IJ carried out the studies on the students using the Educational Data Mining system, designed the questionnaires and implemented the system. MT supervised the study. All authors contributed in writing process and all authors revised the final version sent to the Journal. All authors read and approved the final manuscript.
Funding
No external funding for the research was received
Availability of data and materials
The dataset used as part of the study is first referred in Vahdat, M., Oneto, L., Anguita, D., Funk, M., Rauterberg, M.: A learning analytics approach to correlate the academic achievements of students with interaction data from an educational simulator. In: Design for Teaching and Learning in a Networked World, pp. 352?366. Springer, (2015)
Competing interests
The authors declare that they have no competing interests.
Received: 12 February 2019 Accepted: 5 July 2019
References
O. A. Abbas, Comparisons between data clustering algorithms. Int. Arab J. Inf. Technol. (IAJIT).5(3), 324 (2008) A. B. E. D. Ahmed, I. S. Elaraby, Data mining: A prediction for student’s performance using classification method. World J.
Comput. Appl. Technol.2(2), 43–47 (2014)
Q. A. Al-Radaideh, E. M. Al-Shawakfa, M. I. Al-Najjar, inInternational Arab Conference on Information Technology (ACIT’2006), Yarmouk University, Jordan, Mining student data using decision trees (Al Ain University of Science and Technology, 2006)
T.-S. An, C. Krauss, A. Merceron, inProceedings of the 10th International Conference on Educational Data Mining, Can typical behaviors identified in moocs be discovered in other courses? International educational data mining society (Department of Social Science and Policy Studies Worcester Polytechnic Institute 100 Institute Road Worcester, MA 01609 USA, 2017)
M. Ankerst, C. Elsen, M. Ester, H.-P. Kriegel, inProceedings of the Fifth ACM SIGKDD International Conference on Knowledge Discovery and Data Mining, Visual classification: an interactive approach to decision tree construction (ACM, 1999), pp. 392–396
P. D. Antonenko, S. Toy, D. S. Niederhauser, Using cluster analysis for data mining in educational technology research. Educ. Technol. Res. Dev.60(3), 383–398 (2012)
R. Asif, A. Merceron, S. A. Ali, N. G. Haider, Analyzing undergraduate students’ performance using educational data mining. Comput. Educ.113, 177–194 (2017)
R. S. Baker, K. Yacef, The state of educational data mining in 2009: A review and future visions. JEDM J. Educ. Data Min. 1(1), 3–17 (2009)
W. Beynon, inCognitive Technology, 1997. Humanizing the Information Age. Proceedings., Second International Conference On, Empirical modelling for educational technology (IEEE, USA, 1997), pp. 54–68
N. Bhargava, G. Sharma, R. Bhargava, M. Mathuria, Decision tree analysis on j48 algorithm for data mining. Proc. Int. J. Adv. Res. Comput. Sci. Softw. Eng.3(6), 1115 (2013)
B. Delibasic, M. Vukicevic, M. Jovanovic, White-box decision tree algorithms: A pilot study on perceived usefulness, perceived ease of use, and perceived understanding. Int. J. Eng. Educ.29(3), 674–687 (2013)
D. B. Fernández, S. Luján-Mora, in2017 IEEE World Engineering Education Conference (EDUNINE), Comparison of applications for educational data mining in engineering education (IEEE, USA, 2017), pp. 81–85 M. Goyal, R. Vohra, Applications of data mining in higher education. Int. J. Comput. Sci.9(2), 113 (2012)
D. Gunning,Explainable artificial intelligence (xai), (2017).https://www.darpa.mil/attachments/XAIProgramUpdate.pdf. Accessed 7 Nov 2019
M. Hall, E. Frank, G. Holmes, B. Pfahringer, P. Reutemann, I. H. Witten, The weka data mining software: an update. ACM SIGKDD Explor. Newsl.11(1), 10–18 (2009)
A. J. Harfield, Empirical modelling as a new paradigm for educational technology. PhD thesis, University of Warwick (2007) M. Hofmann, R. Klinkenberg,RapidMiner: Data Mining Use Cases and Business Analytics Applications. (CRC Press, New York,
2013)
I. Jormanainen, E. Sutinen, inProceedings of the 13th Koli Calling International Conference on Computing Education Research, An open approach for learning educational data mining (ACM, New York, 2013), pp. 203–204
I. Khan, A. Al Sadiri, A. R. Ahmad, N. Jabeur, in2019 4th MEC International Conference on Big Data and Smart City (ICBDSC), Tracking student performance in introductory programming by means of machine learning (IEEE, USA, 2019), pp. 1–6 V. Kovanovi´c, S. Joksimovi´c, P. Katerinopoulos, C. Michail, G. Siemens, D. Gaševi´c, inProceedings of the Seventh International Learning Analytics & Knowledge Conference, Developing a mooc experimentation platform: Insights from a user study (ACM, New York, 2017), pp. 1–5
A. Merceron, K. Yacef, inProceedings of the 12th International Conference on Artificial Intelligence in Education (AIED 2005), Educational data mining: a case study (InderScience Publishers, Genève, 2005a), pp. 467–474
A. Merceron, K. Yacef, Interact. Multimed. Electron. J. Comput.-Enhanc. Learn.7(1), 267–287 (2005b)
B. Moghaddam, M.-H. Yang, inProceedings Fourth IEEE International Conference on Automatic Face and Gesture Recognition (Cat. No. PR00580), Gender classification with support vector machines (IEEE, USA, 2000), pp. 306–311
U. K. Pandey, S. Pal, Data mining: A prediction of performer or underperformer using classification. arXiv preprint arXiv:1104.4163 (2011)
C. Romero, S. Ventura, E. García, Data mining in course management systems: Moodle case study and tutorial. Comput. Educ.51(1), 368–384 (2008)
W. B. Rouse, J. C. Spohrer, Automating versus augmenting intelligence. Journal of Enterprise Transformation.8, 1–21 (2018) R. B. Sachin, M. S. Vijay, inAdvanced Computing & Communication Technologies (ACCT), 2012 Second International
Conference On, A survey and future vision of data mining in educational field (IEEE, USA, 2012), pp. 96–100 S. Slater, S. Joksimovi´c, V. Kovanovic, R. S. Baker, D. Gasevic, Tools for educational data mining: A review. J. Educ. Behav.
Stat.42(1), 85–106 (2017)
T. Toivonen, I. Jormanainen, C. S. Montero, A. Alessandrini, inChallenges and Solutions in Smart Learning. ed. by M. Chang, E. Popescu, Kinshuk, N.-S. Chen, M. Jemni, R. Huang, and J. M. Spector, Innovative maker movement platform for k-12 education as a smart learning environment (Springer, Singapore, 2018), pp. 61–66
M. Vahdat, L. Oneto, D. Anguita, M. Funk, M. Rauterberg, inDesign for Teaching and Learning in a Networked World. ed. by G. Conole, T. Klobuˇcar, C. Rensing, J. Konert, and E. Lavoué, A learning analytics approach to correlate the academic achievements of students with interaction data from an educational simulator (Springer, Cham, 2015), pp. 352–366 W. Zhang, S. Qin, in2018 IEEE 3rd International Conference on Big Data Analysis (ICBDA), A brief analysis of the key
technologies and applications of educational data mining on online learning platform (IEEE, USA, 2018), pp. 83–86
Publisher’s Note