Traffic congestion prevention system
Hamza Toulni
1, Mounia Miyara
1, Benayad Nsiri
2and Mohcine Boudhane
11GITIL Laboratory, Faculty of Sciences Ain Chock, Hassan II University of Casablanca, Morocco
2Research Center STIS, M2CS, Higher School of Technical Education of Rabat (ENSET), Mohammed V University, Rabat, Morocco
Abstract: Transport is one of the key elements in the development of any country; it can be a powerful catalyst for economic growth. However, the infrastructure does not give enough to the huge number of vehicles which produces several problems, particularly in terms of road safety, and loss of time and pollution. One of the most significant problems is congestion, this is a major handicap for the road transport system. An alternative would be to use new technologies in the field of communication to send traffic information such as treacherous road conditions and accident sites by communicating, for a more efficient use of existing infrastructure. In this paper, we present a CPS system, which can help drivers in order to have a better trip. For this raison we find the optimal way to reduce travel time and fuel consumption. This system based on our recent work [1]. It´s new approach aims to avoid congestion and queues, hat assure more efficient and optimal use of the existing road infrastructure. For that we concentrate by analyzing the useful and reliable traffic information collected in real time. The system is simulated in several conditions, Experimental result show that our approach is very effective. In the future work, we try to improve our system by adding more complexity in our system.
Keywords: Vehicular Ad-hoc Networks, traffic flow, traffic information systems, SUMO.
1.
Introduction
For several decades, the number of traffic is constantly increasing, especially in developing countries. However, congestion has many negative consequences for economic growth, social development and even ecological, because the time spent in traffic is largely considered lost, it is not used either for work or for leisure. In addition to the lost time, congestion cause a massive waste of energy and increasing pollution, they also cause problems concentrating at work and reduce productivity and increase stress, so this loss to a very economic cost high.
The causes of congestion are numerous, but one of the main causes is the increase in traffic volume due to the growing demand for urban transport. The inappropriate and lack of information for users also cause congestion roads.
The construction and expansion of roads, the installation of intelligent traffic light systems or the construction of a smart roundabout are solutions to address this problem, but these solutions require more space for construction, continuous maintenance and in addition they are very expensive. An alternative would be to use the driver assistance systems and provide more information, which allows drivers to make appropriate decisions to improve driving, especially in the most complex situations. But in reality, these decisions do not always lead to the desired gain, either at the time of travel, or fuel consumption.
So to solve this problem, the system must be able to analyze and process the data collected in real time, and follows suggestions the most relevant proposals. However, this type
of system can be developed only if they have an efficient and reliable communication in this context that the intelligent transport systems involved and specifically the vehicular ad-hoc networks (VANETs).
VANETs are considered as one of the most important technologies for Intelligent Transportation Systems (ITS), whose goal is to improve safety, better efficiency and usability in road transport through the use of wireless communications. For example, VANETs enable vehicles to connect to the Internet to obtain real time news, traffic and weather reports. VANETs also fuel the vast opportunities in online entertainments for less stress for drivers and passengers, such as gaming and file sharing. For this we use VANETs in our system, which provides an efficient communication infrastructure for faster exchange of information’s.
VANETs are based on mobile ad hoc networks (MANET) that can take advantage of fast communication under two ways between vehicles only (V2V) or between vehicles and infrastructure (V2I)[2, 3], thus making it possible to play a crucial role in providing innovative applications and services [4, 5] in the road transport sector. They have the ability to collect reliable data on real-time traffic for more efficient use of road infrastructure securely.
VANET uses specialized short-range communications (DSRC) [6, 7] to broadcast messages at high speed in several directions [8, 9] because its latency is low, but the cover of this solution is very limited. To overcome this problem, searchers have proposed V2V communication [10, 11], so that vehicles can further communicate with Road Side Unit (RSU), and VANETs does not require a significant investment for implementation. In addition to high-speed connectivity at lower cost, vehicles equipped with VANET devices can take advantage of multiple location technologies with high accuracy [12], either with a relative location [13, 14, 15] or even a global location [16, 17, 18].
Congestion Prevention System (CPS) proposed in this paper is potentially useful for the road transport, this system based on VANET, aims to avoid traffic jams and queues for efficient and optimal use of existing road infrastructure by analyzing data collected in real time.
The rest of this paper is organized as follows: Section 2 the related work. Section 3 we present in detail our system. Section 4 presents the simulation results. Finally, Section 5 gives the conclusions of this work.
2.
Related Work
infrastructure could not be extended in line with the increasing demand, this poses many problems, especially in terms of road safety, waste of time and pollution, and so traffic congestion worsens.
One strategy to reduce congestion is to optimize traffic lights [19, 20] deployed at intersections by analyzing the data collected in real-time traffic. The goal of this optimization is to minimize the waiting time in an intersection and maximize the number of vehicles crossing this intersection. Then, all the lights of the different intersections must be synchronized in order to improve traffic in all directions.
However, local synchronization for one intersection affects all other intersections of the road network. So the desired optimization will not be achieved in neighboring intersections, which could cause more congestion. To remedy this problem, the researchers proposed to favor high-demand roads. Nevertheless, this strategy is inadequate when the traffic is huge and in the event that special events, such as temporary changes or road closures due to work, accidents or other occur. An alternative would be to use the new technologies in the field of communication to collect and send traffic information, in real time, such as information on the state of traffic and places of accidents, for more efficient use of the existing infrastructure.
In [21] the authors proposed an adaptive traffic signal control system based on car-to-car communication. This system reduces the waiting time of the vehicles at the intersection along with the reduction in queue length. To realize this system, the concept of clustering is used for the vehicles approaching the intersection. The density of vehicles within the cluster is computed using a clustering algorithm and sent to the traffic signal controls to set the timing cycle.
In [22] the authors proposed a smart city framework for VANETs that include intelligent traffic lights (ITLs) that are in charge of gathering traffic information from passing vehicles, updating traffic statistics of the city and reporting those statistics to the vehicles. Also, ITLs will send warning messages to vehicles in case of accidents to avoid further collisions.
In [23] the e-NOTIFY system is designed for automatic accident detection, reporting, and assistance of road accidents using the capabilities offered by vehicular communication technologies. This proposed system focuses on improving post collision care with fast and efficient management of the available emergency resources, which increases the chances of recovery and survival for those injured in traffic accidents
In [24], the authors proposed CoTEC (COperative Traffic congestion detECtion), a cooperative technique based on Vehicle-to-Vehicle (V2V) communications and fuzzy logic to detect road traffic congestion without the need to deploy infrastructure sensors. This technique could provide valuable information in real time to road traffic managers.
In [25], the authors proposed an algorithm to detect and quantifies the level of traffic congestion in a completely distributed way, independent of any supporting infrastructure and additional information such as traffic data from local authorities. It relies solely on observation of traffic conditions by each vehicle and information obtained from
other vehicles. And this algorithm ensures the least amount of data is sent which contributes towards reducing the network load, especially important for VANETs since there will be many different applications running on a limited number of channels.
In [26] the authors proposed MNTR to reduce the calculation complexity by focusing on updating the route allocation only after the occurrence of an en route event by updating the routes of vehicles whose the current route includes the blocked road segment. It is worth to mention that MNTR uses two-step routing process as those vehicles will be re-routed only twice (i.e. next turn allocation, then complete route recalculation). So, MNTR can efficiently reduce the average travel time with a minor change of route allocation. In [27] the authors proposed a people-centric approach to vehicular traffic management in urban centers, called APOLO. The main idea of APOLO is to periodically analyze the spatial and temporal parameters of mobility patterns of drivers to manage vehicular traffic flow in urban centers. This approach allows APOLO to explore only the characteristics of public roads (speed limit and length of the roadway) and vehicle density at each moment. Additionally, APOLO can reduce the idle time (around by 50%), and travel time (around by 17%) through a small increase in the total travel distance
Our main goal in this work is to develop the CPS, which can help drivers to have a better trip, to avoid long waiting queues and areas of congestion, and to reduce travel time and fuel consumption, in order to optimize the use of road infrastructure and very fluid traffic.
However, the system needs more data, other than the position of the vehicle and its destination. For this, we use VANETs to collect and examine in real time all the necessary data on driving conditions, by the exchange between vehicles and detection equipment and even between vehicles themselves.
3.
Proposed system
The most recent navigation devices can provide the optimal path based on distance, but when there is an incident
blocking traffic or the traffic flow is higher than roads ability, the path no longer considered optimal perhaps it becomes the longest path, as in this case the optimality is based on minimizing losses than maximizing gains, therefore the distance is not the only criterion that should be taken into account, but other information on the path must be taken as: the maximum speed to be used in each part of the trip, capacity of the road and the number of vehicles that are at the time where the vehicle will take the path and the number of intersections and traffic lights to ensure that the path is the as fast as possible.
3.1 Objective
The main objective of our system is to find the optimal path in different situations, by avoiding the congestions and the long queues, in order to:
• Reduce travel time.
From these gains by exploiting this system, it can also contribute to:
• Reduce waiting time • Reduce congestion.
• Reduce the fuel consumption. • Reduce greenhouse gas emissions. • Reduce the stress of driving. • Improve road safety. 3.2 Methodology
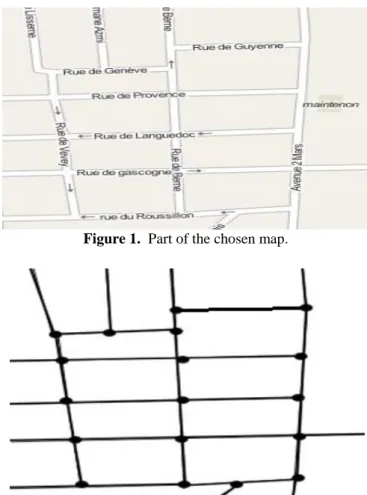
The search for an optimal path first of all requires collecting information on the infrastructure and road traffic to analyze them, this is why the first part of our method consists to the recognition of the road map, in order to represent the map “Figure 1” as a graph “Figure 2” where the edges of this graph correspond to road, and vertices to road intersections.
Figure 1. Part of the chosen map.
Figure 2. The graph that represents the part of the chosen map.
On the other hand, the collection and analysis of data can be a very complex process, especially when the road covered area is large.
For this we will proceed to the division of the map into small areas according to their geometric characterization and capacity. This division of the map “Figure 3”, allow the calculations into each area at same time, this will contribute positively to the performance of our system, especially when searching the optimal path. So therefore, instead of the entire map is represented by a single graph, each area will be represented by a graph, in addition to another global graph where these vertices correspond to the areas and these edges correspond to the optimal paths from the area to adjacent areas.
Figure 3. Division of the map in small area.
The second part is to collecting information’s relating to movements of all vehicles and save them in the database “Figure 4”. The recording is done only in case of change of road, and only two roads ID and the date and time of the change will be recorded in HistoryTrips table for each vehicle, this information will be the basis to provide an estimate of the movement of vehicles in the next step.
The database “Figure 4” also include the ROAD table where the roads must be saved, the ZONE table for small areas of the map divided, the AdjacentZone table for the adjacent areas and the ToZONE table for the temporary optimal path from an area to another area in the map.
The third part consists to predict the travel time for a specific route and in a given time. For example, “Figure 5” the vehicle (C) in road R0 at t0, it has four possibility, either go to R1, R2, R3 or go back to R0, otherwise the selected road is the one with the smallest travel time when the vehicle will arrive to this road. For this we must know the travel time it will be at t1 for R0, R1, R2 and R3, and whether the route chosen is R3 we need to know the time to travel that will be at t2 for R4 and R5, and so on.
Figure 5 The different possibilities for a vehicle arriving at the junction
Thus to determine the travel time of a road, it must firstly estimate the number of vehicles likely to be for this route when the vehicle will arrive to this road. For that we use a recursive function “getNbrVehicle”, this function calculate the difference between the travel time of the road and the provided time for the vehicle arrives at this road, if the result is negative the function return the number of vehicles available in this road. If it isn’t we determine the probability of transition to the road according to historical records indicating the date and time, and also determines the expected number of vehicles for each adjacent road with the same function using the difference already calculated as length entry and then the sum of the product of the probability times we calculate the number of vehicles for all adjacent road.
Algorithm: Number of vehicle in a road, NumberVehicle input: ID of road, IdRoad
input: The time after the vehicle arrives at the road, T output: The estimated number of vehicle, nbrVehicle
1 Begin
2 nbrVehicle = 0
3 If T > TravelTime(IdRoad) Than
4 Foreach r in AdjacentRoad(IdRoad) Do
5 nbrVehicle+=
ProbabilityGoTo(r,IdRoad)*NumberVehicle(r,T-TravelTime(IdRoad))
6 Return nbrVehicle
7 Else
8 Return getNbrVehicle(IdRoad)
10 End
Function to the estimated number of vehicle given a road,the optimal path.
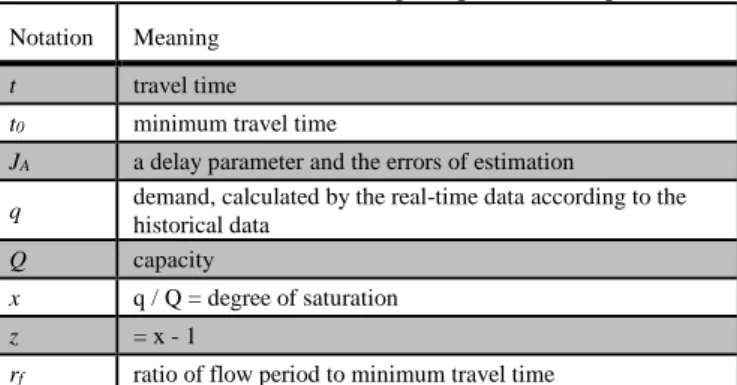
The estimated number of vehicles is used in equation (1), this equation is developed version of the Davidson’s function by Akçelik [28].
()
Table 1. Notation and meaning for parameter equation
Notation Meaning
t travel time
t0 minimum travel time
JA a delay parameter and the errors of estimation
q demand, calculated by the real-time data according to the
historical data
Q capacity
x q / Q = degree of saturation
z = x - 1
rf ratio of flow period to minimum travel time
Akcelik’s equation states that the travel time (t) is equal to the free-flow travel time (t0) plus the average overflow queue (q) divided by the capacity (Q). The average overflow queue divided by capacity is the portion of the equation inside the brackets to the right of “t0”. The equation for the average overflow queue was fitted by Akcelik to take into account variations in queue lengths caused by random variations in arrivals. There is in theory no upper limit on the value of “x” that could be input to this equation since this equation is designed to approximate the delays due to queuing when demand exceeds capacity.
The equation explicitly takes into account the delays caused by queuing and can be applied to any facility type. The assumptions are that there is no queue at the start of the analysis period, and there is no peaking of demand within the analysis period.
The delay parameter JA is a function of the number of delay causing elements in the section of road and the variability of the demand. Akcelik suggests lower values of JA for freeways and coordinated signal systems. Higher values apply to secondary roads and isolated intersections.
In the graph corresponding to the map “Figure 3”, the weight of each edge is the time to travel of the lane that represented this edge in the graph, and now it can easily deduce the adjacency matrix of all graphs that represent 'small areas of the map.
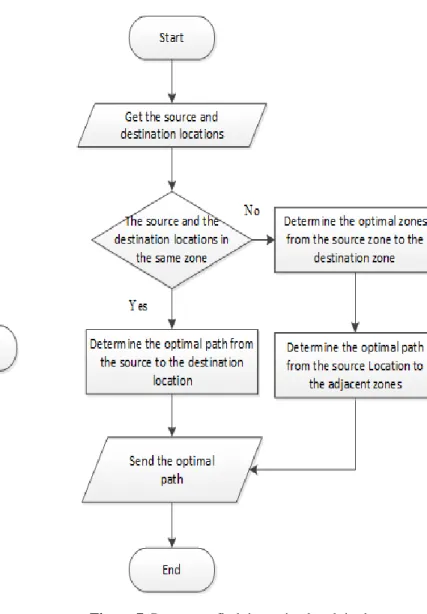
Finally, based on Dijkstra's algorithm [29, 30], we determine the optimal path from the current position of the vehicle to its destination. One of the reasons to use Dijkstra's algorithm is the simplicity of its implementation and performance in static graphs.
Figure 6. Process to find the optimal path in the vehicle. Determining the optimal path is initiated by the vehicle “Figure 6” that sets the coordinates of its destination into the system, then these coordinates and other data is processed by the server of the zone “Figure 7” to find the optimal path. This process of server is repeated at each extremity of road until the vehicle arrives at its destination.
3.3 Architecture
Our approach cannot be implemented unless we have an architecture that can provide value added services; this is why our architecture is largely based on VANETs.
So as already mentioned, the road map “Figure 3” will be divided into several zones, and each zone “Figure 8” must have a road side unit (RSU) connect to a server that milking and the information stored in databases.
Figure 7. Process to find the optimal path in the server
Figure 8. System architecture
4.
Simulation
4.1 The Simulation platform
SUMO is a free software simulator, is a microscopic traffic flow, designed to handle large real road maps and combining SUMO with OpenStreetMap, which simulates traffic in different parts of the world.
SUMO has the ability to run as a server to provide dynamic simulation Traffic Control Interface (TraCI) [31] that uses the TCP protocol, which allows the change of scenario when running.
4.2 Simulation scenario
To test the effectiveness of our system, we consider a real map “Figure 3” and 10000 vehicles to get a huge amount of traffic.
Order to highlight the impact of our system on traffic, we consider multiple scenarios, and in each scenario we randomly selected a specific number of vehicles in different stages of simulation and different places in the map.
The vehicles chosen to use our system to determine the optimal path, on the other side the other vehicles consider the shortest path as the optimal path.
During the execution of the all scenarios we collect location, speed and quantity of greenhouse gas released for each vehicle.
4.3 Results
Figure 9. The average speed of all vehicles in each scenario “Figure 9” which illustrates the average speeds of all vehicles in each scenario. We note that, if the selected number of vehicles increases, the average speed is increasing too. This indicates that the waiting time decreases for the chosen vehicles, which implies the reduction of travel time.
Figure 10. The average of fuel consumption in each scenario
And in “Figure 10” which illustrates the average fuel consumption of all vehicles during displacement in each scenario. We note that if the number of selected vehicles
increases, the average fuel consumption decrease. This indicates that travel time is decreasing for selected vehicles.
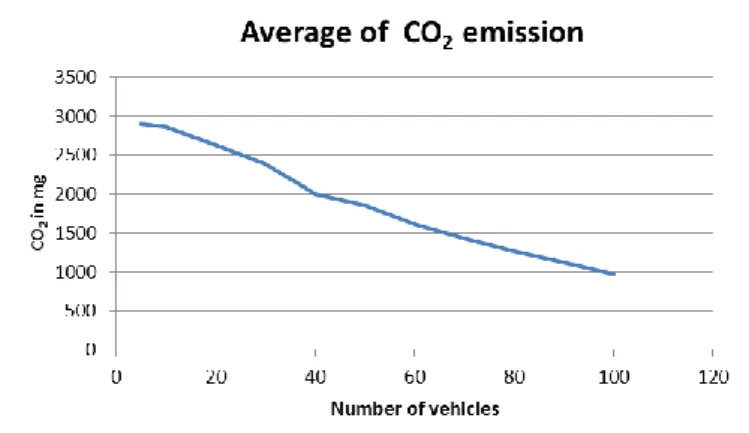
Figure 11. The average of CO2 emission in each scenario
But in “Figure 11” shows that if the number of selected vehicles increases, the average CO2 emission decreases. Therefore, the minimum travel time of the chosen vehicles also allows for savings in fuel consumption “Figure. 10”, and reduces the amount of greenhouse gas emissions “Figure. 11”.
Figure 12. The traffic CO2 emissions in the first scenario.
system the CO2 emissions are scattered in almost all roads of the map.
The more road traffic increases, the more solutions exist to improve traffic flow becomes inadequate, but using our system helps to avoid congestion and consume less energy. Thus, this system has many advantages in the economic, environmental, social and even the long waiting time at which the driver stress.
5.
Conclusions
This paper addresses the problem of optimal path in road networks, where we proposed we present a Congestion Prevention System (CPS) based on new approach [1]. CPS is potentially useful for traffic fluidity, it use the information provided in real time by VANET, and the history of the vehicles moving to get the optimal path from the source to the destination location. It can supports a very large road networks, by dividing the road network into several independent zones.
The simulation results confirm the effectiveness of this system; it reduces the travel time in case of congestion, and therefore helps to improve traffic flow and road safety. In the future, we aim the development and validation of our technology by comparing the results with data from different field.
References
[1] H. Toulni, B. Nsiri, M. Boulmalf, M. Bakhouya and T. Sadiki, "An approach to avoid traffic congestion using VANET," 2014 International Conference on Next Generation Networks and Services (NGNS), Casablanca, pp. 154-159, 2014.
[2] S. Panichpapiboon and W. Pattara-Atikom, “A review of information dissemination protocols for vehicular ad hoc networks,” IEEE Communications Surveys and Tutorials, vol. 14, no. 3, pp. 784–798, 2012.
[3] S. Sulistyo and S. Alam, "Distributed Channel and Power Level Selection in VANET Based on SINR using Game Model," International Journal of Communication Networks and Information Security (IJCNIS), vol. 9, no. 3, pp. 432 - 438, 2017.
[4] Mahlknecht S. and Madani S., “On Architecture of Low Power Wireless Sensor Networks for Container Tracking and Monitoring Applications,” in Proceedings of 5th IEEE International Conference Industrial Informatics,pp. 353-358, 2007.
[5] Barba, C.T. Mateos, M.A. ; Soto, P.R. ; Mezher, A.M. ; Igartua, M.A.“ Smart city for VANETs using warning messages, traffic statistics and intelligent traffic lights” in Conference Publications on Intelligent Vehicles Symposium (IV), IEEE, pp. 902 - 907, 2012.
[6] Ion Turcanu, Florian Klingler, Christoph Sommer, Andrea Baiocchi, Falko Dressler, Duplicate suppression for efficient floating car data collection in heterogeneous LTE-DSRC vehicular networks, Computer Communications,Volume 123,Pages 54-64,2018.
[7] Cseh C., “Architecture of the Dedicated Short-Range Communications (DSRC) Protocol,” in roceedings of IEEE Vehicular Technology Conference, pp. 45-49, 1998.
[8] W. Whyte, “Safe at Any Speed: Dedicated Short Range Communications (DSRC) and On-road Safety and Security,” RSA Conference 2005
[9] Vehicle Safety Communications Consortium, “Vehicle Safety Communications Project Task 3 Final Report,Identify Intelligent Vehicle Safety Applications Enabled by DSRC,” March 2005.
[10] D. W. Franz, “Car-to-car Communication –Anwendungen und aktuelle Forschungsprogramme in Europa, USA und Japan”, in Kon-gressband zum VDE-Kongress 2004 – Innovationen für Menschen, VDE, October 2004.
[11] S. Eichler et al., “Strategies for context-adaptive message dissemination in vehicular ad hoc networks”, in Proceedings of the 2nd International Workshop on Vehicle-to-Vehicle Communications (V2VCOM), July 2006.
[12] R.Parker and S.Valaee, «Vehicle Localization in Vehicular Networks », Vehicular Technology Conference, 2006. VTC-2006 fall. IEEE 64th, pp. 1–5.
[13] A.Benslimane, « Localization in vehicular Ad-hoc networks », Proceedings of the Systems Communications (ICW’05). 2005
[14] V. Kukshya, H. Krishnan, and C. Kellum, « Design of a system solution for relative positioning of vehicles using vehicle-to-vehicle radio communications during GPS outages », in Proceedings of IEEE Vehicular Technology Conference (VTC), September 2005.
[15] A.Boukerche, H.A.B.F.Oliveira and E.F.Nakamura, «Vehicular Ad Hoc Networks: A New Challenge for Localization-Based Systems». Computer Communications, Vol. 31, No. 12., pp. 2838-2849, 30 July 2008.
[16] B. Hofmann-Wellenho, H. Lichtenegger, J. Collins, Global Positioning System: Theory and Practice, 4th ed., Springer-Verlag, 1997.
[17] E.D. Kaplan, Understanding GPS: Principles and Applications, Artech House, 1996.
[18] M. Chen, D. Haehnel, J. Hightower, T. Sohn, A. LaMarca, I. Smith, D. Chmelev, J. Hughes, F. Potter, Practical metropolitan-scale positioning for GSM phones, in: Proceedings of 8th Ubicomp, Orange County, California, pp. 225–242, 2006.
[19] M.Wiering, J.Veenen, J.Vreeken, A.Koopman “Intelligent Traffic Light Control” Technical Report Dept. of Information and Computing Sciences, Universiteit Utrecht, 2004
[20] P.Gregoire, C.Desjardins, J.Laumonier, B. Chaib-draa, “Urban Traffic Control Based on Learning Agents,” in Proc. Of Conf. on Intelligent Transportation Systems, pp. 916-922, 2007.
[21] N. Maslekar, M. Boussedjra, J. Mouzna and H. Labiod, "VANET Based Adaptive Traffic Signal Control," 2011 IEEE 73rd Vehicular Technology Conference (VTC Spring), Yokohama, pp. 1-5, 2011.
[22]C. T. Barba, M. Á. Mateos, P. R. Soto, A. M. Mezher and M. A. Igartua, "Smart city for VANETs using warning messages, traffic statistics and intelligent traffic lights," 2012 IEEE Intelligent Vehicles Symposium, Alcala de Henares, pp. 902-907, 2012.
[23] Fogue, M., Garrido, P., Martinez, F.J., Cano, J.-C., Calafate, C.T., Manzoni, P., and Sanchez, M.: "Prototyping an automatic notification scheme for traffic accidents in vehicular networks," 2011 IFIP Wireless Days (WD), Niagara Falls, ON, pp. 1-5, 2011.
[24] R. Bauza, J. Gozalvez and J. Sanchez-Soriano, "Road traffic congestion detection through cooperative Vehicle-to-Vehicle communications," IEEE Local Computer Network Conference, Denver, CO, pp. 606-612, 2010.
[25]M. Milojevic and V. Rakocevic, “Distributed vehicular traffic congestion detection algorithm for urban environments,” In Vehicular Networking Conference (VNC), pp. 182 – 185, 2013.
[26]S. Wang, S. Djahel and J. McManis, "A Multi-Agent based vehicles re-routing system for unexpected traffic congestion avoidance," 17th International IEEE Conference on Intelligent Transportation Systems (ITSC), Qingdao, pp. 2541-2548, 2014.
[27] A. T. Akabane, R. L. Gomes, R. W. Pazzi, E. R. M. Madeira and L. A. Villas, "APOLO: A Mobility Pattern Analysis Approach to Improve Urban Mobility," GLOBECOM 2017 - IEEE Global Communications Conference 2017, Singapore, pp. 1-6, 2017.
[28] Akçelik , Rahmi. Travel Time Functions for Transport Planning Purposes: Davidson's Function, its Time-Dependent Form and an Alternative Travel Time Function. In Australian Road Research, 21(3, pp 49-59), September 1991.
technology: Advances in database technology, EDBT’08, pages 205–216, New York, NY, USA. ACM, 2008.
[30] L. S. Buriol, M. G. C. Resende, and M. Thorup.Speeding up dynamic shortest path algorithms. In INFORMSJournal on Computing, submitted, 2003.