R E S E A R C H
Open Access
Effects of airway obstruction and
hyperinflation on electrocardiographic axes
in COPD
Peter Alter
1*†, Henrik Watz
2†, Kathrin Kahnert
3, Klaus F. Rabe
4, Frank Biertz
5, Ronald Fischer
5, Philip Jung
6,
Jana Graf
7, Robert Bals
8, Claus F. Vogelmeier
1and Rudolf A. Jörres
7*Abstract
Background:COPD influences cardiac function and morphology. Changes of the electrical heart axes have been largely attributed to a supposed increased right heart load in the past, whereas a potential involvement of the left heart has not been sufficiently addressed. It is not known to which extent these alterations are due to changes in lung function parameters. We therefore quantified the relationship between airway obstruction, lung hyperinflation, several echo- and electrocardiographic parameters on the orientation of the electrocardiographic (ECG) P, QRS and T wave axis in COPD.
Methods:Data from the COPD cohort COSYCONET were analyzed, using forced expiratory volume in 1 s (FEV1), functional residual capacity (FRC), left ventricular (LV) mass, and ECG data.
Results:One thousand, one hundred and ninety-five patients fulfilled the inclusion criteria (mean ± SD age: 63.9 ± 8.4 years; GOLD 0–4: 175/107/468/363/82). Left ventricular (LV) mass decreased from GOLD grades 1–4 (p = 0.002), whereas no differences in right ventricular wall thickness were observed. All three ECG axes were significantly associated with FEV1 and FRC. The QRS axes according to GOLD grades 0–4 were (mean ± SD): 26.2° ± 37.5°, 27.0° ± 37.7°, 31.7° ± 42.5°, 46.6° ± 42.2°, 47.4° ± 49.4°. Effects of lung function resulted in a clockwise rotation of the axes by 25°-30° in COPD with severe airway disease. There were additional associations with BMI, diastolic blood pressure, RR interval, QT duration and LV mass.
Conclusion: Significant clockwise rotations of the electrical axes as a function of airway obstruction and lung hyperinflation were shown. The changes are likely to result from both a change of the anatomical
orientation of the heart within the thoracic cavity and a reduced LV mass in COPD. The influences on the electrical axes reach an extent that could bias the ECG interpretation. The magnitude of lung function impairment should be taken into account to uncover other cardiac disease and to prevent misdiagnosis.
Keywords: COPD, Airway obstruction, Hyperinflation, Electrocardiographic axis, P wave axis, QRS axis, T wave axis
© The Author(s). 2019Open AccessThis article is distributed under the terms of the Creative Commons Attribution 4.0 International License (http://creativecommons.org/licenses/by/4.0/), which permits unrestricted use, distribution, and reproduction in any medium, provided you give appropriate credit to the original author(s) and the source, provide a link to the Creative Commons license, and indicate if changes were made. The Creative Commons Public Domain Dedication waiver (http://creativecommons.org/publicdomain/zero/1.0/) applies to the data made available in this article, unless otherwise stated.
* Correspondence:[email protected]; [email protected]
†Peter Alter and Henrik Watz contributed equally to this work.
1Department of Medicine, Pulmonary and Critical Care Medicine, Philipps
University of Marburg (UMR), Member of the German Center for Lung Research (DZL), Baldingerstrasse 1, 35033 Marburg, Germany
7
Institute and Outpatient Clinic for Occupational, Social and Environmental Medicine, Ludwig Maximilians University (LMU), Comprehensive Pneumology Center Munich (CPC-M), Member of the German Center for Lung Research (DZL), Ziemssenstrasse 1, 80336 Munich, Germany
Background
Cardiovascular comorbidities are common in patients with chronic obstructive pulmonary disease (COPD) [1–3]. This includes morphological and functional alterations of the heart. For example, the severity of COPD is known to be inversely related to left ventricular (LV) size and mass [4–6]. One of the basic diagnostic criteria for cardiac dis-orders is the definition of the electrical axes from the standard surface electrocardiogram (ECG) [7]. These are the P wave, QRS and T wave axes that can be obtained by established algorithms. The QRS axis is related to the spread of left and right ventricular (RV) depolarization, be-ing dominated by the LV, since its muscular mass far ex-ceeds that of the RV. A common alteration, for instance, is a counterclockwise leftward shift associated with LV hypertrophy resulting from hypertension. The P wave axis reflects atrial depolarization, with changes being suggestive of either left or right atrial predominance, and the T wave finally reflects ventricular repolarization. Due to alterations of the heart in COPD, changes in the orientation of the electrical axes are to be expected independent of or in addition to primary cardiac disease.
Verticalization of the P wave axis in COPD has been reported [8–10], as well as a positive correlation between the P wave vector and radiographic evidence of emphy-sema [11]. Increased heart rate is a common finding in COPD and linked to its severity and prognosis [12]. As-sociated changes of de- and repolarization may also interfere with the orientation of the axes. Additionally, the mechanical environment of the heart is likely to be altered by lung hyperinflation and changes in intratho-racic pressures due to airway obstruction, also poten-tially exert influences. However, it is unclear how changes in the different lung function measures correl-ate with the magnitude of this effect, and whether the various types of axes are impacted differently. Such data are of clinical interest, as alterations in the electrical axes resulting purely from changes in lung function might bias the cardiologic diagnostic interpretation.
We therefore hypothesized that the electrical axes of the heart are related to lung function in patients with COPD. Airway obstruction and hyperinflation were eval-uated as numerical predictors of the electrical heart axes.
Methods
Study cohort and participants
The study was performed using a subset of the baseline data of the German COPD cohort COSYCONET, which is a prospective, observational, multi-center cohort study in patients with stable COPD that aims to evaluate the role of comorbidities [13–15], including the relationship between lung and cardiovascular disease by ECG analysis and echocardiography [16,17]. All study participants gave
their written informed consent. The criteria of airflow limitation proposed by the Global Initiative for Obstruct-ive Lung Disease (GOLD) [18] were applied to define spi-rometric GOLD grades 1–4.
For the present analysis, we used data from the re-cruitment phase and excluded patients with more than moderate heart valve disease, heart valve replacement, or other cardiac devices such as pacemakers/cardioverter--defibrillators. The analysis was restricted to patients with sinus rhythm and several criteria of completeness and plausibility of lung function, echocardiographic and ECG data were applied (see Additional file 1: Methods and Figure E1) [16,17].
Assessments
Spirometry and body plethysmography were performed following the recommendations of the American Thor-acic Society (ATS)/European Respiratory Society (ERS) [19] and Deutsche Gesellschaft für Pneumologie und Beatmungsmedizin (DGP) [20–23], after inhalation of 400μg salbutamol and 80μg ipratropium bromide [13]. As a measure of lung hyperinflation, we chose functional residual capacity (FRCpleth; intra-thoracic gas volume,
ITGV), the residual volume (RV), total lung capacity (TLC), and their ratio RV/TLC and forced expiratory volume in 1 s (FEV1) for airway obstruction. The
diffus-ing capacity for carbon monoxide (TLCO) was deter-mined via duplicate assessments of the single-breath method, and the transfer coefficient (KCO) as ratio of TLCO and alveolar volume (VA). Echocardiography was performed as recommended by the American Society of Echocardiography and the European Association of Car-diovascular Imaging [24]. The assessments included the left ventricular end-diastolic and end-systolic diameter (LVEDD, LVESD), LV mass and the right ventricular (RV) wall thickness as indicator of RV hypertrophy as well as heart rate lowering medication. Besides the elec-trical axes, we selected the ECG derived RR interval as measure of heart rate, and QT duration as measure of repolarization. Standard ECG were obtained and ana-lyzed using the recorder EL10 (VERITAS™, 9515– 001-50-ENG REV A1, Mortara Instruments, Inc., Mil-waukee, Wisconsin, USA).
Data analysis
FEV1 and FRC were evaluated as percent predicted
values [25–27]. Cardiac size was expressed as LV mass normalized to body surface area [g/m2]. The RR interval was obtained as the mean of 10.88 ± 2.08 (mean ± SD) consecutive QRS complexes. The QT duration was used as measured, i.e. without heart rate correction, since heart rate was considered as distinct parameter.
computed. Differences between groups were evaluated via analysis of variance (ANOVA) and by Tukey-HSD post-hoc comparisons. Univariate multiple linear regres-sion analyses were employed to determine the influences of sex, age and medication on the different variables. Variables were adjusted for these three influencing fac-tors via computation of non-standardized residuals and used for further analyses. Multivariate multiple linear re-gression analyses were used to determine the associa-tions between FEV1% predicted, FRC % predicted, BMI
and diastolic blood pressure as predictors, and LV mass, RR interval, QT duration, P wave axis, QRS axis and T wave axis as dependent variables. For all estimates of re-gression coefficients, 95% confidence intervals were computed.
To disentangle the multiple relationships between the measured variables, structural equation modelling (SEM) was employed [14,16,17,28,29]. The construct named
“ECG axes” comprised the P wave, QRS and T wave axes. The goodness of fit was evaluated by the compara-tive fit index (CFI) and the root mean square error of approximation (RMSEA). Chi-square data are also given. For all computations the software IBM SPSS Statistics 24.0.0.1 and Amos 24.0.0 (Wexford, PA, USA) was used. Statistical significance was assumed forp< 0.05.
Results
Study population
A total of 1195 stable COPD patients were analyzed. The selection process of the cohort is depicted in Add-itional file 1: Figure E1, and baseline characteristics are shown in Table 1. LV mass decreased significantly from GOLD grades 1–4 (mean ± SD: 111.5 ± 34.0, 109.5 ± 34.1, 103.0 ± 36.1, 97.6 ± 34.9 g/m2; p = 0.002), whereas no differences in RV wall thickness were observed (mean ± SD: 6.2 ± 6.1, 5.7 ± 3.3, 5.9 ± 2.3, 6.3 ± 4.4 mm).
Electrical axes as related to GOLD grades
When averaged over the whole study population, the ori-entations of P wave, QRS and T wave axes differed significantly from each other (mean ± SD: 60.5° ± 25.0°, 36.1° ± 42.6°, 53.3° ± 23.1°, respectively; repeated-measures by ANOVA and Bonferroni-corrected comparisons, p < 0.001 for each pairwise comparison).
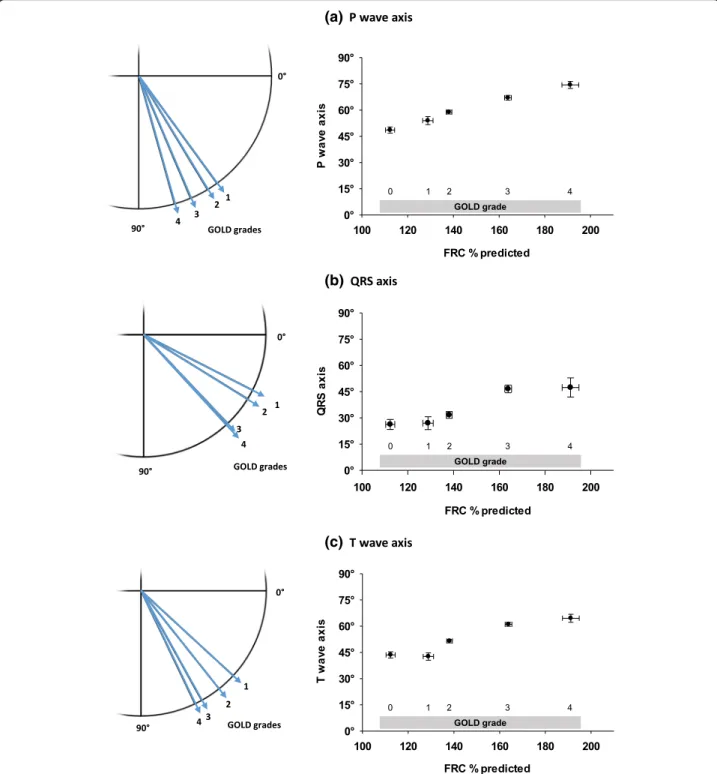
The mean orientation of the P wave axis according to the spirometric GOLD grades 0–4 is illustrated in the left panel of Fig. 1a, while the right panel shows the values plotted against mean values of FRC % predicted observed for each GOLD grade. The rotation of the P wave axis significantly increased across the GOLD grades (p< 0.001). Pairwise post hoc comparisons of the axis orientations between GOLD grades revealed signifi-cant (p< 0.05 each) differences, except between grade 0 and 1 and between grade 1 and 2.
In a similar manner, mean QRS axes are illustrated in Fig. 1b. Again, values significantly differed across GOLD grades (p < 0.001). There was a clear trend to-wards an increased clockwise rotation in more severe airflow limitation. Post hoc comparisons revealed sig-nificant (p < 0.05 each) differences between a disease severity not exceeding moderate grades (GOLD 0 to 2) compared with severe to very severe COPD (GOLD 3 and 4). The relationship of the QRS orien-tation to FRC % predicted across GOLD grades is illustrated.
The results for the mean T wave axis are analo-gously shown in Fig. 1c, with a significant difference across all GOLD grades (p < 0.001). There were sig-nificant (p < 0.05 each) differences between all GOLD
Table 1Baseline characteristics of the study cohort (n= 1195)
Parameter Mean values ± SD
or numbers
Anthropometry
Age, years 63.9 [±8.4]
Sex, m/f 677/518
BMI, kg/m2 26.7 [±5.0]
Diastolic blood pressure, mmHg 75.0 [±10.4]
Lung function
GOLD 0/1/2/3/4 175/107/468/363/82
FEV1% predicted 58.8 [±20.7]
FRC % predicted 145.0 [±34.9]
RV, l 3.77 [±1.15]
TLC, l 7.16 [±1.46]
RV/TLC 0.52 [±0.11]
TLCO % predicted 59.9 [±22.8]
KCO % predicted 67.5 [±22.9]
Echocardiographic measures
LVEDD, mm 47.5 [±6.5]
LVESD, mm 31.2 [±6.6]
LV mass, g/m2 106.6 [±34.5]
RV wall thickness, mm 5.9 [±3.5]
Electrocardiogram
RR interval, ms 847.8 [±137.2]
QT duration, ms 386.3 [±29.5]
P wave axis, degree 60.5 [±25.0]
QRS axis, degree 36.1 [±42.6]
T wave axis, degree 53.3 [±23.1]
grades, except between grade 0 and 1 and between grade 3 and 4. Again, the relationship to the mean values of FRC % predicted for the different GOLD grades is shown.
Changes of the electrical axes due to the extent of lung function impairment
We assessed the magnitude of the relationship between ECG axes and lung function using multivariate multiple
(a)
(b)
(c)
linear regression analysis, with the three ECG axes as dependent variables against FEV1 % predicted and FRC
% predicted as covariates. In accordance with the GOLD definition of COPD [18], this subanalysis was purely re-stricted to GOLD grades 1–4 (n = 1020). Additional file
1: Table E1 shows regression coefficients of FEV1 and
FRC as predictors of the electrical axes. Since both pre-dictors are cross-linked with each other and FRC is not always available in clinical practice, the analysis was re-run using FEV1 as predictor only. The estimated
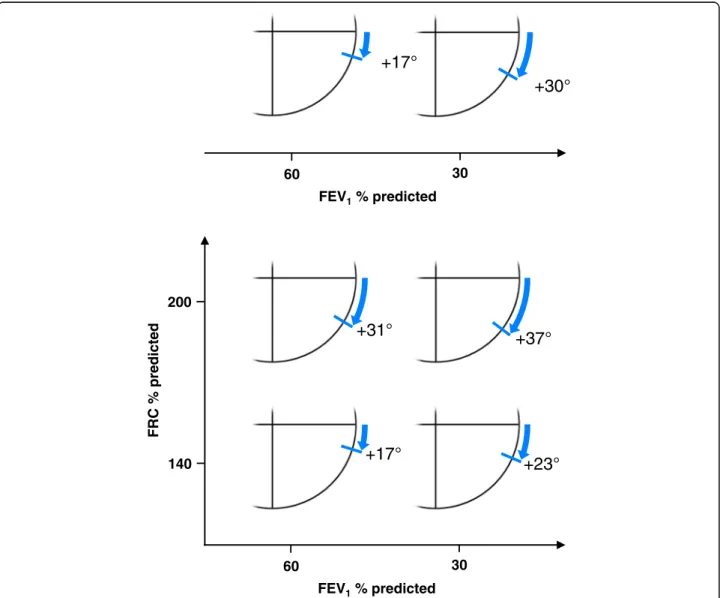
incre-mental rotation of the QRS axis as a function of FEV1
(univariate analysis) and as function of both FEV1 and
FRC (bivariate analysis) is illustrated in Fig.2. This ana-lysis demonstrates that airway obstruction and hyperin-flation are significant predictors of the electrical axes
(for regression analyses including the P and T wave axis see Additional file1: Figure E2).
The measured distribution of the QRS axis across standard sectors is shown in Additional file1: Figure E3. It is noteworthy that when influences of FEV1and FRC
were subtracted, the distribution of the QRS axes shifts from a vertical type (sector 60° to 90°, upper panel) to a normal (sector 30° to 60°) as the most frequent type (lower panel).
Adjustment for sex, age and medication
To account for possible effects of confounders on mea-sured variables, we also evaluated their relationship to sex, age and heart rate-lowering medication using univariate multiple linear regression analyses. All parameters showed
+17°
+30°
FEV1% predicted
FRC
%
predicted
140 200
60 30
+31°
+37°
+17°
+23°
60 30
FEV1% predicted
Fig. 2Upper panel: Estimated incremental clockwise rotation of the QRS axis based on FEV1in univariate regression analysis (see Additional file1:
Table E1) for mild or severe airway obstruction (FEV160 or 30% predicted, GLI). Lower panel: Estimated incremental clockwise rotation of the QRS
axis based on bivariate regression analysis taking into account both FEV1and FRC (see Additional file1: Table E1). The circle segments show the
estimated effects of lung function on the electrical rightward rotation for four combinations of mild or severe obstruction (FEV160 or 30%
a significant dependence on sex except FEV1% predicted
and diastolic blood pressure, whereas age was significantly associated with FEV1and FRC % predicted, diastolic blood
pressure, LV mass and QRS and T wave axis. Heart rate lowering medication (including betablockers, verapamil-type calcium channel blockers [phenylalkylamines] and ivabradine), was significantly related only to FEV1 and
FRC % predicted (p< 0.05 each). In all following analyses we used the values that were adjusted for sex, age and medication according to these results.
Effects of lung function, LV mass, RR interval and QT duration on the electrical axes
The relationship between the selected ECG and echocar-diographic LV mass as dependent variables, and FEV1%
predicted, FRC % predicted, BMI and diastolic blood pressure as covariates was determined by multivariate multiple linear regression analysis. FEV1% predicted was
correlated with the RR interval, the QT duration and all three electrical axes. FRC % predicted correlated with the RR interval, QT duration and the three axes. BMI
was associated with all dependent variables, with the ex-ception of QT duration. Diastolic blood pressure corre-lated with all variables except LV mass and the T wave axis (Additional file1: Table E2).
Comprehensive structural equation modelling
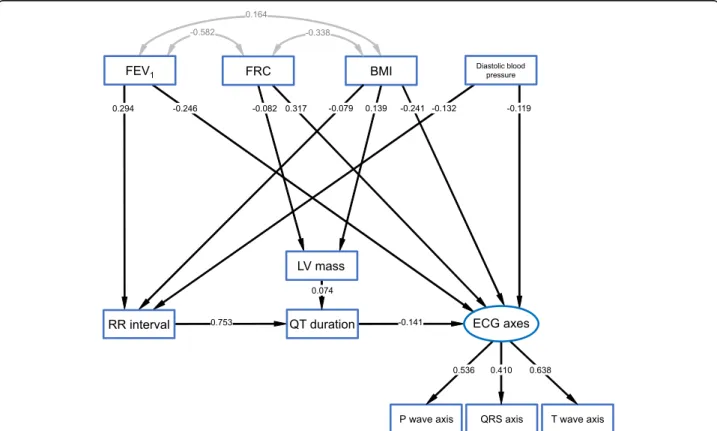
Given these multiple interdependences between parame-ters, we aimed to determine their relative importance in a network of associations via SEM, which is an extension of multiple regression and factor analysis [14, 16]. The SEM that showed the best fit and which represented a consistent and interpretable network of relationships is shown in Fig. 3; the estimates of the respective regres-sion coefficients and covariances are given in Additional file 1: Table E3. The model comprised a latent variable named “ECG axes” which summarizes the information from the P wave, QRS and T wave axis. Although the mean values of the QRS axis were different from those of the P and T wave axes (Fig.1), they could be summa-rized in one latent variable, since all of them were highly correlated with each other and depended in a similar
BMI
QT duration
QRS axis
P wave axis T wave axis
LV mass
ECG axes
Diastolic blood pressure
RR interval
FEV1 FRC
0.164
0.294
-0.582 -0.338
-0.246 -0.082 0.317 -0.079 0.139 -0.241 -0.132 -0.119
0.753
0.074
-0.141
0.536 0.410 0.638
Fig. 3Structural equation model (SEM) providing a comprehensive description of the multiple relationships between influencing factors (top) and dependent variables (below). All measured (manifest) variables are indicated by rectangles. A latent variable (indicated by an oval) named
manner on the covariates. LV size was represented by LV mass, which was related to the QT duration. The RR interval was connected to the QT duration, and this was connected to the ECG axes. This pattern of relationships fitted the data very well which was confirmed by the high values of critical ratios in Additional file 1: Table E3. The model showed a chi-squared value of 45.5, with 27 degrees of freedom (p = 0.014); the CFI was 0.992, with an RMSEA of 0.024 (90%CI 0.011; 0.036), which in-dicates an acceptable model that does not significantly deviate from the data. A detailed sensitivity analysis is given in Additional file1: Results.
Discussion
The present study demonstrates significant associations of the degree of airway obstruction and lung hyperinfla-tion with the orientahyperinfla-tion of the electrocardiographic heart axes in patients with COPD. The association comprised direct influences of both FEV1, a measure of
airway obstruction, and FRC, a measure of lung hyperin-flation, but there were also indirect influences that were mediated through associations with other variables, in-cluding LV mass, the RR interval and the QT duration. This network of relationships was studied by using structural equation modelling as a statistical method de-signed to describe such networks. These relationships appear to be plausible from a pathophysiological point of view. Besides well-known qualitative influences of lung disease on the electrical heart axes, the present study for the first time quantifies influences of the mag-nitude of lung function impairment.
Determination of the QRS axis is a basic diagnostic criterion that is commonly used clinically to gain evi-dence, e.g. for LV hypertrophy, but also for an increased right heart load, e.g. due to pulmonary hypertension or pulmonary embolism. The large clockwise rotations of about 25 degrees on average significantly affect the judgement of the electrical type. This helps to uncover other cardiac disease and to prevent misdiagnosis, which is particularly valuable as on the one hand patients with COPD often have cardiac disease, but there are also sig-nificant numbers of individuals without such concomi-tant disorders [30]. For instance, assuming a patient who developed LV hypertrophy as consequence of long-term hypertension. Usually, a left-axis deviation of the QRS complex could be expected. Concomitant COPD can lead to a shift of the vector into the normal range, and thus presence of hypertrophy could be masked. Vice versa, also presence of COPD contributing to an incre-mental clockwise rotation could be overlooked, when al-legedly normal values were found. The present study allows a numerical correction of the measured axis for influences of lung function, univariate based on FEV1
only and bivariate based on both FEV1and FRC.
It is conceivable that lung hyperinflation affects the ana-tomical axis of the heart mechanically within the thoracic cavity, and consequently the electrical axes. An interesting finding was that airway obstruction in terms of FEV1also
played a role despite the fact that a decrease of FEV1and
consecutive increases in FRC are generally related to each other; i.e. an increase in FRC may be due to expiratory flow limitation during tidal breathing in dynamic hyperin-flation or reduced elastic recoil in static hyperinhyperin-flation. Both mechanisms may not be strictly related to FEV1but
may affect heart function, e.g. by a reduced venous return due to increased thoracic and gastric pressure [31] and by an impaired transpulmonary flow in emphysema [4]. In-deed, based on z-scores, 948 out of 1195 participants (79.3%) were below the lower limit of normal (LLN) of TLCO, and only 247 equal or above.
Interestingly, the two lung function parameters worked in parallel on the ECG axes, but were to some extent counteracted by those of BMI, which was corre-lated with both FRC and FEV1. Therefore, it can be
hy-pothesized that patients with high FRC and low FEV1
would demonstrate particularly strong effects on the ro-tations of the electrical axes if they also have a low BMI, e.g. in cachectic patients with pulmonary emphysema. It seems noteworthy that the direct influences of FRC and FEV1on LV mass indicated a cardiac response to
hyper-inflation, which was linked to the QT duration that was also affected via the RR interval. Since the QRS axis de-pends on the electrical depolarization of both ventricles, one could argue that potential changes of the RV may have affected the findings. However, this appears un-likely, since no differences of the echocardiographic RV wall diameter or RV function was observed among GOLD grades. Moreover, the contributory extent of the RV to the QRS axis appears minor than that of the LV due to the much less RV mass.
Thus, we suggest that a superimposition of several ef-fects rather than one sole dominator was responsible for the observed deviation of axes due to lung function. The regression coefficients suggest that the direct effects from FEV1, FRC, and BMI on the axes were dominant
over indirect effects as mediated via interposed variables (SEM, Fig. 3). For quantification, the respective coeffi-cients of the cascade of correlations (Additional file 1: Table E3) can be multiplied.
In the analyses using unadjusted values, there were significant differences among the average orientation of the three electrical axes. Moreover, there was a strong dependence of the axes on spirometric GOLD grades. Different slopes in the correlations of atrial and ven-tricular axes with lung function were observed. The QRS axis showed a stronger correlation with FEV1and
T wave coefficient, indicating ventricular repolarization, is near to the ventricular QRS, which is not unexpected. Greater influences of lung function on the ventricular than on the atrial axis became also apparent when using FEV1 as predictor only (Fig. 3). This may result from a
decrease of LV mass and/or size in increased COPD se-verity. Whether this truly reflects different mechanical effects or different phenotypes of COPD in terms of bronchitis and emphysema, cannot be determined from our data. In addition, morphological changes of the RV could interfere with the QRS and T wave axis.
Limitations
Due to potential difficulties in obtaining echocardiography in patients with hyperinflation, meticulous criteria on plausibility and completeness were applied, which is reflected in the selection process and resulted in this subset of COSYCONET. Significant clockwise rotations of the electrical heart axes as a function of airway obstruction and lung hyperinflation were shown. It is likely that the ob-served changes result from both a rotation of the heart within the thoracic cavity and a reduced LV mass in COPD. Therefore, it would be worth knowing whether these find-ings on the electrical rotation were paralleled by a rotation of the anatomical heart axis, e.g. as assessable by cardiac computed tomography or magnetic resonance imaging. However, these data were not available for the examined cohort. Nevertheless, assessment of the electrical heart type based on the surface ECG is the diagnostic standard pro-cedure, and considering quantitative influences of lung function is crucial for its accurate interpretation.
Conclusions
The present study shows significant clockwise rotations of the electrical heart axes as a function of both airway obstruction and lung hyperinflation. Besides these direct effects, intermediate factors such as LV mass, heart rate and QT duration, were quantified. Lung function im-pairment affected the P wave, QRS and T wave axis in the same clockwise direction, which is compatible with a rotation of the heart within the thoracic cavity. More-over, the degree of rotation was greater for the ventricu-lar QRS and T wave axis than for the atrial P wave axis, which indicates a differential response. The decrease of LV mass, which is correlated with COPD severity, ap-pears to contribute to the ventricular QRS axis rotation. These influences on the electrical axes reach an extent that could bias the interpretation of the ECG in severe COPD. Since assessment of the electrical heart axes based on the surface ECG is a diagnostic standard pro-cedure, the magnitude of lung function impairment should be taken into account on a numerical basis in order to prevent misdiagnosis in concomitant cardiac and pulmonary disease.
Additional files
Additional file 1:Supplementary methods, results and discussion. (DOCX 225 kb)
Abbreviations
CFI:Comparative fit index; COPD: Chronic obstructive pulmonary disease; ECG: Electrocardiogram; FEV1: Forced expiratory volume in 1 s;
FRC: Functional residual capacity by bodyplethysmography (FRCpleth;
intra-thoracic gas volume, ITGV); GOLD: Global Initiative for Obstructive Lung Disease; KCO: Carbon monoxide (CO) transfer coefficient (ratio of TLCO and alveolar volume); LV: Left ventricle/ventricular (by echocardiography); LVEDD: Left ventricular diastolic diameter; LVESD: Left ventricular end-systolic diameter; RMSEA: Root mean square error of approximation; RV: Right ventricle/ventricular (by echocardiography); RV/TLC: Residual volume to total lung capacity ratio (by bodyplethysmography); SEM: Structural equation modelling; TLCO: Transfer factor of carbon monoxide (CO)
Acknowledgment
This work was supported by the German Federal Ministry of Education and Research (BMBF) Competence Network Asthma and COPD (ASCONET) and performed in collaboration with the German Centre for Lung Research (DZL). The project is funded by the BMBF with grant number 01 GI 0881, and is supported by unrestricted grants from AstraZeneca GmbH, Bayer Schering Pharma AG, Boehringer Ingelheim Pharma GmbH & Co. KG, Chiesi GmbH, GlaxoSmithKline, Grifols Deutschland GmbH, MSD Sharp & Dohme GmbH, Mundipharma GmbH, Novartis Deutschland GmbH, Pfizer Pharma GmbH, Takeda Pharma Vertrieb GmbH & Co. KG, Teva GmbH for patient investigations and laboratory measurements. The funding body had no involvement in the design of the study, or the collection, analysis or interpretation of the data. David Young received funding from BMBF for medical writing services. We thank the reviewers of the manuscript for their profound suggestions.
Availability of data and materials
Data and materials have not been made public since this is an ongoing observational study. Requests to the central study office will be processed by the study steering committee.
Authors’contributions
of the data from this analysis, to the development and critical revision of the manuscript, approved the final submitted version, and agreed to be accountable for all aspects of the work. RAJ was involved in the design and set-up of COSYCONET as well as in the present study, as well as quality con-trol, statistical analysis and conceptualizing and drafting of the manuscript, approved the final submitted version, and agreed to be accountable for all aspects of the work.
Ethics approval and consent to participate
The study was approved by the Ethics Committee of the University of Marburg as coordinating center and by the Ethics Committees of all study centers; it is registered onClinicalTrials.gov(registration number NCT01245933).
Consent for publication
Not applicable.
Competing interests
The authors declare that they have no competing interests.
Publisher’s Note
Springer Nature remains neutral with regard to jurisdictional claims in published maps and institutional affiliations.
Author details
1Department of Medicine, Pulmonary and Critical Care Medicine, Philipps
University of Marburg (UMR), Member of the German Center for Lung Research (DZL), Baldingerstrasse 1, 35033 Marburg, Germany.2Pulmonary Research Institute at LungenClinic Grosshansdorf, Airway Research Center North (ARCN), Member of the German Center for Lung Research (DZL), Grosshansdorf, Germany.3Department of Internal Medicine V, Ludwig
Maximilians University (LMU), Comprehensive Pneumology Center Munich (CPC-M), Member of the German Center for Lung Research (DZL), Munich, Germany.4Department of Internal Medicine, LungenClinic Grosshansdorf and
Christian-Albrechts University, Kiel, Airway Research Center North (ARCN), Member of the German Center for Lung Research (DZL), Grosshansdorf, Germany.5Institute for Biostatistics, Center for Biometry, Medical Informatics
and Medical Technology, Hannover Medical School, Hannover, Germany.
6Internal Medicine, Dachau, Germany.7Institute and Outpatient Clinic for
Occupational, Social and Environmental Medicine, Ludwig Maximilians University (LMU), Comprehensive Pneumology Center Munich (CPC-M), Member of the German Center for Lung Research (DZL), Ziemssenstrasse 1, 80336 Munich, Germany.8Department of Internal Medicine V - Pulmonology,
Allergology, Intensive Care Medicine, Saarland University Hospital, Homburg, Germany.
Received: 5 November 2018 Accepted: 12 March 2019
References
1. Miller J, Edwards LD, Agusti A, Bakke P, Calverley PM, Celli B, Coxson HO, Crim C, Lomas DA, Miller BE, et al. Comorbidity, systemic inflammation and outcomes in the ECLIPSE cohort. Respir Med. 2013;107:1376–84. 2. Mullerova H, Agusti A, Erqou S, Mapel DW. Cardiovascular comorbidity in
COPD: systematic literature review. Chest. 2013;144:1163–78.
3. Song S, Yang PS, Kim TH, Uhm JS, Pak HN, Lee MH, Joung B. Relation of chronic obstructive pulmonary disease to cardiovascular disease in the general population. Am J Cardiol. 2017;120:1399–404.
4. Barr RG, Bluemke DA, Ahmed FS, Carr JJ, Enright PL, Hoffman EA, Jiang R, Kawut SM, Kronmal RA, Lima JA, et al. Percent emphysema, airflow obstruction, and impaired left ventricular filling. N Engl J Med. 2010;362: 217–27.
5. Watz H, Waschki B, Meyer T, Kretschmar G, Kirsten A, Claussen M, Magnussen H. Decreasing cardiac chamber sizes and associated heart dysfunction in COPD: role of hyperinflation. Chest. 2010;138:32–8. 6. Smith BM, Prince MR, Hoffman EA, Bluemke DA, Liu CY, Rabinowitz D,
Hueper K, Parikh MA, Gomes AS, Michos ED, et al. Impaired left ventricular filling in COPD and emphysema: is it the heart or the lungs? The multi-ethnic study of atherosclerosis COPD study. Chest. 2013;144:1143–51. 7. Chou R, High Value Care Task Force of the American College of P. Cardiac
screening with electrocardiography, stress echocardiography, or myocardial
perfusion imaging: advice for high-value care from the American College of Physicians. Ann Intern Med. 2015;162:438–47.
8. Thomas AJ, Apiyasawat S, Spodick DH. Electrocardiographic detection of emphysema. Am J Cardiol. 2011;107:1090–2.
9. Chhabra L, Sareen P, Perli D, Srinivasan I, Spodick DH. Vertical P-wave axis: the electrocardiographic synonym for pulmonary emphysema and its severity. Indian Heart J. 2012;64:40–2.
10. Christos GA. P-wave indices in emphysema. What do we actually know? Int J Cardiol. 2016;202:80.
11. Chhabra L, Sareen P, Gandagule A, Spodick D. Computerized tomographic quantification of chronic obstructive pulmonary disease as the principal determinant of frontal P vector. Am J Cardiol. 2012;109:1046–9.
12. Jensen MT, Marott JL, Lange P, Vestbo J, Schnohr P, Nielsen OW, Jensen JS, Jensen GB. Resting heart rate is a predictor of mortality in COPD. Eur Respir J. 2013;42:341–9.
13. Karch A, Vogelmeier C, Welte T, Bals R, Kauczor HU, Biederer J, Heinrich J, Schulz H, Glaser S, Holle R, et al. The German COPD cohort COSYCONET: aims, methods and descriptive analysis of the study population at baseline. Respir Med. 2016;114:27–37.
14. Kahnert K, Lucke T, Huber RM, Behr J, Biertz F, Vogt A, Watz H, Alter P, Fahndrich S, Bals R, et al. Relationship of hyperlipidemia to comorbidities and lung function in COPD: results of the COSYCONET cohort. PLoS One. 2017;12:e0177501.
15. Kahnert K, Alter P, Young D, Lucke T, Heinrich J, Huber RM, Behr J, Wacker M, Biertz F, Watz H, et al. The revised GOLD 2017 COPD categorization in relation to comorbidities. Respir Med. 2018;134:79–85.
16. Alter P, Jorres RA, Watz H, Welte T, Glaser S, Schulz H, Bals R, Karch A, Wouters EFM, Vestbo J, et al. Left ventricular volume and wall stress are linked to lung function impairment in COPD. Int J Cardiol. 2018;261:172–8. 17. Alter P, Watz H, Kahnert K, Pfeifer M, Randerath WJ, Andreas S, Waschki B,
Kleibrink BE, Welte T, Bals R, et al. Airway obstruction and lung hyperinflation in COPD are linked to an impaired left ventricular diastolic filling. Respir Med. 2018;137:14–22.
18. Vogelmeier CF, Criner GJ, Martinez FJ, Anzueto A, Barnes PJ, Bourbeau J, Celli BR, Chen R, Decramer M, Fabbri LM, et al. Global strategy for the diagnosis, management, and prevention of chronic obstructive lung disease 2017 report: GOLD executive summary. Eur Respir J. 2017;49.
19. Celli BR, Decramer M, Wedzicha JA, Wilson KC, Agusti A, Criner GJ, MacNee W, Make BJ, Rennard SI, Stockley RA, et al. An official American Thoracic Society/European Respiratory Society statement: research questions in chronic obstructive pulmonary disease. Am J Respir Crit Care Med. 2015;191:e4–e27.
20. Vogelmeier C, Buhl R, Criee CP, Gillissen A, Kardos P, Kohler D, Magnussen H, Morr H, Nowak D, Pfeiffer-Kascha D, et al. Guidelines for the diagnosis and therapy of COPD issued by deutsche Atemwegsliga and deutsche Gesellschaft fur Pneumologie und Beatmungsmedizin. Pneumologie. 2007; 61:e1–40.
21. Criee CP, Sorichter S, Smith HJ, Kardos P, Merget R, Heise D, Berdel D, Kohler D, Magnussen H, Marek W, et al. Body plethysmography--its principles and clinical use. Respir Med. 2011;105:959–71.
22. Criee CP, Baur X, Berdel D, Bosch D, Gappa M, Haidl P, Husemann K, Jorres RA, Kabitz HJ, Kardos P, et al. Standardization of spirometry: 2015 update. Published by German Atemwegsliga, German respiratory society and German Society of Occupational and Environmental Medicine. Pneumologie. 2015;69:147–64.
23. Vogelmeier C, Buhl R, Burghuber O, Criee CP, Ewig S, Godnic-Cvar J, Hartl S, Herth F, Kardos P, Kenn K, et al. Guideline for the diagnosis and treatment of COPD patients - issued by the German respiratory society and the German Atemwegsliga in cooperation with the Austrian Society of Pneumology. Pneumologie. 2018;72:253–308.
24. Nagueh SF, Smiseth OA, Appleton CP, Byrd BF 3rd, Dokainish H, Edvardsen T, Flachskampf FA, Gillebert TC, Klein AL, Lancellotti P, et al.
Recommendations for the evaluation of left ventricular diastolic function by echocardiography: an update from the American Society of
Echocardiography and the European Association of Cardiovascular Imaging. J Am Soc Echocardiogr. 2016;29:277–314.
26. Quanjer PH, Stanojevic S, Cole TJ, Baur X, Hall GL, Culver BH, Enright PL, Hankinson JL, Ip MS, Zheng J, et al. Multi-ethnic reference values for spirometry for the 3-95-yr age range: the global lung function 2012 equations. Eur Respir J. 2012;40:1324–43.
27. Alter P, Rabe KF, Schulz H, Vogelmeier CF, Jorres RA. Influence of body mass on predicted values of static hyperinflation in COPD. Int J Chron Obstruct Pulmon Dis. 2018;13:2551–5.
28. Hoyle RH. Handbook of structural equation modeling; 2014. 29. Kahnert K, Alter P, Welte T, Huber RM, Behr J, Biertz F, Watz H, Bals R,
Vogelmeier CF, Jorres RA. Uric acid, lung function, physical capacity and exacerbation frequency in patients with COPD: a multi-dimensional approach. Respir Res. 2018;19:110.
30. Chen W, Thomas J, Sadatsafavi M, FitzGerald JM. Risk of cardiovascular comorbidity in patients with chronic obstructive pulmonary disease: a systematic review and meta-analysis. Lancet Respir Med. 2015;3:631–9. 31. Stark-Leyva KN, Beck KC, Johnson BD. Influence of expiratory loading and