GUIDELINES ON
DIFFERENTIAL LEVY SYSTEMS FRAMEWORK FOR
INSURANCE COMPANIES
i
TABLE OF CONTENTS
PART 1: INTRODUCTION ... 1 BACKGROUND ... 1 PART 2: SCOPE OF APPLICATION ... 3PART 3: DIFFERENTIAL LEVY SYSTEMS FRAMEWORK ... 4
OVERVIEW ... 4
QUANTITATIVECRITERIA ... ……….………... 4
QUALITATIVE CRITERIA ... 6
PART 4: QUANTITATIVE CRITERIA ………..…..………... 7
CAPITAL MEASURE ... 7
OPERATIONAL AND SUSTAINABILITY MEASURE - GENERAL INSURANCE BUSINESS ..………..…….…7
OPERATIONAL AND SUSTAINABILITY MEASURE - LIFE INSURANCE BUSINESS ... 8
PART 5: QUALITATIVE CRITERIA ………..……… 10
SUPERVISORY RATING ... 10
OTHER INFORMATION ... 10
PART 6: LEVY CATEGORY AND LEVY RATE …..………….………..………. 12
LEVY CATEGORY ... 12
LEVY RATE ... 12
PART 7: REPORTING, SUBMISSION AND APPEAL ... 13
REPORTING REFERENCE DATE ... 13
SUBMISSION DATE ... 13
INFORMATION INTEGRITY ... 14
COMPUTATION AND NOTIFICATION OF SCORE... 14
INSUFFICIENT QUANTITATIVE INFORMATION ……….……….……… 15
FILING RESUBMISSION ... 15
PROHIBITION AGAINST PUBLIC DISCLOSURE ... 15
APPEAL PROCESS... 16
PART 8: REPORTING MANUAL AND FORMS ... 17
ii
PART 9: NEW INSURANCE COMPANY AND AMALGAMATED INSURER MEMBER ….…….……… 18
NEW INSURANCE COMPANY………. ... 18
AMALGAMATED INSURER MEMBER……….……… 18
LIST OF TABLES TABLE 1: SCOPE OF APPLICATION ... 3
TABLE 2: SUMMARY OF OPERATIONAL AND SUSTAINABILITY MEASURE ………..…………5
TABLE 3: QUANTITATIVE CRITERIA MATRIX ... 5
TABLE 4: QUANTITATIVE CRITERIA SCORE ... 6
TABLE 5: SCORE RANGE FOR SUPERVISORY RATING ... 10
TABLE 6: SCORE RANGE FOR OTHER INFORMATION ... 11
TABLE 7: OVERALL DLS SCORE RANGE AND LEVY CATEGORIES ... 12
LIST OF APPENDICES APPENDIX 1: CAPITALMEASURE:FREECAPITALINDEX ... 21
APPENDIX 2: OPERATIONAL AND SUSTAINABILITY MEASURE FOR GENERAL INSURANCE BUSINESS: GROSS PREMIUM GROWTH RATE ... 22
APPENDIX 3: OPERATIONAL AND SUSTAINABILITY MEASURE FOR GENERAL INSURANCE BUSINESS: BUSINESS DIVERSIFICATION RATIO ... 23
APPENDIX 4: OPERATIONAL AND SUSTAINABILITY MEASURE FOR GENERAL INSURANCE BUSINESS: RECEIVABLE RATIO ... 24
APPENDIX 5: OPERATIONAL AND SUSTAINABILITY MEASURE FOR GENERAL INSURANCE BUSINESS: COMBINED RATIO ... 25
APPENDIX 6: OPERATIONAL AND SUSTAINABILITY MEASURE FOR GENERAL INSURANCE BUSINESS: MEAN-ADJUSTED RETURN VOLATILITY ... 26
APPENDIX 7: OPERATIONAL AND SUSTAINABILITY MEASURE FOR LIFE INSURANCE BUSINESS: NEW BUSINESS GROWTH RATE ... 28
APPENDIX 8: OPERATIONAL AND SUSTAINABILITY MEASURE FOR LIFE INSURANCE BUSINESS: BUSINESS CONCENTRATION RATIO ... 29
APPENDIX 9: OPERATIONALANDSUSTAINABILITYMEASUREFORLIFEINSURANCEBUSINESS: BUSINESS CONSERVATION RATIO ... 30
APPENDIX 10: OPERATIONAL AND SUSTAINABILITY MEASURE FOR LIFE INSURANCE BUSINESS: INVESTMENT YIELD ... 31
APPENDIX 11: OPERATIONAL AND SUSTAINABILITY MEASURE FOR LIFE INSURANCE BUSINESS: EXPENSE RATIO ... 33
iii LIST OF ILLUSTRATIONS
ILLUSTRATION 1: COMPUTATION OF FREE CAPITAL INDEX... 35
ILLUSTRATION 2: COMPUTATION OF GROSS PREMIUM GROWTH RATE ... 36
ILLUSTRATION 3: COMPUTATION OF BUSINESS DIVERSIFICATION RATIO ... 37
ILLUSTRATION 4: COMPUTATION OF RECEIVABLE RATIO ... 38
ILLUSTRATION 5: COMPUTATION OF COMBINED RATIO ... 39
ILLUSTRATION 6: COMPUTATION OF MEAN-ADJUSTED RETURN VOLATILITY ... 40
ILLUSTRATION 7: COMPUTATION OF NEW BUSINESS GROWTH RATE ... 42
ILLUSTRATION 8: COMPUTATION OF BUSINESS CONCENTRATION RATIO ... 44
ILLUSTRATION 9: COMPUTATION OF BUSINESS CONSERVATION RATIO... 45
ILLUSTRATION 10: COMPUTATION OF INVESTMENT YIELD ... 46
ILLUSTRATION 11: COMPUTATION OF EXPENSE RATIO ... 48
ILLUSTRATION 12: DLS SCORING AND LEVY CATEGORISATION FOR A LIFE INSURANCE COMPANY ... 49
ILLUSTRATION 13: DLS SCORING AND LEVY CATEGORISATION FOR A COMPOSITE INSURANCE COMPANY ... 50
ILLUSTRATION 14: DLS SCORING AND LEVY CATEGORISATION FOR AN INSURANCE COMPANY WITH INSUFFICIENT QUANTITATIVE INFORMATION. ... 52
LIST OF DIAGRAM DIAGRAM1: THEDLSFRAMEWORK……….………..4
Page 1 PART 1: INTRODUCTION
BACKGROUND
1.1 Perbadanan Insurans Deposit Malaysia (“PIDM”) implemented the Differential Levy Systems (“DLS”) framework for insurance companies since 2013 to replace the flat-rate system.
1.2 The objectives of implementing the DLS framework are as follows:
(a) to differentiate insurance companies according to their risk profiles;
(b) to introduce more fairness into the levy system process where insurance companies assessed to be of higher risk will pay higher levies as opposed to insurance companies assessed to be of lower risk;
(c) to provide incentives for insurance companies to adopt sound risk management practices; and
(d) to promote stability of the financial system via the overall improvement in risk management practices of insurance companies.
1.3 As part of the continuous review process, PIDM reviews and enhances the DLS framework from time to time to reflect the changes in the regulatory developments and operating environment.
1.4 The current enhancements to the DLS framework introduces new indicators, and also refinements to the weightages and score range of selected indicators.
1.5 In exercise of the power conferred by paragraph 209(1)(b) of the Malaysia Deposit Insurance Corporation Act 2011 (“PIDM Act”), PIDM makes the Guidelines on the Differential Levy Systems for Insurance Companies (“Guidelines”). These Guidelines set out the assessment approach under the DLS framework, including the formula, threshold and score range of each of the indicators under the quantitative criteria and qualitative criteria. The requirements for reporting and submission of quantitative information by insurance companies to PIDM are also elaborated in the Guidelines.
Page 2 1.6 These Guidelines will be effective beginning assessment year 2016 and shall supersede
the Guidelines on the Differential Levy System for Takaful and Insurance Benefits Protection System issued on 31 January 2013.
1.7 For purposes of these Guidelines, “Guidelines for Insurance Companies Statistical Submission” or “Guidelines for ICSS” means the Guidance Notes for Insurance Companies Statistical System on Submission of Monthly/Quarterly/Annual Statistical Returns as may be issued by Bank Negara Malaysia (“BNM”).
1.8 A reference to a statute or other law includes regulations and other instruments under it and consolidations, amendments, re-enactments or replacements of any of them. Enquiries relating to these Guidelines may be directed to:
General Manager
Insurance, Risk Assessment and Monitoring Division Perbadanan Insurans Deposit Malaysia
Level 12, Axiata Tower No. 9, Jalan Stesen Sentral 5 Kuala Lumpur Sentral 50470 Kuala Lumpur Malaysia.
General Lines: 03-2173 7436 / 03-2265 6565
Fax: 03-21737494
Page 3 PART 2: SCOPE OF APPLICATION
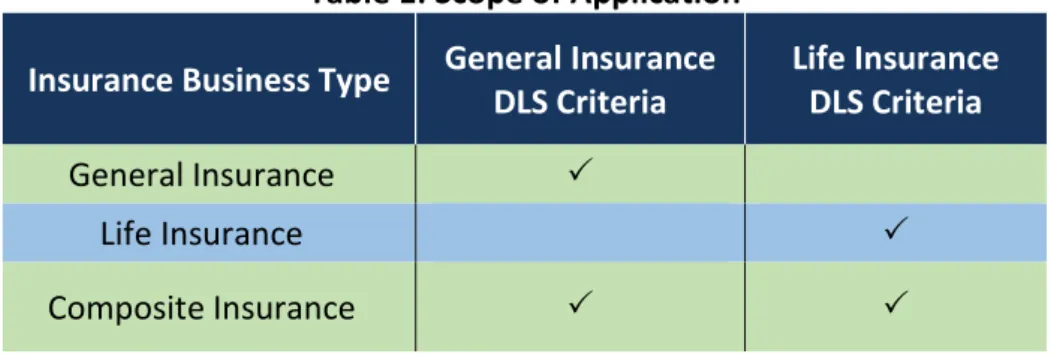
2.1 The DLS Framework is applicable to all insurance companies that are licensed to carry on insurance business under Section 10 of the Financial Services Act 2013, except for insurers licensed to carry on solely reinsurance business and Danajamin Nasional Berhad. Table 1 depicts the application of the DLS Framework in respect of an insurance company’s business or businesses.
Table 1: Scope of Application
Insurance Business Type General Insurance DLS Criteria Life Insurance DLS Criteria General Insurance Life Insurance Composite Insurance
Page 4 PART 3: DIFFERENTIAL LEVY SYSTEMS FRAMEWORK
OVERVIEW
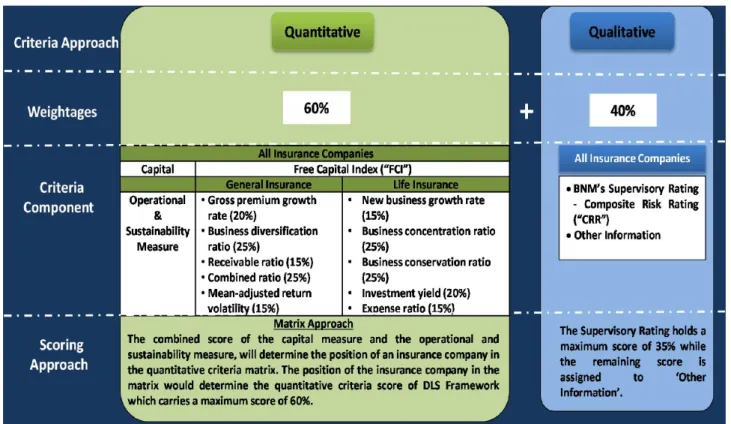
3.1 An insurance company shall be assessed and classified into different categories in an assessment year based on a combined quantitative and qualitative criteria approach. 3.2 In order to achieve higher objectivity and transparency, a heavier weightage is assigned to the quantitative criteria which carries a score of 60%, while the qualitative criteria carries the remaining score of 40% out of a total score of 100%.
3.3 The DLS Framework is summarised in Diagram 1.
Diagram 1: The DLS Framework
QUANTITATIVE CRITERIA
3.4 The assessment of the quantitative criteria will be based on a ‘matrix approach’, which enables the risk profile of the insurance companies to be better differentiated based on two independent components of assessment.
Page 5 3.5 The horizontal axis of the matrix approach measures the capital strength, i.e. Free
Capital Index. Capital strength is important as it provides a cushion against any unexpected adverse events in the insurance companies’ earnings and assets quality. 3.6 On the other side, the vertical axis of the matrix approach reflects the operational and
sustainability measure, which aims to assess the efficiency of the insurance companies’ operational management and sustainability of the financial performance. This measure is made up of different sets of indicators which are assigned specific weightages. The indicators and their respective weightages for both general and life insurance businesses are set out in Table 2 below.
Table 2: Summary of Operational and Sustainability Measure
General Insurance Business Life Insurance Business Indicators Weightage Indicators Weightage
Gross premium
growth rate 20%
New business growth
rate 15%
Business
diversification ratio 25%
Business
concentration ratio 25% Receivable ratio 15% Business conservation
ratio 25%
Combined ratio 25% Investment yield 20%
Mean-adjusted return
volatility 15% Expense ratio 15%
Total 100% Total 100%
3.7 The combined score of the capital measure and the operational and sustainability measure, will determine the position of an insurance company in the quantitative criteria matrix, as represented by the symbols M1 to M7 as set out in Table 3 below.
Table 3: Quantitative Criteria Matrix
Operational and Sustainability Measure Capital Measure < 1.00 1.00 ≤ but ≤1.10 1.10< but ≤1.20 >1.20 ≥ 85 M6 M4 M2 M1 ≥ 65 but < 85 M6 M4 M3 M2 ≥ 50 but < 65 M7 M5 M4 M3 < 50 M7 M7 M5 M4
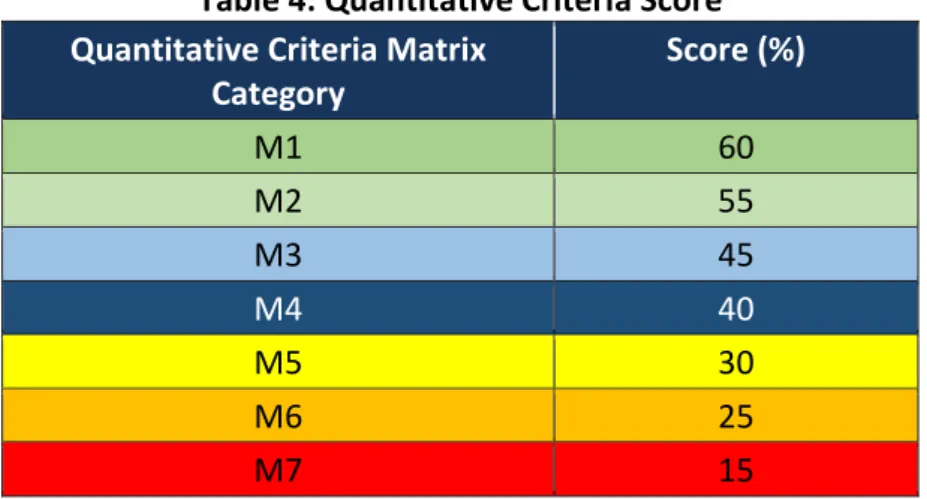
Page 6 3.8 Each of the seven (7) categories within the matrix is then assigned a quantitative score
as set out in Table 4 below. The score reflects the overall quantitative performance of the insurance company.
Table 4: Quantitative Criteria Score
Quantitative Criteria Matrix Category Score (%) M1 60 M2 55 M3 45 M4 40 M5 30 M6 25 M7 15
3.9 For composite insurance companies, the scoring of the operational and sustainability measure shall be proportioned according to the percentage of the net premiums1 from the general and life insurance businesses of the insurance companies.
QUALITATIVE CRITERIA
3.10 The qualitative criteria include both the supervisory rating of insurance companies assigned by BNM, and any other information that will have implication on the safety and soundness of the insurance companies. The ‘Supervisory Rating’ carries a maximum score of 35%, while the remaining score of 5% is assigned to ‘Other Information’.
Page 7 PART 4: QUANTITATIVE CRITERIA
4.1 Capital Measure Free Capital Index
FCI is a measure of the capital buffer above the individual target capital level (“ITCL”). This index reflects the insurance company’s capital sufficiency and its resilience to adverse situations.
4.2 Operational and Sustainability Measure – General Insurance Business (a) Gross Premium Growth Rate
The gross premium growth rate measures the insurance company’s total business growth. The growth in premiums provides a constant stream of income to support the insurance company’s business operations and enhances its market share.
(b) Business Diversification Ratio
The business diversification ratio measures the extent of the insurance company’s portfolio diversification. A well-diversified portfolio helps the insurance company to avoid being significantly affected by any adverse experience in its line of business.
(c) Receivable Ratio
The receivable ratio measures the extent of insurance receivables against the total premiums income. This ratio indicates the operational efficiency of the insurance company based on its ability to manage its receivables collection i.e. collect its outstanding premiums, agents balances and reinsurance balances. (d) Combined Ratio
The combined ratio measures the performance and profitability of the insurance company’s core business activities. An insurance company needs to
Page 8 ensure that the flow of insurance premiums exceeds the outgo including expenses, as this is an indication of a profitable insurance business.
(e) Mean-Adjusted Return Volatility
Mean-adjusted return volatility (“MARV”) measures the downside risk of profitability. It gauges the downside volatility of the profits over a 3-year period and hence provides an indication on the profits’ sustainability. Volatile earnings trend will render the insurance company’s capital position more vulnerable in the event of losses, as capital may be eroded if the earnings are inadequate to absorb the losses.
4.3 Operational and Sustainability Measure - Life Insurance Business (a) New Business Growth Rate
The new business growth rate measures the total growth of an insurance company’s new business. The consistent growth of new business premiums will ensure a constant stream of income to support the insurance company’s business operations and enhances its market share.
(b) Business Concentration Ratio
The business concentration ratio measures the proportion of regular premiums policy business to single premiums policy business. An appropriate composition of single and regular premiums products ensures continuous future stream of income.
(c) Business Conservation Ratio
The business conservation ratio measures the proportion of policies that remain force at the end of a period out of the total policies that were in-force at the beginning of the period. This indicator assesses the business retention ability of the insurance company and reflects the sustainability level of its business.
(d) Investment Yield
Investment yield measures the investment performance in terms of the insurance company’s investment income in proportion to the assets held by
Page 9 the insurance company. The inability to generate sufficient returns may affect the insurance company’s long-term sustainability including meeting its policy owners’ reasonable expectations.
(e) Expense Ratio
The expense ratio measures the expenses incurred to produce every Ringgit of premiums income. It indicates how efficient the insurance company is in managing its operating costs to generate premiums income, by benchmarking its management expenses and agency remuneration against the premiums income generated.
4.4 For the detailed requirements of all the above ratios, please refer to the attached Appendices. As for the computations of the ratios, please refer to the attached Illustrations.
Page 10 PART 5: QUALITATIVE CRITERIA
5.0 For the qualitative criteria, each insurance company shall be assessed based on BNM’s supervisory rating and other information i.e. other qualitative factors.
(a) Supervisory Rating
The supervisory rating, namely the CRR as assessed by BNM for the assessment period up to 31 December of the preceding assessment year will be used. The insurance company shall be assigned scores as set out in Table 5 below.
Table 5: Score Range for Supervisory Rating
Supervisory Rating
Range of Results Score (%)
Supervisory Rating of LOW or equivalent 35
Supervisory Rating of MODERATE or equivalent 22 Supervisory Rating of ABOVE AVERAGE or equivalent 10 Supervisory Rating of HIGH or equivalent 0 (b) Other Information
The score shall be determined by PIDM based on information relating to the insurance company’s safety and soundness, its viability or its financial condition.
This information may include information about the insurance company other than that specified in the supervisory rating of the insurance company, which takes into account the following factors:
(i) the insurance company’s failure to comply with any subsidiary legislation made by PIDM including guidelines or with any regulatory requirements that apply to the insurance company;
(ii) any action taken by any regulatory or other authority against the insurance company or any corporation related to the insurance company including but not limited to any notice, order or instruction relating to any deficiency or non-compliance in respect of the insurance
Page 11 company or such corporation, a letter of warning, or any requirement or instruction for issuance of a letter of undertaking or commitment or a resolution of the board of directors;
(iii) any correction or action plan of the insurance company or such corporation to address the action taken by such authority under subparagraph (ii) including but not limited to the progress report on the implementation by the insurance company of the terms of the letter of undertaking or commitment or the resolution of the board of directors; (iv) any rating or assessment of the insurance company by any rating agency whether relating to the credit standing of the insurance company or its financial condition or otherwise;
(v) whether the insurance company has received or is receiving any form of assistance from BNM or PIDM, such assistance being financial or otherwise; and
(vi) any other information provided to PIDM or that comes to the attention of PIDM about the insurance company or any corporation related to the insurance company.
The scores for the other information criteria shall be determined as set out in Table 6 below.
Table 6: Score Range for Other Information
Other Information
Assessment Criteria Score (%)
As at 30 April of the assessment year, no information has come to PIDM’s attention about any circumstances that represent a threat to or materially affect the safety, soundness, financial condition or viability of the insurance company.
5 As at 30 April of the assessment year, information has come to
PIDM’s attention about circumstances that represent a threat to or may materially affect the safety, soundness, financial condition or viability of the insurance company.
3 As at 30 April of the assessment year, information has come to
PIDM’s attention about circumstances that materially affect the safety, soundness, financial condition or viability of the insurance company.
Page 12 PART 6: LEVY CATEGORY AND LEVY RATE
LEVY CATEGORY
6.1 The summation of the respective scores from the quantitative and qualitative criteria will determine the insurance company’s overall DLS score. All insurance companies shall be classified into one (1) of the four (4) levy categories based on their overall DLS score. The table below sets out the overall DLS score range and the respective levy categories:
Table 7: Overall DLS Score Range and Levy Categories
Overall DLS Score Levy Category
DLS Score ≥ 85% 1
65% ≤ DLS Score < 85% 2 50% ≤ DLS Score < 65% 3
DLS Score < 50% 4
LEVY RATE
6.2 Each levy category carries a prescribed levy rate and the minimum levy amount for the purpose of determining the amount of levy payable by an insurance company to PIDM for the assessment year.
6.3 An insurance company shall pay its annual levy by 31 May (or earlier if 31 May falls on a weekend or a public holiday in Kuala Lumpur) of each assessment year based on the DLS score and levy category notified by PIDM.
6.4 An insurance company shall complete the return on calculation of levy based on the Guidelines on Takaful and Insurance Benefits Protection System: Submission of Returns on Calculation of Levies for Takaful and Insurance Businesses issued on 14 March 2016.2
2 Which supersedes the “Guidelines on Takaful and Insurance Benefits Protection System: Submission of Returns on Calculation of Premiums for Takaful and Insurance Businesses” issued on 9 March 2015.
Page 13 PART 7: REPORTING, SUBMISSION AND APPEAL
REPORTING REFERENCE DATE QUANTITATIVE CRITERIA
7.1 The quantitative criteria shall be calculated based on an insurance company’s relevant financial statements as at 31 December of each preceding assessment year. In this respect, the financial statements shall be referred to as the following:
(a) For an insurance company with 31 December financial year end: audited financial statements (i.e. Insurance Companies Statistical System (“ICSS”), Risk-Based Capital (“RBC”) reporting forms, and other supporting sources of information for the financial period); or
(b) For an insurance company with non-31 December financial year end: approved financial statements (i.e. ICSS, RBC reporting forms, and other supporting sources of information for the financial period, which have been approved by the Management of the insurance company).
QUALITATIVE CRITERIA
7.2 For the supervisory rating criteria, the supervisory rating for each insurance company as at 31 December of the preceding assessment year shall be applied to determine the scores for levy calculation purposes for an assessment year. BNM will provide the supervisory ratings to PIDM.
7.3 For the other information criteria, an insurance company shall be assessed based on information received by PIDM on or before 30 April of the assessment year.
SUBMISSION DATE
7.4 An insurance company must submit the certified quantitative information (hard copy and soft copy in pre-formatted excel spreadsheet) to PIDM latest by 30 April (or earlier if 30 April falls on a weekend or a public holiday in Kuala Lumpur) of each assessment year for the purposes of levy computation.
7.5 An insurance company’s Chief Executive Officer (“CEO”), and its Chief Financial Officer (“CFO”) or Head of Finance or Appointed Actuary, must certify that the quantitative information is accurate and reflective of the financial condition of the insurance
Page 14 company as at 31 December of the preceding assessment year. An insurance company’s submission of certified quantitative information shall be made by hand to PIDM’s office.
7.6 For an insurance company that fails to comply with the requirements in paragraphs 7.4 and 7.5, PIDM will assign a score to the insurance company according to any available information, and a levy surcharge may be imposed on such insurance company pursuant to Section 75 of the PIDM Act.
INFORMATION INTEGRITY
7.7 An insurance company shall be accountable to ensure the accuracy of the information submitted for DLS. For an insurance company that does not comply with the requirements with regard to information integrity, a levy surcharge may be imposed on such insurance company pursuant to Section 75 of the PIDM Act.
7.8 In respect of the accuracy of the DLS quantitative information and the Returns on Calculation of Levies (“RCL”) submitted to PIDM, an insurance company’s internal auditor and external auditor will perform an independent validation under the Guidelines on Validation Programmes: Differential Levy Systems and Levies Calculation issued on 14 March 20163.
COMPUTATION AND NOTIFICATION OF SCORE
7.9 The overall DLS score shall be the sum of scores assigned for the quantitative and the qualitative criteria.
7.10 The score of each criterion is prescribed in the Malaysia Deposit Insurance Corporation (Differential Premium Systems in Respect of Insurer Members) Regulations 20124.
7.11 PIDM will compute the overall DLS score for each insurance company and notify the insurance companies of their respective score, levy category and applicable levy rate by 15 May of each assessment year. This will provide sufficient time for an insurance company to make the necessary arrangement for the payment of levy that is due to PIDM by 31 May (or earlier if 31 May falls on a weekend or a public holiday in Kuala
3 Which supersedes the “Guidelines on Validation Programme: Differential Levy Systems and Premiums
Calculation” issued on 6 January 2014.
4 As amended by the Malaysia Deposit Insurance Corporation (Differential Premium Systems in respect of
Page 15 Lumpur) of each assessment year. Please refer to Illustrations 12 and 13 for examples of DLS scoring and levy categorisation.
INSUFFICIENT QUANTITATIVE INFORMATION
7.12 For an insurance company with insufficient information for the purposes of calculating the scores of certain criteria, the scores for such criteria shall be determined on a proportionate basis as stated below:
[A ÷ (100 – B)] × B where
A is the sum of the scores assigned to an insurance company for each quantitative criterion where quantitative information is available.
B is the sum of maximum scores for criteria where information is not available for computation.
The computation of the overall DLS scores for an insurance company with insufficient quantitative information is provided in Illustration 14.
FILING RESUBMISSION
7.13 In circumstances where an insurance company submits its amended quantitative information to PIDM after the submission deadline i.e. 30 April of the assessment year, the amended submission shall reach PIDM by 10 May (or earlier if 10 May falls on a weekend or a public holiday in Kuala Lumpur)of that assessment year.
7.14 An insurance company shall be rated based on the latest information received by PIDM on or before10 May of that assessment year.
7.15 An insurance company that submits any amended information shall be expected to comply with the provisions for information integrity as specified under paragraph 7.7 (Information Integrity).
PROHIBITION AGAINST PUBLIC DISCLOSURE
7.16 An insurance company acknowledges that the following information (“Information”) is confidential:
(a) An insurance company’s score for any ratio or criteria of the DLS; (b) An insurance company’s total criteria score;
Page 16 (d) Levy rate that is or was applicable to an insurance company; and
(e) The amount of levy payable or paid by an insurance company.
7.17 No director, officer, employee or agent of an insurance company or any person who for any reason has by any means access to any of the Information or any document which discloses or contains any of the Information, shall provide or disclose to any other person or publish any such Information or document unless the disclosure is permitted under any law or court order or for the purpose of an insurance company performing its duties or carrying out the provisions of any law or any regulation, guideline or instruction made by BNM or PIDM.
7.18 A levy surcharge may be imposed on an insurance company that does not comply with the prohibition against public disclosure.
APPEAL PROCESS
7.19 An appeal process is put in place to provide an avenue for any insurance company to request for a review of its final scores in certain circumstances.
7.20 An insurance company may appeal against its score after 31 May of an assessment year and is required to formally submit its appeal in writing to PIDM within the time specified in paragraph 7.22. The reason(s) or ground(s) for the appeal, as set out in paragraph 7.21, must be included.
7.21 The appeal must be on the basis of an error in the quantitative information provided by an insurance company or an error in PIDM’s computation in relation to the quantitative criteria or the qualitative criteria (except BNM’s supervisory rating and ITCL agreed by BNM). There shall not be any appeal against BNM’s supervisory rating and ITCL agreed by BNM as BNM would have provided an appropriate review process prior to assigning a company’s final supervisory rating and agreeing to its ITCL. 7.22 Any request for appeal shall be submitted in writing to PIDM no later than 31 August
of that assessment year. PIDM will review and respond to the appeal by 30 September of that assessment year. Notwithstanding the appeal, an insurer member must pay the annual levy on or before 31 May of that assessment year.
7.23 If the appeal results in PIDM determining that an insurance company has overpaid its annual levy for that assessment year, PIDM shall refund the difference to the insurance company after the appeal process is concluded. Conversely, if it is determined that an insurance company has underpaid its annual levy for that assessment year, the insurance company shall pay the difference to PIDM.
Page 17 PART 8: REPORTING MANUAL AND FORMS
GENERAL REQUIREMENT
8.1 Any restatement made to an insurance company’s previous year’s financial information shall be reflected in the submission of quantitative information to PIDM. However, the insurance company’s previous year DLS score will not be amended. 8.2 An insurance company shall distinguish its quantitative information between general
insurance and life insurance businesses.
8.3 All amounts shall be reported in thousands (‘000).
8.4 All percentages shall be expressed to two (2) decimal points.
8.5 An insurance company must use the pre-formatted excel spreadsheet provided in the PIDM website for submission to PIDM. An insurance company must also ensure that no alteration or amendment is made to the pre-formatted excel spreadsheet. An insurance company shall only be required to fill-in the marked cells.
Page 18 PART 9: NEW INSURANCE COMPANY AND AMALGAMATED INSURER MEMBER
NEW INSURANCE COMPANY
9.1 An insurance company shall be automatically categorised in the best levy category for the assessment year in which it becomes an insurer member (“first assessment year”), and the assessment year immediately after the first assessment year (“second assessment year”).
9.2 An insurance company is not required to submit the quantitative information to PIDM for the first assessment year and second assessment year. The insurance company is required to submit the quantitative information to PIDM from the third assessment year onwards.
9.3 In the event that an insurance company does not have sufficient information to calculate certain criteria in the third assessment year, the scores of these criteria shall be assigned proportionately according to paragraph 7.12 (Insufficient Quantitative Information).
9.4 For the computation of quantitative criteria for the third assessment year onwards, the quantitative information relating to the position as at 31 December of the first assessment year shall not be included in the computation. The scores of these criteria shall be assigned proportionately according to paragraph 7.12 (Insufficient Quantitative Information).
AMALGAMATED INSURER MEMBER
9.5 An amalgamated insurer member means an insurance company formed from the acquisition of one (1) insurance company by another insurance company or the merger of two (2) or more insurance companies at any time from 1 June of the preceding assessment year to 31 May of an assessment year.
9.6 The following provisions shall apply in determining the quantitative and qualitative scores of the amalgamated insurer member for a particular assessment year:
(a) An amalgamated insurer member is formed on or before 31 December of the preceding assessment year
Page 19 The computation of each indicator of the amalgamated insurer member for the quantitative criteria shall be based on the financial information of the amalgamated insurer member as at 31 December of the preceding assessment year.
The scoring of the amalgamated insurer member for the qualitative criteria shall be based on the supervisory rating and other relevant information of the amalgamated insurer member as at 31 December of the preceding assessment year.
Example 1:
Insurance Companies A and B were involved in the process of merger and acquisition and transferred whole or part of their insurance business to the amalgamated insurer member known as Insurance Company ‘X’. Insurance Company ‘X’ commences operations on 1 September 2015.
For the assessment year 2016, Insurance Company ‘X’ shall submit its quantitative information based on the financial information as at 31 December 2015.
(b) An amalgamated insurer member is formed after 31 December of the preceding assessment year
The computation of each indicator of the amalgamated insurer member for the quantitative criteria shall be based on the financial information of the amalgamating insurer member5 as at 31 December of the preceding assessment year.
The scoring of the amalgamated insurer member for the qualitative criteria shall be based on the supervisory rating and other relevant information of the amalgamating insurer member as at 31 December of the preceding assessment year.
5 An amalgamating insurer member refers to any one of the insurer members involved in an amalgamation or a merger with the highest total scoring for quantitative criteria as of 31 December of the preceding assessment year.
Page 20 Example 2:
Insurance Companies A and B were involved in the process of merger and acquisition. The process of transferring assets and liabilities is completed, resulting in the formation of an amalgamated insurer member, Insurance Company ‘Y’, on 2 January 2016. The table below depicts the scores of the quantitative, supervisory and other information of the insurance companies for position as at 31 December 2015:
Criteria Insurance Companies
A B
Quantitative
Capital – FCI 1.21 1.15
Operational and sustainability score 75% 55%
Total Quantitative Score (a) 55% 40%
Qualitative
Supervisory rating 22% 10%
Other information criteria 5% 0%
Total Qualitative Score (b) 27% 10%
Total DLS Score (a) + (b) 82% 50%
Insurance Company A (the amalgamating insurer member) has the highest quantitative score as at 31 December 2015. Insurance Company ‘Y’ shall submit its quantitative information forms based on the financial information of Insurance Company A for the assessment year 2016. Insurance Company A’s supervisory rating score of 22% and the other information score of 5% will be also applied to Insurance Company ‘Y’ to arrive at the overall DLS score for assessment year 2016.
Perbadanan Insurans Deposit Malaysia 14 March 2016
Page 21 Appendix 1 CAPITAL MEASURE
Free Capital Index
Formula:
Free Capital Index = Capital adequacy ratio (%) Individual target capital level (%) Note:
(i) Capital adequacy ratio (“CAR”) is as determined in the 'Risk-Based Capital (“RBC”) Framework for Insurers' specified by BNM.
(ii) Individual target capital level (“ITCL”) is as determined in the 'Guidelines on Internal Capital Adequacy Assessment Process (“ICAAP”) for Insurers’ by BNM.
(iii) The insurance company’s ITCL shall be based on the latest ITCL agreed by BNM as at 31 December of the preceding assessment year.
(iv) In the case of amalgamated insurer member (please refer to paragraph 9.5), if the ITCL of an insurance company has yet to be determined as at 31 December of the preceding assessment year, the insurance company shall be categorised at the minimum required FCI (score range of 1.00 ≤ FCI ≤1.10) until the ITCL of the insurance company is determined.
Data
Requirement Source of Information Remarks
CAR Form A of the RBC Framework -
Reporting Form.
CAR is based on the average CAR of four (4) quarters within the preceding assessment year.
ITCL As agreed by BNM, specified in
Guidelines on ICAAP for Insurers. -
Score Range:
Free Capital Index Range of Results
Free Capital Index > 1.20 1.10 < Free Capital Index ≤ 1.20 1.00 ≤ Free Capital Index ≤ 1.10 Free Capital Index < 1.00
Page 22 Appendix 2 OPERATIONAL AND SUSTAINABILITY MEASURE
- GENERAL INSURANCE BUSINESS
Gross Premium Growth Rate
Formula:
Gross Premium
Growth Rate =
[Gross premiums (t) – Gross premiums (t-1)]
x 100% Gross premiums (t-1)
3-year weighted average Gross Premium
Growth Rate =
[50% x growth rate (t)] + [30% x growth rate (t-1)] + [20% x growth rate (t-2)]
where,
t = one year immediately preceding the current assessment year; t-1= two years immediately preceding the current assessment year; and t-2 = three years immediately preceding the current assessment year.
Note:
(i) Gross premium growth rate is based on a 3-year weighted average growth rate, i.e. weightages of 50% for one year immediately preceding the current assessment year, 30% for two years immediately preceding the current assessment year and 20% for three years immediately preceding the current assessment year.
(ii) An insurance company which has less than four (4) years of data shall not be assigned a score for this ratio. The score of this ratio shall be determined on a proportionate basis as specified in paragraph 7.12 (Insufficient Quantitative Information).
Data
Requirement Source of Information Remarks
Gross premiums
Statement of Premiums, Form G6 as specified in the Guidelines for ICSS.
Gross premiums includes
premiums from direct business (less return premiums) and all reinsurances accepted.
Score Range:
Gross Premium Growth Rate
Range of Results Score (%)
Gross Premium Growth Rate > 10.00% 20
5.00% < Gross Premium Growth Rate ≤ 10.00% 14
0.00% < Gross Premium Growth Rate ≤ 5.00% 7
Gross Premium Growth Rate ≤ 0.00% 0
Page 23 Appendix 3 OPERATIONAL AND SUSTAINABILITY MEASURE
- GENERAL INSURANCE BUSINESS
Business Diversification Ratio
Formula:
Business Diversification
Ratio
=
Provision of risk margin for adverse deviation (“PRAD”) – Fund provision of risk
margin for adverse deviation (“FPRAD”) x 100% Provision of risk margin for adverse
deviation (“PRAD”) Note:
(i) The PRAD refers to the provision of risk margin for adverse deviation, is the component of the value of the insurance liabilities that relates to the uncertainty inherent in the best estimate, as defined in the RBC Framework.
Data
Requirement Source of Information Remarks
PRAD
RBC Framework - Reporting Form: General insurance fund - Valuation liabilities, Form D and Form D-1.
The PRAD includes valuation of premium liabilities attributable to all classes of businesses, including those attributable to Malaysian Motor Insurance Pool (“MMIP”). FPRAD
RBC Framework - Reporting Form: General insurance fund - Valuation liabilities, Form D and Form D-1.
The FPRAD includes valuation of premium liabilities attributable to all classes of businesses, including those attributable to MMIP.
Score Range:
Business Diversification Ratio
Range of Results Score (%)
Business Diversification Ratio > 30.00% 25
20.00% < Business Diversification Ratio ≤ 30.00% 16
15.00% ≤ Business Diversification Ratio ≤ 20.00% 8
Page 24 Appendix 4 OPERATIONAL AND SUSTAINABILITY MEASURE
- GENERAL INSURANCE BUSINESS
Receivable Ratio Formula: Receivable Ratio = Insurance receivables x 100% Gross premiums Data
Requirement Source of Information Remarks
Gross premiums
Statement of Premiums, Form G6 as specified in the Guidelines for ICSS.
Gross premium includes
premiums from direct business (less return premiums) and all reinsurances accepted.
Insurance receivables
Ageing Schedule, Schedule 12, Form G3 as specified in the Guidelines for
ICSS.
Insurance receivables refers to the
aggregate of total gross
outstanding premiums and
agents’ balances of more than 60 days and total amount due from reinsurers or ceding companies of more than 90 days.
Score Range:
Receivable Ratio
Range of Results Score (%)
Receivable ratio ≤ 10.00% 15
10.00% < Receivable ratio ≤ 15.00% 10
15.00% < Receivable ratio ≤ 20.00% 5
Receivable ratio > 20.00% 0
Page 25 Appendix 5 OPERATIONAL AND SUSTAINABILITY MEASURE
- GENERAL INSURANCE BUSINESS
Combined Ratio
Formula:
Combined Ratio =
Net claims incurred + Management expenses
+ Net commission x 100%
Earned premium income Data
Requirement Source of Information Remarks
Net claims incurred
Statement of Claims, Form G7 as specified in the
Guidelines for ICSS.
Net claims incurred refers to the claims paid, increase or decrease in provisions for outstanding claims liabilities within the preceding assessment year and net of reinsurance recoveries.
Management expenses
General Business Revenue Account, Form G1 as specified in the Guidelines
for ICSS.
Management expenses refer to all expenses relating to insurance business other than claims and commission.
Net commission
Statement of Commissions, Form G8 as specified in the
Guidelines for ICSS.
Net commission refers to the commissions and profit commission and brokerage paid or payable on direct business and on
reinsurance accepted business less
commissions and profit commissions earned on reinsurance ceded.
Earned premium
income
Statement of Premiums, Form G6 as specified in the
Guidelines for ICSS.
Earned premium income refers to net premiums less increase or plus decrease in premium liabilities within the preceding assessment year.
Score Range:
Combined Ratio
Range of Results Score (%)
Combined Ratio < 90.00% 25
90.00% ≤ Combined Ratio ≤ 95.00% 16
95.00% < Combined Ratio ≤ 100.00% 8
Page 26 Appendix 6 OPERATIONAL AND SUSTAINABILITY MEASURE
- GENERAL INSURANCE BUSINESS
Mean-adjusted Return Volatility
Formula:
Mean-Adjusted Return Volatility =
Semi standard deviation of operating profit or loss over three (3) years
Mean operating profit or loss over three (3) years
Note:
(i) Operating profit or loss refers to the profit or loss arising from business operation, which includes earned premium income, net claims incurred, management expenses, net commission, net investment income, net bad and doubtful debts/bad debts recovery, net capital gains or losses and other income or outgo (excludes any income or expenses arising from recognition of deferred taxation).
(ii) For the computation of this ratio, operating profit should not include taxation for the year.
Data
Requirement Source of Information Remarks
Earned premium
income
Statement of Premiums, Form G6 as specified in the
Guidelines for ICSS.
Earned premium income refers to net premiums less increase or plus decrease in premium liabilities within the preceding assessment year.
Net claims incurred
Statement of Claims, Form G7 as specified in the Guidelines
for ICSS.
Net claims incurred refers to the claims paid, increase or decrease in provisions for outstanding claims liabilities within the preceding assessment year and net of reinsurance recoveries.
Management expenses
General Business Revenue Account, Form G1 as specified
in the Guidelines for ICSS.
Management expenses refer to all expenses relating to insurance business other than claims and commission.
Net commission
Statement of Commissions, Form G8 as specified in the
Guidelines for ICSS.
Net commission refers to the
commissions and profit commission and brokerage paid or payable on direct business and on reinsurance accepted business less commissions and profit commissions earned on reinsurance ceded.
Net bad and doubtful debts/ Bad debts recovery
General Business Revenue Account, Form G1 as specified
in the Guidelines for ICSS.
-
Net investment income
General Business Revenue Account, Form G1 as specified
in the Guidelines for ICSS.
Page 27 Data
Requirement Source of Information Remarks
Net capital gains or losses
General Business Revenue Account, Form G1 as specified
in the Guidelines for ICSS.
Net capital gains or losses includes:
(i) Profit on disposal of securities,
properties and other properties, plant and equipment;
(ii) Loss on disposal of securities,
properties and other properties, plant and equipment;
(iii) Accretion of discount on securities;
(iv) Amortisation of premiums on
securities;
(v) Unrealised gain on securities and
other investment
(vi) Unrealised loss on securities and
other investments;
(vii) Write back of impairment loss of
securities and other investments;
(viii) Impairment loss of securities and
other investments; and
Other supporting information.
(ix) Changes of gross Available-For-Sale
(“AFS”) reserves *
* Changes of gross AFS reserves is the difference between AFS reserves, gross of tax as at 31 December of two years immediately preceding the assessment year and the AFS reserves, gross of tax, as at 31 December of one year immediately preceding the assessment year.
Other income/outgo
General Business Revenue Account, Form G1 as specified
in the Guidelines for ICSS.
Other income/outgo excludes any tax income/expense arising from recognition of deferred taxation.
Score Range:
Mean-Adjusted Return Volatility
Range of Results Score (%)
0 ≤ MARV ≤ 0.2 15
0.2 < MARV ≤ 0.5 10
MARV > 0.5 0
MARV is negative or the mean operating profit/(loss) over a period of three years is zero
0
Page 28 Appendix 7 OPERATIONAL AND SUSTAINABILITY MEASURE
- LIFE INSURANCE BUSINESS
New Business Growth Rate
Formula:
New Business Growth Rate =
[New business premiums (t) –
New business premiums (t-1)] x 100% New business premiums (t-1)
3-year weighted average New Business
Growth Rate =
[50% x growth rate (t)] + [30% x growth rate (t-1)] + [20% x growth rate (t-2)]
where,
t = one year immediately preceding the current assessment year; t-1= two years immediately preceding the current assessment year; and t-2 = three years immediately preceding the current assessment year. Note:
(i) The new business premiums refer to both single and annual premiums for all types of businesses (ordinary life, annuity and investment-linked) as reported in the ‘Statement of New Policies’ as specified in the Guidelines for ICSS.
(ii) The new business growth rate is based on a 3-year weighted average growth rate, i.e. weightages of 50% for one year immediately preceding the current assessment year, 30% for two years immediately preceding the current assessment year and 20% for three years immediately preceding the current assessment year.
(iii) An insurance company which has less than four (4) years of data shall not be assigned a score for this ratio. The score of this ratio shall be determined on a proportionate basis as specified in paragraph 7.12 (Insufficient Quantitative Information).
Data
Requirement Source of Information Remarks
Single and annual/
regular premiums
Statement of New Policies, Form L6 as specified in the Guidelines for ICSS.
The annual premiums
equivalent (“APE”) is adopted where it aggregates total new regular premiums with 10% new single premiums in the calculation.
Score Range:
New Business Growth Rate
Range of Results Score (%)
New Business Growth Ratio > 10.00% 15
5.00% < New Business Growth Ratio ≤ 10.00% 10
0.00% < New Business Growth Ratio ≤ 5.00% 5
Page 29 Appendix 8 OPERATIONAL AND SUSTAINABILITY MEASURE
- LIFE INSURANCE BUSINESS
Business Concentration Ratio
Formula:
Business
Concentration Ratio =
New business regular premiums (t)
x 100% New business single premiums (t)
where,
t = one year immediately preceding the current assessment year.
Data
Requirement Source of Information Remarks
New business regular premiums
“Annual Premiums” category in the Statement of New Policies, Form L6 as specified in the Guidelines for
ICSS.
New business regular premiums refers to total annual premiums
that include ordinary life,
investment-linked and annuities. New business
single premiums
“Single Premiums” category in the Statement of New Policies, Form L6
as specified in the Guidelines for ICSS.
New business single premiums refers to total annual premiums
that include ordinary life,
investment-linked and annuities.
Score Range:
Business Concentration Ratio
Range of Results Score (%)
Business Concentration Ratio > 200.00% 25
150.00% < Business Concentration Ratio ≤ 200.00% 16
100.00% ≤ Business Concentration Ratio ≤ 150.00% 8
Business Concentration Ratio < 100.00% 0
Page 30 Appendix 9 OPERATIONAL AND SUSTAINABILITY MEASURE
- LIFE INSURANCE BUSINESS
Business Conservation Ratio
Formula: Business Conservation Ratio = Renewal premiums (t) x 100% Renewal premiums (t-1) +
First year premiums (t-1) where,
t = one year immediately preceding the current assessment year; and t-1= two years immediately preceding the current assessment year.
Data
Requirement Source of Information Remarks
Renewal premiums
Premiums Income/Consideration of Annuities Granted, Form L1-1 (Schedule 1) and Premiums/Net Creation of Units for
Investment-Linked Business, Form L1-2 (Schedule 1) as specified in the
Guidelines for ICSS.
Renewal premiums refer to premiums receivable subsequent to the first policy year, where the premiums payment term is two or more years. In calculating the renewal premiums, it includes the total gross direct
premiums for renewal year’s
premiums of all businesses and total investment-linked operating fund for renewal year premiums.
First year premiums
Premiums Income/Consideration of Annuities Granted, Form L1-1 (Schedule 1) and Premiums/Net Creation of Units for
Investment-Linked Business, Form L1-2 (Schedule 1) as specified in the
Guidelines for ICSS.
First year premiums refer to premiums receivable for the first policy year, where the premiums payment term is two or more years. In calculating the first year premiums, it includes the total gross direct premiums for first year’s premiums income of all businesses and total investment-linked operating fund for first year premiums.
Score Range:
Business Conservation Ratio
Range of Results Score (%)
Business Conservation Ratio > 90.00% 25
85.00% < Business Conservation Ratio ≤ 90.00% 16
80.00% ≤ Business Conservation Ratio ≤ 85.00% 8
Page 31 Appendix 10 OPERATIONAL AND SUSTAINABILITY MEASURE
- LIFE INSURANCE BUSINESS
Investment Yield
Formula:
Investment Yield =
2 x [Net investment income (I) +
Net capital gains or losses (C)] x 100% Total assets (t) + Total assets (t-1) – (I+C)
where,
t = one year immediately preceding the current assessment year; and t-1= two years immediately preceding the current assessment year. Note:
(i) In setting the benchmark for the score range, the Malaysian Government Securities (“MGS”) 5-year Spot Rate is used, i.e. average MGS spot rate as at the last trading date of each quarter within the preceding assessment year. The MGS spot rate refers to the MGS for the tenure of five (5) years, as published by Bond Pricing Agency Malaysia Sdn. Bhd.
Data
Requirement Source of Information Remarks
Net investment
income
Life Business Revenue Account, Form L1-1 and Form L1-2, as specified in
the Guidelines for ICSS.
Net investment income refers to the total net investment income that includes ordinary life, investment linked operating fund and annuity.
Net capital gains or losses
Life Business Revenue Account, Form L1-1 and Form L1-2, as specified in
the Guidelines for ICSS.
Net capital gains or losses* includes:
(i) Profit on disposal of securities and
properties;
(ii) Loss on disposal of securities and
properties;
(iii) Accretion of discounts on
securities;
(iv) Amortisation of premiums on
securities;
(v) Unrealised gain on securities and
other investments;
(vi) Unrealised loss on securities and
other investments;
(vii) Write back of impairment loss of
securities and other investments;
(viii) Impairment loss of securities and
Page 32
Data
Requirement Source of Information Remarks
Net capital gains or losses
Other supporting information.
(ix) Changes of gross AFS reserves**
* The net capital gains or losses includes
ordinary life, annuities and
investment-linked operating fund. **Changes of gross AFS reserves is the
difference between AFS reserves, gross of tax as at 31 December of two years immediately preceding the current assessment year and the AFS reserves, gross of tax, as at 31 December of one year immediately preceding the current assessment year.
Total assets
Life Fund Balance Sheet, Form L3-2 and Form L3-3,
as specified in the Guidelines for ICSS.
Total assets refer to total assets of the insurance funds, where insurance funds includes ordinary life, annuities and investment-linked operating fund.
Score Range:
Investment Yield
Range of Results Score (%)
Investment Yield > MGS + 175bp 20
MGS + 100bp < Investment Yield ≤ MGS + 175bp 14
MGS + 50bp ≤ Investment Yield ≤ MGS + 100bp 7
Page 33 Appendix 11 OPERATIONAL AND SUSTAINABILITY MEASURE
- LIFE INSURANCE BUSINESS
Expense Ratio
Formula:
Expense Ratio =
Management expenses +
Agency remuneration x 100% Net premium income
Data
Requirement Source of Information Remarks
Management expenses
Life Business Revenue Account, Form L1, as specified in the Guidelines for
ICSS.
Management expense is defined as all expenses relating to insurance and investment-linked business, other than claims and agency remuneration, from all businesses, i.e. ordinary life, investment-linked, and annuity.
Agency remuneration
Life Business Revenue Account, Form L1, as specified in the Guidelines for
ICSS.
Agency remuneration is defined as total commission paid to agents, agency leaders or other intermediaries (such as banks) in respect of single premiums, premiums relating to the first policy year and renewal policy years of the insurance contracts, net of reinsurance commission, and agency-related expenses*. For investment-linked business, agency remuneration refers to remuneration or reward for bringing in business.
In calculating the agency remuneration, it
should include all the agency
remuneration for all businesses, i.e. ordinary life, investment-linked, and annuity.
*Agency-related expenses include
material incentives, fringe benefits, break-away benefits and office maintenance expenses paid/payable to agents or agency leaders.
Net premium income
Life Business Revenue Account, Form L1, as specified in the Guidelines for
ICSS.
Net premium income is defined as total net premium income from all businesses, i.e. ordinary life, investment-linked, and annuity.
Page 34 Score Range:
Expense Ratio
Range of Results Score (%)
Expense Ratio < 20.00% 15
20.00% ≤ Expense Ratio < 30.00% 10
30.00% ≤ Expense Ratio < 40.00% 5
Page 35 ILLUSTRATION 1: COMPUTATION OF FREE CAPITAL INDEX
Insurance Company A
Four (4) Quarters Within the Preceding Assessment Year 31 March 30 June 30 September 31 December
Capital Adequacy
Ratio 200.00% 210.00% 190.00% 220.00%
Individual Target Capital Level: 200%
Free Capital Index =
Capital adequacy ratio (%) * Individual target capital level (%)
= (200.00% + 210.00% + 190.00% + 220.00%) / 4 200.00%
= 205.00% 200.00% = 1.03
* Average CAR of four (4) quarters within the preceding assessment year.
As a result, Insurance Company A will be allocated at the free capital index range of 1.00 to 1.10.
Page 36 ILLUSTRATION 2: COMPUTATION OF GROSS PREMIUM GROWTH RATE
Insurance Company B
Gross premiums for 2015 (RM’ 000): 620,000 Gross premiums for 2014 (RM’ 000):
Gross premiums for 2013 (RM’ 000):
560,000 520,000 Gross premiums for 2012 (RM’ 000): 480,000 Gross Premium Growth
Rate =
[Gross premiums (t) – Gross premiums (t-1)]
x 100% Gross premiums (t-1)
One year immediately preceding the current assessment year (t) Gross Premium Growth
Rate = (RM620 million – RM560 million) x 100% RM560 million = RM60 million x 100% RM560 million = 10.71%
Two years immediately preceding the current assessment year (t-1) Gross Premium Growth
Rate = (RM560 million – RM520 million) x 100% RM520 million = RM40 million x 100% RM520 million = 7.69%
Three years immediately preceding the current assessment year (t-2) Gross Premium Growth
Rate = (RM520 million – RM480 million) x 100% RM480 million = RM40 million x 100% RM480 million = 8.33% 3-Year Weighted Average
Gross Premium Growth
Rate =
[50% x growth rate (t)] + [30% x growth rate (t-1)] + [20% x growth rate (t-2)]
= [50% x 10.71%] + [30% x 7.69%] + [20% x 8.33%] = 9.33%
As a result, Insurance Company B will get a score of 14% under the gross premium growth rate indicator.
Page 37 ILLUSTRATION 3: COMPUTATION OF BUSINESS DIVERSIFICATION RATIO
Insurance Company C
As at 31 December of the Preceding Assessment Year RM’000
Provision of risk margin for adverse deviation 120,000
Fund provision of risk margin for adverse deviation 100,000
Business
Diversification Ratio =
Provision of risk margin for adverse deviation - Fund provision of risk margin for adverse deviation
x 100% Provision of risk margin for adverse deviation
= RM120 million - RM100 million x 100% RM120 million
= 16.67%
As a result, Insurance Company C will get a score of 8% under the business diversification ratio indicator.
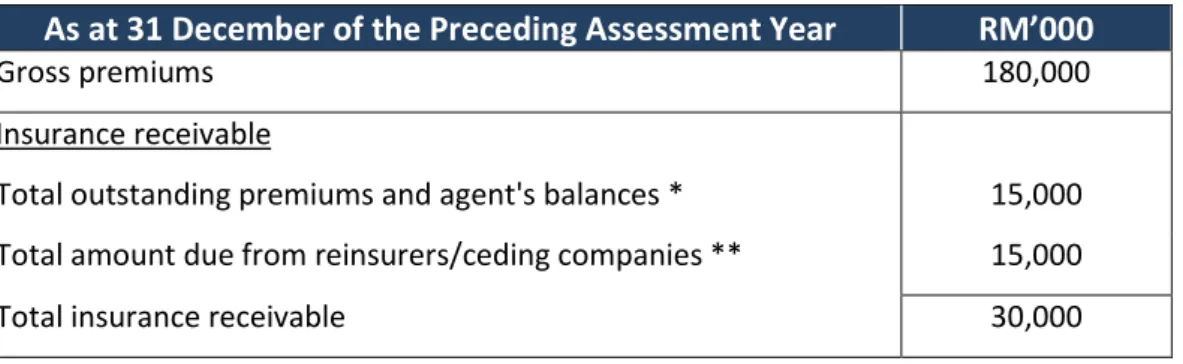
Page 38 ILLUSTRATION 4: COMPUTATION OF RECEIVABLE RATIO
Insurance Company D
As at 31 December of the Preceding Assessment Year RM’000
Gross premiums 180,000
Insurance receivable
Total outstanding premiums and agent's balances * 15,000
Total amount due from reinsurers/ceding companies ** 15,000
Total insurance receivable 30,000
* Only includes outstanding balances more than 60 days. ** Only includes amount due more than 90 days.
Receivable Ratio = Insurance receivables x 100% Gross premiums = RM30 million x 100% RM180 million = 16.67%
As a result, Insurance Company D will get a score of 5% under the receivable ratio indicator.
Page 39 ILLUSTRATION 5: COMPUTATION OF COMBINED RATIO
Insurance Company E
As at 31 December of the Preceding Assessment Year RM’000
Earned premium income 95,000
Net claims incurred 50,000
Management expenses 25,000
Net commission 15,000
Combined Ratio =
(Net claims incurred + Management expenses
+ Net commission) x 100%
Earned premium income
= (RM50 million + RM25 million + RM15 million) x 100% RM95 million
= 94.74%
As a result, Insurance Company E will get a score of 16% under the combined ratio indicator.
Page 40 ILLUSTRATION 6: COMPUTATION OF MEAN-ADJUSTED RETURN VOLATILITY
Formula:
Semi-standard deviation of operating profit/(loss) over three (3)years*
Mean operating profit/(loss) over three (3) years 1 ( − 1) × (ri- Mean) 2 , t-2 i=t
only when ri < Mean
where,
= operating profit;
Mean = the average operating profit over three (3) years;
t = one year immediately preceding the current assessment year; t-1= two years immediately preceding the current assessment year; t-2 = three years immediately preceding the current assessment year; and n= number of observations. i.e. 3.
Illustration 6.1: Insurance Company F
Operating Profit for 2013 (RM’ 000) : 240,000 ( ) Operating Profit for 2014 (RM’ 000) : 150,000 ( ) Operating Profit for 2015 (RM’ 000) : 180,000 ( ) Mean = RM240 million + RM150 million + RM180 million
3 = RM190 million
Given the operating profit for 2014 ( ) and 2015 ( ) were less than the mean of RM190 million, the semi-standard deviation will be computed as follows:
Semi-standard deviation = (0) 2+(150-190)2+(180-190)2 (3-1) = 1,700 2
= 29.15 * Semi-standard Deviation =
Page 41 Mean-Adjusted Return Volatility = Semi-standard deviation of operating profit
Mean operating profit
= 29.15 190
= 0.15
In this case, Insurance Company F scores 15% for this indicator.
Illustration 6.2:
Insurance Company G
Operating Loss for 2013 (RM’ 000) : (60,000) ( ) Operating Profit for 2014 (RM’ 000) : 100,000 ( ) Operating Profit for 2015 (RM’ 000) : 150,000 ( )
Mean = RM(60 million) + RM100 million + RM150 million 3
= RM63.33 million
Given the operating loss for 2013 ( ) was less than the mean of RM63.33 million, the semi-standard deviation will be computed as follows:
Semi-standard deviation = (-60-63.33) 2+(0)2+(0)2 (3-1) = 15,210.29 2
= 87.21
Mean-Adjusted Return Volatility = Semi-standard deviation of operating profit
Mean operating profit
= 87.21 63.33 = 1.38
Page 42 ILLUSTRATION 7: COMPUTATION OF NEW BUSINESS GROWTH RATE
Insurance Company H
New Business Premiums
Year Single Premiums (SP) Annual Premiums (AP) Annual Premium Equivalent (APE) [(SP x 10%) +AP] (RM’ 000) 2015 20,000 130,000 132,000 2014 20,000 125,000 127,000 2013 10,000 120,000 121,000 2012 10,000 100,000 101,000
New Business Growth Rate =
[New business premiums (t) –
New business premiums (t-1)] x 100% New business premiums (t-1)
One year immediately preceding the current assessment year (t)
New Business Growth Rate = (RM132 million – RM127 million) x 100% RM127 million
= RM5 million x 100% RM127 million
= 3.94%
Two years immediately preceding the current assessment year (t-1)
New Business Growth Rate = (RM127 million – RM121 million) x 100% RM121 million
= RM6 million x 100% RM121 million
= 4.96%
Three years immediately preceding the current assessment year (t-2)
New Business Growth Rate = (RM121 million – RM101 million) x 100% RM101 million
= RM20 million x 100% RM101 million
Page 43 3-Year Weighted Average
New Business Growth Rate = [50% x growth rate (t)] + [30% x growth rate (t-1)] + [20% x growth rate (t-2)]
= [50% x 3.94%] + [30% x 4.96%] + [20% x 19.80%] = 7.42%
As a result, Insurance Company H will get a score of 10% under the new business premium growth rate indicator.