CALCULATION OF AVERAGE WEIGHTED COST OF CAPITAL FOR
INDIVIDUAL SHARES OF SARAJEVO AND BANJA LUKA STOCK
EXCHANGE
Almir AlihodžićUniversity of Zenica, Bosnia and Herzegovina almir.dr2@gmail.com
Dejan Erić
Institute of Economic Sciences, Serbia
Abstract:
The cost of capital is a discount rate, based on which discounted cash flow factor and residual value are determined. The cost of capital in literature is often found by the name of cost of capital or the opportunity cost of capital, which should provide a rate of return on capital that would be formed from an alternative investment capital. In order to achieve this, the cost of capital also includes a risk to achieve the rate of return. The Weighted Average Cost of Capital - WACC represents the average rate of return that a company must pay to shareholders and creditors. Most often, it is an adjusted discount rate, suitable for the risk of cash flows of companies. The cost of capital depends on the risk of cash flow businesses. In addition, the company is financed by borrowing or lending of funds, whether from banks, individuals or other sources. This paper explores the possibility to calculate weighted average cost of capital for individual shares within the share market indexes of SASX – 30 and BIRS.
1. INTRODUCTION
The Weighted Average Cost of Capital - WACC is the average rate of return that a company must pay to shareholders and creditors. It is usually an adjusted discount rate to the risk of the cash flows of companies (Vukicevic et al. 2010, p. 166). In addition, a company is financed by borrowing, i.e. borrowing funds from banks, individuals or other sources. Interests are paid to the amount of the debt, i.e. the price of the debt is paid. Payments for interests made by company also serve for the direct reduction of taxes, because interest costs are recognised as expenses.
The determination of the WACC rate is very important for the capital market because it enables safer investment in a company and regulation of the market. This rate is the most important for the enterprise management and future investors. It is of importance for the management because it enables them to analyse the current state of the enterprise on the market and for future investors for safer investments of their capital.
The paper is structured in three parts. The first part describes the theoretical concept of the weighted average cost of capital, as well as the method of determining the cost of capital. The second part describes the market indicators of the Sarajevo and Banja Luka Stock Exchange securities. The third part calculates the weighted average cost of capital of the three largest telecom operators of Bosnia and Herzegovina listed on the stock exchanges of BH and which are a part of stock indices SASX-30 and BIRS. The final section sets out the conclusions as a result of the research.
2.
DETERMINATION OF PRICES AND COST OF CAPITAL
One of the main financial functions of a company is financing. Therefore, we can say that the financing is compensation to the owners of capital, i.e. the cost of capital invested and engaged. The cost of capital is usually defined as the required rate of return on various forms of financing and it can be viewed from the standpoint of investors, customers and the value of the company. Each component of capital has its own individual capital cost expressed by a discount rate, which should be determined based on the market value of certain components of the capital, reflecting investors’ requests for reimbursement, which means that they have to respond to investors’ opportunities in the company. In this regard, not only explicit but also implicit costs of capital need to be covered. The basic components of an enterprise capital structure include long-term debt, preferred stock, retained earnings and common shares. Every company has a different combination of these components that change over time (Kolcevic & Hreljac, 2012, p. 213).
When calculating the cost of capital, is necessary to cover the risk of achieving rates of return. According to their type, the risks are divided into (1) systematic risk and (2) non-systematic risk. The systematic risk includes factors arising from the economic and political environment, such as changes in exchange rates, fluctuations in raw material prices, inflation, tax reform, changes in the cost of salary levels and so on. These are general market risks that the company’s management has no influence on and which investors cannot avoid by diversifying investments within the national economy. Therefore, the systematic risks are ignored in determining the cost of capital.
Unsystematic risks are individual risks, they vary from company to company and they are conditioned by several factors: market position, competitiveness of own products in the market, level of dependence upon customers, suppliers and creditors, negative press reports, yielding, property and financial position. Unsystematic risks cannot be eliminated by changing owners and management of companies. Their removal takes more time and they are conditioned by inventiveness and creativity of the company’s management, among other things. In theory and practice, the cost of capital is determined by (Filipovic & Rodic, 2010, p. 60):
- Relative risk premium, or - Capital Asset Pricing Model.
The relative risk premium is also called the method of masonry because it is based on the assumption that the discount rate and capitalization rate are composed of a number of risk factors that can be identified and, when viewed together, a total return that an investor would expect from corporate takeovers. The discount rate is generally determined in two steps, and after their implementation, additional steps are possible, depending on the particularity of a company being valued. The first step is to determine the rate of investment without risk on the valuation day. That rate is the yield on an
investment with a very low risk, for example investment in government bonds. In the second step, the risk premium, which an average investor will require above average rates of return with no risk, is added to the rate. The premium is related to investment in equity and presents an additional yield or return that is above the expected return on an investment with a very low risk (Poznanić & Cvijanovic, 2011, p 56.)
The CAPM model was developed by Treynor, Sharpe, Linter and Mossin in the early 60s of the twentieth century and it was later further reviewed. The model predicts the relationship between the risk and balanced expected returns on risky assets. The basic version of the CAPM model is based on several simplifying assumptions including: (1) investors can not affect the price of their individual transactions; (2) all investors have the same investment period; (3) investors create portfolios of publicly traded an widely available instruments, such as stocks and bonds, and they can give and borrow with no limitation at the risk-free rate; (4) investors do not pay taxes on income or transaction costs; (5) all investors are trying to develop efficient frontier portfolios, i.e. the investors are rational and seek an optimal relationship between the risk and return; (6) all investors analyse securities in the same manner and have the same view on the world economy (Bodie et al. 2009, p. 205).
In determining the discount rate and capitalization rate by the CAPM method, data on comparable companies are used. If such data are available and if they are valid, appraisers should use the CAPM method and not the method of building. In order to determine which company can be comparable with the company that is valued, the appraiser should have in mind the similarity of activities, financial risk (capital structure, liquidity), company size (sales volume, profit, number of plants or retail outlets) and geographic diversification of the company. The method of building is certainly a useful starting point for understanding the basic characteristics of the CAPM method. Thus, the CAPM model has many similarities with the method of building, the only difference is that instead of the average return on the market (for example, S&P 500), it uses the average yield of comparable companies. Countries with developed markets such as the U.S., in companies with shares, the rate of dividends on ordinary shares is taken as return on equity, and a group of corporations offering covered by the index S & P 500 is taken as return on equity of the entire market. For our circumstances, return rates on equity of a company can be taken, as well as the observed rate of return on equity of a group of companies engaged in the activity of the observed companies. When beta is determined, the expected return is determined as follows:
1
Where: - risk free rate, coeffcient beta, – market risk premium.
Since the CAPM model was developed in the U.S. market, it is necessary to correct risk premium for which the calculation is done, so as not to underestimate risk investment in less developed countries. The adjusted expected return formula is:
2
Where:
Country risk premium.
The WAAC is one of most important models in the assessment of the financial health of the company,
both for internal use (capital budgeting), and for external use (valuation of companies in the financial market). With this model investors assess whether a given company in which they intend to invest their capital is a good investment decision. The WACC is the required return that investors expect for the capital employed. In addition to the capital structure, in order to determine the weighted average cost of capital, the price (cost) and equity price (cost) of interest-bearing liabilities are needed. The price (cost) of bearing liabilities is determined based on the average interest rate on interest-bearing liabilities. The interest-interest-bearing liabilities are determined on the date of valuation or any other day during the period of net cash flow projections. During the period, cash flow projections of the existing credit obligations on the date of valuation will decrease due to repayments of principal and increase with the new loan borrowing to finance investments if the assessed company has no free capital to finance the investment (Rodic & Filipović, 2010, p. 95). The cost of debt capital can be defined in one of two ways (1) based on accounting data, (2) pursuant to an effective level of borrowing rates and associated costs of debt and (3) based on the sum of the rates of return on risk-free investments and debit the appropriate premium for specific company or sector.
In order to calculate accurately the WAAC, specific rates of return required for each source of capital must be well known, because different funding sources can attract different ways of taxation or interest that should be justified. Although the formula for calculating the weighted average cost of capital seems simple, different analysts often use different formulas to calculate the average cost of capital, depending on how they interpret a company debt, market value of interest rate.
1 3
Where:
- cost of capital; - cost of debt;
market value of equity; debt of company;
total assets/total liabilities; - percentage financed by capital; – percentage financed by debt;
– income tax rate.
2.1
Coefficient Beta
The coefficient beta measures the intensity of changes in the share returns to changes with reference to the overall market share, i.e. a degree of relative variation of returns. The relative degree of variation is calculated based on the actual rate of return on equity of the company and the observed actual rate of return on equity in the market. If β = 1, it means that the rate of return on equity of companies observed varies identically with the rate of return on equity of group companies. If β = 2, it means that the rate of return on equity of the company observed varies more than double the rate of return on equity in the market. Finally, if β = 0.5 it means that the rate of return on equity of the company varies less than half in comparison with to the observed ranges of rates of return on equity in the market. The coefficient beta is calculated as the ratio of the covariance of return on a j-section and the variance of return on the overall market, which can be expressed mathematically by the following equation (Alihodžić, 2011, p. 238):
,
4
Empirical evidence proves that the statistical phenomenon called regression toward the middle is valid for the coefficients beta. This means that securities that have high beta, i.e. at one time, will have high beta in the future as well. Conversely, securities with low beta will have a higher beta in the future. In this study, the beta will adjust so that the score of the sample is multiplied by 2/3 and the value of 1.0 by 1/3, so the adjusted beta will be ( 2/3 (Bodie et. al, 2009, p. 218).
2.1. Market Risk Premium
The market risk premium is a difference between the expected market return and risk-free rate of return on investment, or in other words, an additional return above the risk-free rate on investment. Calculation of expected market returns can be made by applying ex-ante or ex-post approach. In this study, the ex-post approach, which is based on historical data, is used. This approach is based on the assumption that investors' expectations are largely influenced by past performance, and that will not change significantly in the future.
2.2. Country Risk Premium
The country risk premium is a compensation for investing in shares of companies operating in market of a particular country. By investing in these shares, investors are directly exposed to risks that are specific to that particular country. In 2011, for Bosnia and Herzegovina this risk was 6.5% (Alibegović, 2011, p. 205).
3.
TENDENCIES IN CAPITAL MARKET OF BOSNIA AND HERCEGOVINA
In addition to these general requirements, features and condition of the capital market in BH is also illustrated by the following indicators. The total turnover in 2012 in the Sarajevo Stock Exchange amounted to 191 million EUR, which is a relative increase by 52.61% over the turnover in respect of sales achieved in 2011 and makes 58.9% of the total turnover on the stock exchanges of BH. The total turnover in 2012 at the Banja Luka Stock Exchange amounted to 133.4 million EUR, which is a relative decrease by 38.67% compared to the turnover in the previous year, and 41.1% of the total turnover in BH exchanges. The total turnover on the stock exchanges of Bosnia and Herzegovina in 2012 amounted to 324.4 million EUR, which represents a slight decrease by 5.33% compared to the sales in 2011.
Table 1: Total Turnover on Stock Exchange of BH for the period: 2010 - 2012
in mil EUR
No. Period SASE BLSE Total
1. 2010. 55.502.973 90.087.114 145.590.087
2. 2011. 125.157.663 217.519.787 342.677.450
3. 2012. 191.007.137 133.412.383 324.419.520
Performance 2012
(3-2/2): 52.61% (38.67%) (5.33)
Source: http://www.dep.gov.ba, Information on macroeconomic indicators for the period January - December 2012, p. 12 - 13 (Calculation by Author)
On the capital market in BH, ten indices track price movements of shares, out of which three are monitored and published by SASE, six indices are monitored and reported by BLSE and one by Vienna Stock Exchange with a different time period. Primarily, the subject of analysis in this study will be telecom operators in the composition of the stock market SASX - 30 and BIRS.
The stock index SASX – 30 is a price index, i.e. a dividend index is not taken into account when calculating the index. The SASX – 30 index aims to provide investors and analysts with a general assessment of developments in the most liquid part of the Sarajevo Stock Exchange. The index composition can include only symbols of issuers that are primarily listed on the free market.1 The initial value of SASX- 30, i.e. the base value, is 1.000 index points, while the starting date of the index is 31 March 2009.
The stock exchange index in the capital market of the Republic Srpska – BIRS includes the best shares of companies and banks. It was established on 1 May 2004. The number of shares that constitute the BIRS index may vary from 5 to 15, depending on the criteria they meet for the inclusion of shares in the index of BIRS. The number of issuers whose shares are included in BIRS depends on the number of issuers in the official stock exchange market and the number of issuers that meet the requirements for the composition of BIRS. The composition of BIRS can include the shares of issuers that meet general requirements and criteria for the inclusion of shares in the BIRS, except for shares of investment funds.
In 2012, on the Sarajevo Stock Exchange, the index of investment funds BIFX recorded an increase in the value of 3.77%. Value of SASX-10 recorded a decrease in the amount of 3.87% over the previous year. In addition, the drop was noted in the index SASX-30, whose value fell by 1.00% over the previous year.
The stock exchange index of the Republic of Srpska - BIRS on 31 December 2012 had the value of 807.23 index points, which represents a relative decrease by 7,88% compared to the same period last year. At the end of 2012, the value of the market capitalization on the Sarajevo Stock Exchange increased from EUR 2.234.863.831 to EUR 2.303.145.380, which is a relative increase by 3.05% in comparison to the previous year. Unlike the Sarajevo Stock Exchange, the total market capitalization of all securities traded on the Banja Luka Stock Exchange on 31 December 2012 amounted to EUR 1.956.515.499, which is a relative decrease by 0.23%, compared to the same period in the previous year.
3.1 DATA
For the calculation of weighted average cost of capital in the capital market of Bosnia and Herzegovina it is necessary to have adjusted financial statements of companies listed on the stock exchange quotations of Sarajevo and Banja Luka Stock Exchange securities, as well as the estimated cost of capital rate. The companies that will be the subject of the analysis of the average cost of capital are (1) BH Telecom Sarajevo - BHTSR, (2) JP HT Mostar - HTKMR and (3) Telekom of Republic Srpska Banja Luka - TLKM-R-A. The companies that will be assessed in the average cost of capital are (1) BH Telecom Sarajevo - BHTSR, (2) JP HT Mostar - HTKMR and (3) Telekom of Republic Srpska Banja Luka - TLKM-R-A.
BHTSR - BH Telecom is a joint stock company established with the aim of making profit and providing services in the telecommunications sector in Bosnia and Herzegovina. The initial capital of BH Telecom Sarajevo is divided into shares, out of which approximately 90% is owned by the Federation and 10% is owned by PIF (Private Investment Funds) and small shareholders. The total number of ordinary shares issued is 63.457.358, with a nominal value of EUR 5.12 under the symbol BHTSR listed on the Sarajevo Stock Exchange.
HTKMR - JP HT Mostar is also a company that operates in the market of Bosnia and Herzegovina and provides services in the field of telecommunications. The Croatian Telecommunications is a company established by separating the Croatian Post and Telecommunications into the Croatian Post (HP) and Croatian Telecom (HT), and it became one of the three national operators in Bosnia and Herzegovina. Owners of HT Mostar are Federation of Bosnia and Herzegovina (FBH) 50.1%, T- Telekom Zagreb (T-HT, Zagreb) 39.1%, Croatian Post Inc., Zagreb (HP, Zagreb) 5.23% and 5.57% by small shareholders. The total number of ordinary shares issued is 31.586.325 with a nominal value of EUR 5.12 under the symbol HTKMR listed on the Sarajevo Stock Exchange.
TLKM-RA Telekom of Srpska is a telecommunications operator based in Banja Luka. Telecommunications company RS, Banja Luka in addition to its full name, also operates under two names abbreviated as follows: Telekom of Srpska and M:Tel, Banja Luka. The M:Tel Banja Luka, with its headquarters in Banja Luka, is one of three leading telecom operators in Bosnia and Herzegovina, which offers unique communication solutions under a unified corporate brand MOBI. The majority owner of the Telekom of Srpska is the Telekom of Serbia, Belgrade with about 65% share. Telekom of Srpska has issued a total of 491.383.755 of ordinary shares with a nominal value of EUR 0.50104 The following are calculations of WACC and its individual components through practical examples, based on data on movement of stock market price of the financial statements and three largest telecom operators in the market of Bosnia and Herzegovina.
Coefficients Beta of Comparable Companies
By using data on movement of the stock market price and market value of SASX-30 and BIRS, beta coefficients were calculated for BH Telecom, Telecom of Srpska and HT Mostar. In addition, by using the obtained values, values of the coefficients beta are calculated and set, as illustrated in the following table.
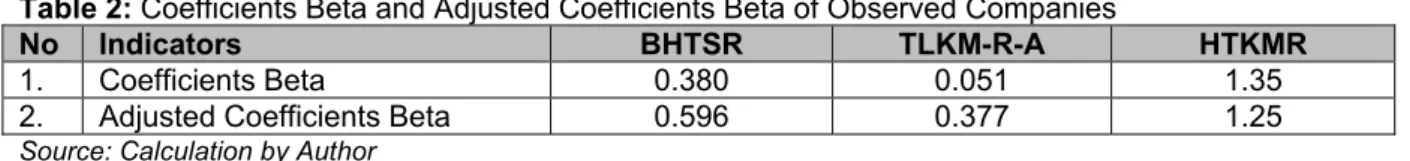
Table 2: Coefficients Beta and Adjusted Coefficients Beta of Observed Companies
No Indicators BHTSR TLKM-R-A HTKMR
1. Coefficients Beta 0.380 0.051 1.35
2. Adjusted Coefficients Beta 0.596 0.377 1.25 Source: Calculation by Author
From the table above, it is evident that shares of the Serbian Telekom ad Banja Luka, observed in relation to the stock exchange index BIRS, have very low value of the beta coefficient, which means they belong to low-risk shares within that index or that they have a lower level of systemic risk in relation to the index BIRS as a whole. On the other hand, shares of the HT Mostar have the coefficient beta value higher than 1 and they are categorised among riskier stocks in the composition SASX-30. According to the obtained data on the amount of coefficient beta, shares of companies BH Telecom and Telekom of Srpska can be placed among the so-called "defensive" shares. Their yield will be slower to increase or decrease, in comparison to SASX-30 and BIRS, calculated in proportion to the amount of coefficients beta. Shares of HT Mostar company, according to the amount of coefficient
beta, can be classified among "aggressive" shares and their market price will grow faster and decline faster than the increase or decrease in the value of SASX-30. The coefficient beta of the HT Mostar company in the amount of 1.25 indicates that yield of these shares will increase or decrease 25% faster than the increase or decrease in the yield of SASX-30.2
The following chart illustrates the movement of stock market prices of companies BH Telecom and HT Mostar, as well as the changes in the value of SASX-30. It can be seen from the chart that changes in the prices of these shares and indices during the mentioned period are moving in roughly the same direction. Also, one can see the tendency of long-term decline in shares prices and value of SASX-30, which is particularly pronounced in shares of the HT Mostar company. If we take a look at the price of shares in the HT Mostar company, we see that it has a faster growth and decline in the value than SASX-30 index, as evidenced by the calculated coefficient beta.
Chart 1: Trends in Share Prices BH Telecom and HT Mostar in Relation to Index SASX-30 for Period 2010 - 2011
Source: Calculation by author
The Chart 2 illustrates the movement in the market price of shares in Telekom of Srpska company and the value of BIRS index. as in the previous chart, it can be seen that the changes move in the same direction, with the share price rising and falling slower than the values of the index, which can also be confirmed by the previously calculated coefficient beta in the amount of 0.377. The share price of the Telecom Srpska in long-term has a tendency to rise.
Chart 2: Trends in Share Prices of Telecom of Srpska in Relation to Index BIRS for the Period 2010 - 2011
Source: Calculation by Author
Calculation of Market Risk Premium
2 Coefficient beta determines the slope of characteristic regression of the securities. The higher the coefficient
In order to calculate the market risk premium, it is necessary to calculate the expected market rate of return on shares of companies surveyed. The approach we selected is also the most commonly used approach, i.e. historical premiums.
Table 3: Calculation of Expected Rate of Return for BH Telecom, Telecom of Srpska and HT Mostar
Source: Calculation by Author
It is clear from the table above that the Telekom of Srpska shares have a relatively low rate of expected return calculated based on historical data, or changes in the last two years, and even lower than the risk-free rate or the rate of return on government bonds. The reason for this can be found in the relatively high market price of shares on the date of observation, i.e. 31 December 2011, which means that the date and price are not suitable for the investment in Telekom of Srpska if we take into account only this indicator.
These results are reduced by the risk-free rate of return on investment in order to obtain the final market risk premium. For the risk-free rate of return, we took an annual interest rate of 2.5% on the bonds of old foreign currency savings of the Federation BH, in which the annual inflation series of FBIHKZ, whose due date is 31 August 2016, was anticipated. By the application of the data above, we obtained a market risk premium for BH Telecom of 15.41%, for Telekom of Srpska (0.54%) and HT Mostar 15.52%.
The approximate amount of market risk premium of company HT Mostar and BH Telecom are the result of observation of these shares in the stock market index of same composition, as well as the fact that these companies operate with the same business in the same market. Rates of debt are calculated based on accounting data for the observed enterprises, so that the cost of debt capital for BH Telecom is 5.64%, Telekom of Srpska 3.55% and HT Mostar 16.40%.
No. SCENARIO BH TELECOM - BHTSR
PRICE RETURN PROBABILITY
1. Deep recession 17,32 -5,20% 1,93% 2. Recession 17,80 -2,60% 6,87% 3. No change 31.11.11. 18,27 0% 0,21% 4. Growth 20,62 12,86% 40,56% 5. High growth 22,97 25,73% 50,43% , % 100%
No. SCENARIO TELEKOM SRPSKE - TLKM-R-A
PRICE RETURN PROBABILITY
1. Deep recession 1,24 -15,07% 20,25% 2. Recession 1,35 -7,53% 28,62% 3. No change 31.12.11. 1,46 0,00% 1,64% 4. Growth 1,62 10,96% 33,54% 5. High growth 1,78 21,92% 15,95% , % 100%
No. SCENARIO JP HT MOSTAR - HTKMR
PRICE RETURN PROBABILITY
1. Deep recession 7,2 -17,53% 0,75% 2. Recession 7,965 -8,76% 18,80% 3. No change 31.12.11. 8,73 0,00% 1,50% 4. Growth 10,36 18,67% 51,88% 5. High growth 11,99 37,34% 27,07% , % 100%
These data suggest a high rate of debt by HT Mostar. The reason for this can be traced to the presence of financial leasing costs in the funding structure of the company. The companies of BH Telecom and Telekom of Srpska have relatively low interest rates. By calculating the cost rate of equity, we obtained data that it amounts to 18.19% for the BH Telecom, 8.80% for Telekom of Srpska and 28.34% for HT Mostar. The following table illustrates the calculation of the required return on equity for the companies observed.
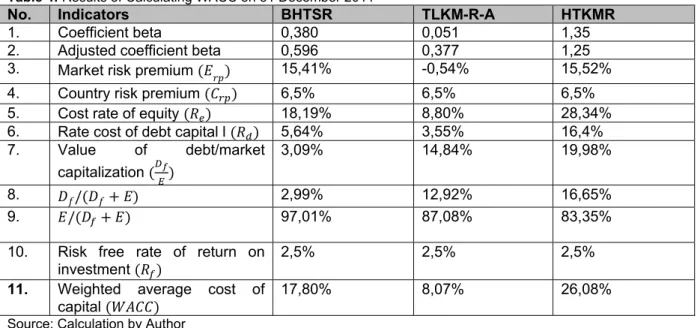
Table 4: Results of Calculating WACC on 31 December 2011
No. Indicators BHTSR TLKM-R-A HTKMR
1. Coefficient beta 0,380 0,051 1,35
2. Adjusted coefficient beta 0,596 0,377 1,25
3. Market risk premium 15,41% -0,54% 15,52%
4. Country risk premium 6,5% 6,5% 6,5%
5. Cost rate of equity 18,19% 8,80% 28,34%
6. Rate cost of debt capital l 5,64% 3,55% 16,4%
7. Value of debt/market capitalization
3,09% 14,84% 19,98%
8. / 2,99% 12,92% 16,65%
9. / 97,01% 87,08% 83,35%
10. Risk free rate of return on
investment 2,5% 2,5% 2,5%
11. Weighted average cost of capital
17,80% 8,07% 26,08%
Source: Calculation by Author
According to the calculations, the shares of the HT Mostar company have the highest WACC, as well as the highest investment risk. On the other hand, the shares of the Telekom of Srpska have the lowest calculated WACC and the lowest investment risk. Therefore, investors who are prone to risk and yet expect a higher rate of return on invested assets, after watching these three stocks, will direct their investment towards the shares of HT Mostar. Investors who are less prone to risky investments, and with less consciously projected rate of return on invested assets, will find shares of Telekom of Srpska as the most interesting among these three options offered.
CONCLUSION
One of the basic issues of financial management is the choice of capital structure, i.e. combination of debt and equity in order to reduce the cost of capital and increase the value of a company. The weighted average cost of capital is an important factor when making investment decisions. The calculation of the weighted average cost of capital implies a combination of different factors that influence an investor's decision to invest securities. Certainly, one of the most important components in calculating the weighted average cost of capital is a systemic risk, represented by the coefficient beta. It is well known that the risk cannot be eliminated, but it is important to know the degree of exposure of individual securities to that risk so it could be reduced by proper diversification. This rate is usually said to reflect the risk of future cash flows for creditors and shareholders. Every company whose cash balance exceeds the debt will have a negative net debt and use the net negative relations to give the beta without the leverage that is greater than the beta with a lever. Companies that have extensive cash balances that exceed their borrowing could have a beta with a lever below the beta without leverage for their operations.
Securities with a coefficient beta of less than 1, which in the mentioned examples is the case with the companies of BH Telecom and Telekom of Srpska, were defensive shares and changes in the prices of these shares react slowly to changes in the index value. The share of the HT Mostar company is an aggressive share, and changes in the prices of these shares were higher in the relative amount of change in value of the index as a whole. These statements are most easily observed in the charts presenting the line of movement of share prices of comparable companies and the movement of index.
It is clear from the research that the shares of Telekom of Srpska have the lowest beta coefficient, i.e. out of all comparable companies, it has the lowest level of systemic risk. Finally, the calculated weighted average cost of capital shows that Telekom of Srpska, id addition to the lowest coefficient beta has the lowest weighted average cost of capital, which confirms the rule that investment in less risky securities carries a lower required return.
REFERENCE LIST
1. Alihodzic, A., Plakalovic, N. (2013). Contemporary management finance with application in MS
Excel, Institute of Economic Sciences, Belgrade.
2. Alihodzic, A. (2010). Calculation of beta coefficient for stocks listed on Sarajevo, Banja Luka and Belgrade Stock Exchange: Journal Banking Republic of Serbia, Belgrade, 1, 86-105 3. Alibegović, J. (2011). Corporate Governance, the state and prospects of economic
development in BH: Revicon, Sarajevo
4. Bodie, Z., Kane, A., Marcus, A. J. (2009). Fundamentals of Investments: DATA STATUS, Belgrade
5. Erić, D., Đukić, Đ. M. (2012). Financial markets in crisis conditions, Institute of Economic Sciences, Belgrade Banking Academy - Faculty for Banking, Insurance and Finance, Belgrade.
6. Damodaran, A. (2010). Analysis of investment securities and corporate finance, MATE, Zagreb
7. Kolačevic, S., Hreljac, B. (2012). Evaluation of Enterprise: Business Consulting, Zagreb 8. Poznanic, V., Cvijanovic, J. M. (2011). Company valuation methods: Institute of Economics,
Belgrade
9. Rodic, J. Filipovic, M. (2010). Evaluation of Companies: ASIMEX DOO, Belgrade
10. Vukicevic, M., Gregurek, M., Odobasic, S., Grgic, J. (2010). Financial management in MS
Excel, Zagreb: Golden Marketing - Technical books
11. http://www.investopedia.com/articles/fundamental/03/061103.asp#axzz2K3Uk8VDf 12. http://195.222.43.81/sase-final/language/hr-HR/Tr%c5%bei%c5%a1te/Indexi/SASX-30.aspx 13. http://www.blberza.com/Cms2FileCache/files/cms2/docver/19710/files/Metodologija_BIRS_20 _05_11.pdf 14. http://www.cbbh.ba/index.php?id=698&lang=bs 15. http://www.capitalmarket.ba/TRGOVANJE/IndeksSASX30/tabid/185/jezik/en-US/default.aspx