Prepared for the State Board of Higher Education
2014
S
TUDENT
A
FFORDABILITY
R
EPORT
Table of Contents
Overview of Report ... 1
Tuition and Mandatory Fees ... 3
Total Estimated Student Cost ... 6
Financial Aid Issues and Trends ... 7
Federal Need-based Financial Aid ... 7
Student Loan Indebtedness ... 7
Education and Earnings ... 11
Appendix 1: Student Loan Volume by Year ... 14
Appendix 2: Comparison of NDUS and Regional Averages Resident Undergraduate Tuition and Mandatory Fees ... 16
1
North Dakota University System
Student Affordability Report
January 2014
Overview of Report
In 2013-14, tuition and mandatory1 fee rates at UND, NDSU, MiSU and the four-year campuses were less than their regional counterparts. The gap differential decreased slightly at UND and NDSU, but continued to increase at MiSU and the four-year
campuses. A tuition rate freeze at NDUS’s two-year campuses, from 2008-09 through 2012-13, helped to narrow the gap that exists between the NDUS and its two-year regional counterparts; however, NDUS two-year campus rates continue to be higher than regional counterparts. (TABLE 1)
NDUS 2012-13 room and board rates at the four-year campuses continue to be less than regional rates. (TABLE 2)
Tuition and mandatory fees at all NDUS campuses, as a percentage of median North Dakota household income, is lower than the regional average, except for the two-year campuses, where the percentage is slightly higher than the regional average. (TABLE 3)
1
The total average 2013-14 estimated gross student cost (which does not take into account financial aid or other discounts) is as follows: (TABLE 4)
2013-14 Estimated Total Student Cost
Total Cost 1
UND/NDSU $18,800
MiSU $15,900 4-Year $15,500 2-Year $14,200
1
Total cost includes tuition, fees, room, board, books, supplies, travel and other miscellaneous expenses.
Tuition and fees range from 29-40 percent of the total estimated student cost; room, board, books, supplies, travel and other expenses account for the remaining
60-71 percent of the cost.
Loan volume growth has slowed. At the doctoral institutions, the change from 2002-03 to 2012-13 was an increase of 69.4% but the 5-year change was 28%. At 4-year schools, the change from 2002-03 to 2012-13 was an increase of 26.1%, however, the 5-year change actually shows a decline of 5.4%. At 2-year schools, the 2002-03 to 2012-13 change was an increase of 61.3% with the 5-year change slowing to 11.1%.
1
Mandatory fees are those assessed to all students regardless of program and would not include course or program specific fees.
2
Pell Grant and campus-based funds awarded were steady to slightly declining from 2002-03 to 12-13 (TABLE 5A). All three institution types showed a significant change around 2008-09, mainly due to year-round Pell Grant. Federal funding levels have generally not increased over the time span, with the exception of slight annual increases to Pell Grant. The growth in Pell Grant and campus-based funding has outpaced loan volume growth over the past five years.
According to The Project on Student Debt, nationally, 71% of all seniors who graduated in 2012 had student loan debt. The average was $29,400 per borrower. From 2008 to 2012, debt increased an average of 6% each year nationally.
The Project on Student Debt reported that North Dakota ranked 13th in 2011 among states with an average debt of $27,425 per borrower. Eighty-three percent of the 2011 ND graduates held some type of debt at graduation, which ranked 1st in the U.S.
Based on NDUS data, in 2012, the average NDUS federal student loan indebtedness for graduates was $23,884 at doctoral universities, $23,376 at four-year institutions and $12,531 at two-year colleges. The total federal and non-federal student loan debt average was $32,542 at doctoral universities, $26,687 at four-year and $14,116 at two-year institutions. The combined average for the three institution types was
3
Tuition and Mandatory Fees
With the exception of the two-year campuses, tuition and mandatory fees for NDUS campuses continue to be less than their regional counterparts in 2013-14. The average rate at NDUS two-year campuses continues to be higher than the regional rate.
TABLE 1
Comparison of NDUS Campuses to Regional Average Tuition and Mandatory Fees for Resident Undergraduate
UND/NDSU MiSU 4-year 2-year 2007-08
NDUS Variance to Reg’l Average ($) ($327) ($140) +$120 +617
NDUS Variance to Reg’l Average (%) (5.1%) (2.9%) +2.6% +20.5%
2008-09
NDUS Variance to Reg’l Average ($) ($450) ($141) +$115 +$660
NDUS Variance to Reg’l Average (%) (6.6%) (2.7%) +2.4% +21.2%
2009-10
NDUS Variance to Reg’l Average ($) ($610) ($31) +$108 +$594
NDUS Variance to Reg’l Average (%) (8.5%) (.6%) 2.2% +18.5%
2010-11
NDUS Variance to Reg’l Average ($) ($799) ($46) +$57 +$513
NDUS Variance to Reg’l Average (%) (10.5%) (.8%) 1.1% +15.5%
2011-12
NDUS Variance to Reg’l Average ($) ($920) ($307) ($219) +$440
NDUS Variance to Reg’l Average (%) (11.4%) (5.1%) (3.9%) +12.7%
2012-13
NDUS Variance to Reg’l Average ($) ($1,170) ($465) ($485) +$316
NDUS Variance to Reg’l Average (%) (13.9%) (7.3%) (8.0%) +8.6%
2013-14
NDUS Variance to Reg’l Average ($) ($1,083) ($537) ($580) +$326
NDUS Variance to Reg’l Average (%) (12.6%) (8.1%) (9.2%) +8.6%
Region includes: Colorado, Iowa, Kansas, Minnesota, Missouri, Montana, Nebraska, Oklahoma, South Dakota, Wisconsin and Wyoming
4
The published source of information for regional room and board rates is not available for 2013-14. During 2013-14, NDUS room and board rates increased as follows: UND/NDSU average increase – 3.4 percent, MiSU increase – 6.2 percent, and 4-year average
increase – 5.5 percent. Due to the historical size of the regional gap noted in Table 2, North Dakota University System’s 2014-15 room and board rates will likely continue to be less than their regional counterparts.
TABLE 2
Comparison of NDUS Room and Board Rates1 To Regional Average
UND/NDSU MiSU 4-year
2007-08
NDUS Variance to Reg’l Average
($) ($658) ($488) ($788)
NDUS Variance to Reg’l Average
(%) (11.1%) (10.2%) (16.7%)
2008-09
NDUS Variance to Reg’l Average
($) ($673) ($590) ($847)
NDUS Variance to Reg’l Average
(%) (10.8%) (11.8%) (17.0%)
2009-10
NDUS Variance to Reg’l Average
($) ($733) ($610) ($821)
NDUS Variance to Reg’l Average
(%) (11.0%) (11.5%) (15.9%)
2010-11
NDUS Variance to Reg’l Average
($) ($969) ($678) ($869)
NDUS Variance to Reg’l Average
(%) (13.4%) (12.2%) (16.2%)
2011-12
NDUS Variance to Reg’l Average
($) ($1,150) ($858) ($716)
NDUS Variance to Reg’l Average
(%) (15.2%) (14.9%) (13.1%)
2012-13
NDUS Variance to Reg’l Average
($) ($1,061) ($1,279) ($550)
NDUS Variance to Reg’l Average
(%) (13.8%) (20.2%) (9.9%)
1
Based on double room occupancy and 14-15 meals per week
Source: Student Costs at Public Institutions, Academic Year(s) 2004-05 through 2012-13 Regional Survey Report, published by the South Dakota Board of Regents
5
A comparison of 2013-14 NDUS tuition and mandatory fees as a percent of 2012 median North Dakota household income shows that tuition and mandatory fees at UND and NDSU, as a percent of median household income, is 2.9 percent lower than their regional counterparts. Tuition and fees as a percent of median household income at MiSU and the other four-year campuses is 1.9 percent and 2.3 percent lower than their regional counterparts, respectively. The share of median household income that is required to cover tuition and mandatory fees at NDUS two-year campuses is slightly higher than their regional peers.
.
TABLE 3
Comparison of NDUS and Regional Average Tuition & Fees as a Percent of Median Household Income
UND/NDSU MiSU 4-year 2-year
ND Reg’l ND Reg’l ND Reg’l ND Reg’l
2007-08
NDUS/Regional Resident Undergraduate Tuition & Fees as % of 2006 Median
Household Income 14.7% 13.5% 11.6% 10.4% 11.3% 10.2% 8.8% 6.3%
2008-09
NDUS/Regional Resident Undergraduate Tuition & Fees as % of 2007 Median
Household Income 15.5% 14.4% 12.3% 10.9% 11.9% 10.2% 9.2% 6.5%
2009-10
NDUS/Regional Resident Undergraduate Tuition & Fees as % of 2008 Median
Household Income 14.3% 14.4% 11.7% 10.9% 11.0% 10.2% 8.3% 6.4%
2010-11
NDUS/Regional Resident Undergraduate Tuition & Fees as % of 2009 Median
Household Income 13.6% 15.4% 11.3% 11.7% 10.4% 10.8% 7.7% 6.7%
2011-12
NDUS/Regional Resident Undergraduate Tuition & Fees as % of 2010 Median
Household Income 13.9% 16.4% 11.2% 12.4% 10.6% 11.7% 7.6% 7.0%
2012-13
NDUS/Regional Resident Undergraduate Tuition & Fees as % of 2011 Median
Household Income 12.9% 16.6% 10.5% 12.7% 9.8% 12.6% 7.1% 7.2%
2013-14
NDUS/Regional Resident Undergraduate Tuition & Fees as % of 2012 Median
Household Income 13.5% 16.4% 10.9% 12.8% 10.2% 12.5% 7.3% 7.1%
6
Total Estimated Student Cost
In 2013-14, tuition and mandatory fees comprised approximately 29 percent (at two-year campuses) to 40 percent (at UND/NDSU) of the total estimated student cost, which range from $14,200 to $18,800. Room, board, books, supplies, travel and other expenses account for the remaining 60-71 percent.
TABLE 4
NDUS Total Estimated Student Costs*
UND/NDSU MiSU 4-year 2-year
2003-04 $11,700 $9,900 $9,900 $9,100
2004-05 $12,700 $10,600 $10,700 $9,800
2005-06 $13,700 $11,300 $11,400 $10,300
2006-07 $14,600 $12,400 $11,900 $10,800
2007-08 $15,300 $13,000 $12,500 $11,400
2008-09 $16,000 $13,400 $13,000 $11,900
2009-10 $16,700 $14,300 $13,600 $12,300
2010-11 $17,300 $14,800 $14,000 $12,800
2011-12 $17,900 $15,100 $14,600 $13,400
2012-13 $18,400 $15,500 $15,100 $13,800
2013-14 $18,800 $15,900 $15,500 $14,200
One-year change from 2012-13 to 2013-14
$400 2.2%
$400 2.6%
$400 2.6%
$400 2.9% Ten-year change
from 2003-04 to 2013-14
$7,100 60.9%
$6,000 60.6%
$5,600 56.6%
$5,100 56.0%
* The total costs include tuition, fees, room and board, and estimated annual costs (for
2013-14) for books and supplies of $1,000 per year, and travel and miscellaneous other expenses of $3,461 per year, based on the amounts that the campuses use when packaging financial aid.
7
Financial Aid Issues and Trends
During the 2012-13 academic year, more than 56 percent of North Dakota University System undergraduate students received some form of financial aid, including federal and state need-based aid, loans and other institutional aid.
Federal Need-based Financial Aid
Federal need-based aid consists of the Federal Pell Grant and campus-based aid
programs, which include Federal Supplemental Educational Opportunity Grants (FSEOG), Federal Perkins Loans and Federal College Work-Study.
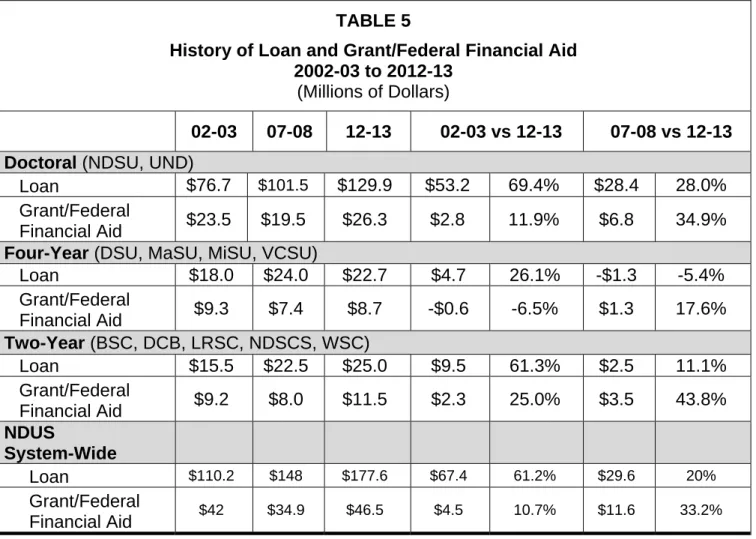
TABLE 5 summarizes the Federal Pell Grant and Federal Campus-Based financial aid dollars received by NDUS students in 2002-03, 2007-08 and 2012-13. In comparing the 2002-03 Pell Grant and campus-based awards to the 2012-13 awards, the overall dollars received were 11.9% higher at doctoral institutions, 6.5% lower at four year institutions and 25% higher at two-year institutions. Comparing five years ago, the funding level at
doctoral, four-year and two-year institutions all showed increases of 34.9%, 17.6% and 43.8%, respectively.
Historically, maximum Pell Grant award amounts have been significantly lower than federal appropriations. In 2002-03 the maximum federal Pell Grant award was $4,000, in 2007-08 it was $4,310 and in 2012-13 it was $5,550. The percentage change from 2002-03 to 2012-13 was 38.8%. However, the percentage of cost of attendance that the grant covers has continued to decrease. According to College Board, the maximum Pell Grant covered 87% of average public four-year tuition and fees in 2003-04, but will only cover
approximately 63% of tuition and fees in 2013-14. Additionally, students are finding decreased eligibility due to recent federal legislation. A student’s lifetime eligibility for Pell Grant as of 2012-13 is limited to no more than 12 fulltime semesters (6 years). [“Maximum Pell Grant as Percentage of Tuition and Fees and Total Charges over Time.” CollegeBoard 2013.
<http://trends.collegeboard.org>.]
Student Loan Indebtedness
At the same time that grant eligibility is covering less of a student’s cost, student loan debt levels continue to rise. The 2002-03 loan volume compared with the 2012-13 loan volume increased by $67.4 million system-wide. The five year difference was $29.6 million, as noted in TABLE 5. In considering this data, it is important to also review Appendix 1 to note the annual loan levels and changes in enrollment. As Appendix 1 shows, the one-year change in average loan amounts showed slight increases at four-one-year schools to a 2.8% reduced average annual loan amount at two-year schools. The doctoral institutions saw no change in the one-year average annual loan amount. Similarly, the number of borrowers has continued to significantly decline at all institution types. The slowing growth of annual loan volume is encouraging, especially given that students have had the
opportunity for increased loan limits. In 2007-08, the Higher Education Reconciliation Act of 2005 increased annual Stafford loan limits for freshmen, sophomores and graduate students. The Ensuring Continued Access to Student Loans Act of 2008 increased annual loan limits for undergraduate students, allowing for an additional $2,000 of unsubsidized loan borrowing per year.
8
The most recent information from The Project on Student Debt, an initiative of the Institute for College Access & Success, finds that, “Seven in 10 college seniors (71%) who
graduated in 2012 had student loan debt, with an average of $29,400 per borrower. From 2008 to 2012, debt at graduation (federal and private loans combined) increased an
average of six percent each year.” This data encompassed public and private institutional data. The review of the class of 2011 indebtedness showed graduates carrying an
average debt load of $26,600 nationally. North Dakota ranked 13th among states with an average debt of $27,425 in 2011. Eighty-three percent of the 2011 ND graduates held some type of student loan debt at graduation. This rank was #1 in the US. [“The Project on Student Debt” The Institute for College Access & Success, 2013. <http://projectonstudentdebt.org>.]
NDUS public institution average federal student loan indebtedness for 2011 graduates was $22,633 at doctoral universities, $22,715 for four-year institutions and $12,676 for two-year colleges. The total federal and non-federal student loan debt average was $31,870 at doctoral universities, $26,033 at four-year and $14,366 at two-year institutions. The combined average for the three institution-types was slightly above $24,000. These amounts do not include PLUS loans and reflects first-time students who started at the college and incurred debt while enrolled.
In 2012, the average NDUS federal student loan indebtedness for graduates was $23,884 at doctoral universities, $23,376 at four-year institutions and $12,531 at two-year colleges. The total federal and non-federal student loan debt average was $32,542 at doctoral universities, $26,687 at four-year and $14,116 at two-year institutions. The combined average for the three institution types was approximately $24,400. These amounts do not include PLUS loans and reflects first-time students who started at the college and incurred debt while enrolled.
According to Inside Higher Ed, a trend reveals that “College students from middle-income families are more likely to end up with student loan debt than their peers from both lower and higher socioeconomic backgrounds.” The study found that middle income families with incomes between $40,000-$59,000 incurred 60% more debt than lower income students. [“Study: Student Debt Squeezes Middle Class the Most.” Inside Higher Ed, 2013.
<http://www.insidehighered.com>.]
Increased borrowing by NDUS students may be a result of a variety of factors, including changes to the Stafford loan program in 2007 and 2008, which allowed students to borrow higher levels of federal student loans annually, particularly in the form of unsubsidized loans. Also, changes in the estimated cost of attendance has outpaced the growth rate of the major federal grant programs, resulting in more unmet need which students fund
through increased borrowing. Other factors can include economic downturns and resulting shrinking family resources.
9
TABLE 5
History of Loan and Grant/Federal Financial Aid 2002-03 to 2012-13
(Millions of Dollars)
02-03 07-08 12-13 02-03 vs 12-13 07-08 vs 12-13 Doctoral (NDSU, UND)
Loan $76.7 $101.5 $129.9 $53.2 69.4% $28.4 28.0%
Grant/Federal
Financial Aid $23.5 $19.5 $26.3 $2.8 11.9% $6.8 34.9%
Four-Year (DSU, MaSU, MiSU, VCSU)
Loan $18.0 $24.0 $22.7 $4.7 26.1% -$1.3 -5.4%
Grant/Federal
Financial Aid $9.3 $7.4 $8.7 -$0.6 -6.5% $1.3 17.6%
Two-Year (BSC, DCB, LRSC, NDSCS, WSC)
Loan $15.5 $22.5 $25.0 $9.5 61.3% $2.5 11.1%
Grant/Federal
Financial Aid $9.2 $8.0 $11.5 $2.3 25.0% $3.5 43.8%
NDUS
System-Wide
Loan $110.2 $148 $177.6 $67.4 61.2% $29.6 20%
Grant/Federal
Financial Aid $42 $34.9 $46.5 $4.5 10.7% $11.6 33.2%
Table Sources: 2002-03, 2007-08 and 2012-13 FISAP Data; NDUS Report NDU_0176_FA; http://studentaid.ed.gov/about/data-center/student/title-iv.
Loan amounts include student FFEL and Direct Subsidized and Unsubsidized Loans and Parent PLUS Loans. Perkins Loans are included in the campus-based grant and federal financial aid data. Private and institutional loans are not represented.
10
TABLE 5A
$0.0 $5.0 $10.0 $15.0 $20.0 $25.0 $30.0 $35.0
Four‐year Pell Grant and Other Campus Based Aid Trends
Millions of DollarsFour‐year
Doctoral
11
Education and Earnings
Personal earnings generally increase with higher levels of educational attainment. A December 2012 analysis of median income levels by degree-attainment level is noted in the table below.
TABLE 6
Median Wage Salary Income
Source: The Economic Benefits of Postsecondary Degrees A State and National Analysis,
December 2012
Individuals and society both benefit from post-secondary education in a variety of ways. As the table above shows, degree-attainment and wages are associated. In addition, higher levels of education can also be linked to more compensation in the form of benefits such as health insurance and retirement. College Board noted that education is correlated with various health outcomes and healthy behaviors. This includes reduced smoking levels and increased exercise rates. Societal benefits are also correlated to education attainment through higher rates of volunteering, reduced unemployment and public assistance program enrollment, increased voter participation, as well as increased tax revenue for governments. Individuals with college degrees tend to be more active in their communities.
Data indicates that individuals who enter the workforce at age 18 rather than going to college do have higher annual earnings initially. For individuals who borrow to attend college, at around age 34, earnings start to surpass the earnings of non-degreed
individuals at a rapid rate. In fact, College Board data indicates that, “Compared to a high school graduate, the median four-year college graduate who enrolls at age 18 and
$54,530
$39,540
$33,104
$27,459
$68,064
$50,360
$38,607
$29,423
$0 $10,000 $20,000 $30,000 $40,000 $50,000 $60,000 $70,000 $80,000
Graduate or Professional
Degree
Bachelor's Associate Diploma
ND National
12
graduates in four years can expect to earn enough by age 36 to compensate for being out of the labor force for four years and for borrowing the full tuition and fee amount without any grant aid.”
SOURCES: U.S. Census Bureau, 2012, Table PINC-03; Baum and Ma, 2012; calculations by the authors. CollegeBoard, Education Pays 2013, trends.collegeboard.org
Estimated Cumulative Full-Time Earnings (in 2011 Dollars) Net
of Loan Repayment for Tuition and Fees, by Education Level
13
Average lifetime earnings are also considerably higher than the median earnings of high school graduates. Again, College Board noted that over a full working life (40 years), the median earnings of an individual who holds a bachelor’s degree is 65% higher than a high school graduate over the same time span. The earnings of individuals with associate degrees are 27% higher and those with some college but no degree, 13% higher.
Expected Full-Time Lifetime Earnings Relative to High School Graduates,
by Education Level
Sources: U.S. Census Bureau, 2012, Table PINC-03; calculations by the authors. CollegeBoard, Education Pays 2013, trends.collegeboard.org
14
APPENDIX 1
NDUS Two-Year Campus Annual Loan Volume* (BSC, LRSC, DCB, NDSCS, WSC)
Year
Loan Amount Borrowed
(millions of dollars)
Number of Borrowers Number of Borrowers/Total Headcount** Enrollment Average Annual Loan
2002-03 $17.2 7,190 86% $2,392
2003-04 $19.8 7,744 87% $2,556
2004-04 $20.0 6,475 72% $3,089
2005-05 $19.3 6,213 71% $3,106
2006-07 $24.7 6,822 76% $3,621
2007-08 $29.4 7,364 83% $3,992
2008-09 $30.1 7,500 74% $4,013
2009-10 $27.7 5,101 48% $5,430
2010-11 $28.5 5,301 47% $5,376
2011-12 $28.6 5,150 48% $5,553
2012-13 1-yr change 10-yr change $25.0 -12.6% 45.3% 4,633 -10.0% -35.6% 43% -10.4% -50.0% $5,396 -2.8% 126% *Includes undergraduate borrowing for Federal Subsidized Loans, Unsubsidized Loans, and Parent PLUS Loans. Excludes Perkins Loans, HRSA Nursing Loans and private/institutional loans. Amounts are rounded.
**Fall 2012 headcount 10,731.
Sources Appendix 1: Student Loans of ND (SLND) and Education Assistance Corp (EAC) for academic years 2001-02 through 2008-09. Effective 2009-10 and forward, the loan volume and unduplicated number of borrowers is obtained from Report NDU_0176_FA. Total headcount taken from fall enrollment reports by institution type.
NDUS Four-Year Campus Annual Loan Volume* (DSU, MaSU, MiSU, VCSU)
Year
Loan Amount Borrowed
(millions of dollars)
Number of Borrowers Number of Borrowers/Total Headcount** Enrollment Average Annual Loan
2002-03 $17.7 5,968 77% $2,966
2003-04 $21.2 6,803 84% $3,116
2004-04 $23.4 6,130 74% $3,817
2005-05 $23.1 5,906 72% $3,911
2006-07 $25.5 6,047 77% $4,217
2007-08 $26.8 5,816 78% $4,607
2008-09 $27.1 5,880 70% $4,609
2009-10 $25.9 4,298 49% $6,026
2010-11 $26.5 4,414 53% $6,004
2011-12 $24.9 4,116 53% $6,050
2012-13 1-yr change 10-yr change $22.7 -8.8% 28.2% 3,730 -9.4% -37.5% 51% -3.8% -33.8% $6,086 0.60% 105% *Includes undergraduate borrowing for Federal Subsidized Loans, Unsubsidized Loans, and Parent PLUS Loans. Excludes Perkins Loans, HRSA Nursing Loans and private/institutional loans. Amounts are rounded.
**Fall 2012 headcount 7,339.
Sources Appendix 1: Student Loans of ND (SLND) and Education Assistance Corp (EAC) for academic years 2001-02 through 2008-09. Effective 2009-10 and forward, the loan volume and unduplicated number of borrowers is obtained from Report NDU_0176_FA. Total headcount taken from fall enrollment reports by institution type.
15
NDUS Doctoral Campus Annual Loan Volume* (NDSU, UND)
Year
Loan Amount Borrowed
(millions of dollars)
Number of Borrowers
Number of Borrowers/Total
Headcount** Enrollment
Average Annual Loan
2002-03 $77.1 20,275 86% $3,803
2003-04 $86.2 20,839 86% $4,136
2004-04 $89.9 19,727 78% $4,557
2005-05 $86.5 18,753 75% $4,613
2006-07 $97.4 19,198 77% $5,073
2007-08 $117.4 19,139 76% $6,134
2008-09 $116.9 18,158 66% $6,438
2009-10 $123.0 15,970 56% $7,702
2010-11 $129.2 16,779 58% $7,700
2011-12 $133.9 17,047 57% $7,855
2012-13
1-yr change 10-yr change
$129.9 -3.0% 68.5%
16,538
-3.0% -18.4%
69%
21.1% 19.8%
$7,855
0.00% 107% *Includes undergraduate borrowing for Federal Subsidized Loans, Unsubsidized Loans, and Parent PLUS Loans. Excludes Perkins Loans, HRSA Nursing Loans and private/institutional loans.
**Fall 2012 headcount 23,941.
Sources Appendix 1: Student Loans of ND (SLND) and Education Assistance Corp (EAC) for academic years 2001-02 through 2008-09. Effective 2009-10 and forward, the loan volume and unduplicated number of borrowers is obtained from Report NDU_0176_FA. Total headcount taken from fall enrollment reports by institution type.
16
Appendix 2
A Comparison of North Dakota and Regional Averages 2013-14 Resident Undergraduate Tuition and Mandatory Fees
1/ 2013-14 Rate as a % of
Median Income Doctoral
Universities 2007-08 2008-09 2009-10 2010-11 2011-12 2012-13 2013-14
of Households North Dakota
Average $6,053 $6,370 $6,569 $6,798 $7,134 $7,244 $7,524 13.5%
+(-) prev yr-$ $311 $317 $199 $229 $336 $111 $280
+(-) prev yr-% 5.4% 5.2% 3.1% 3.5% 4.9% 1.5% 3.9%
Colorado 6,635 7,278 7,932 8,511 9,152 9,482 10,347 18.1%
Iowa 6,161 6,360 6,651 6,996 7,486 7,726 7,726 14.5%
Kansas 6,600 7,042 7,414 8,025 8,469 8,888 9,278 18.6%
Minnesota 9,598 10,634 11,293 12,288 13,060 13,524 13,618 22.0%
Missouri 8,098 8,467 8,501 8,501 8,928 9,272 9,430 18.9%
Montana 5,141 5,141 5,334 5,476 5,722 5,973 6,045 13.4%
Nebraska 6,216 6,585 6,857 7,312 7,648 7,984 8,060 15.4%
Oklahoma 5,607 6,493 6,493 6,784 7,124 7,340 7,340 15.2%
South Dakota 5,393 5,828 6,468 6,762 7,209 7,704 8,022 16.2%
Wisconsin 7,184 7,569 8,310 8,987 9,672 10,385 10,402 19.6%
Wyoming 3,552 3,621 3,726 3,927 4,125 4,278 4,404 7.7%
Regional Average $6,380 $6,820 $7,180 $7,597 $8,054 $8,414 $8,607 16.4%
+(-) prev yr-$ $327 $439 $360 $417 $457 $360 $192
+(-) prev yr-% 5.4% 6.9% 5.3% 5.8% 6.0% 4.5% 2.3%
1/ This column reflects tuition and fees as a % of 2012 median household income, which takes into account the income of multiple wage earner families, and is a reflection of a family’s ability to pay.
17
A Comparison of North Dakota and Regional Averages 2013-14 Resident Undergraduate Tuition and Mandatory Fees
1/ 2013-14 Rate as a % of Median Income Master's-Granting Univ. 2007-08 2008-09 2009-10 2010-11 2011-12 2012-13 2013-14 of Households
NORTH DAKOTA $4,774 $5,044 $5,389 $5,637 $5,763 $5,922 $6,087 10.9%
+(-) prev yr-$ $282 $270 $345 $248 $126 $159 $165
+(-) prev yr-% 6.3% 5.7% 6.8% 4.6% 2.2% 2.8% 2.8%
Colorado 3,466 3,790 4,454 4,971 5,895 6,402 7,449 13.0%
Iowa No Comparatives
Kansas 3,708 3,931 4,177 4,382 4,622 4,864 5,132 10.3%
Minnesota 5,894 6,083 6,295 6,595 7,026 7,340 7,344 11.9%
Missouri 6,215 6,513 6,518 6,518 6,850 7,052 7,180 14.4%
Montana 5,132 5,132 5,206 5,242 5,470 5,711 5,745 12.7%
Nebraska 4,768 4,999 5,220 5,514 5,759 6,013 6,048 11.6%
Oklahoma 3,825 4,196 4,196 4,422 4,671 4,974 5,264 10.9%
South Dakota 5,441 5,877 6,227 6,516 6,960 7,320 7,617 15.4%
Wisconsin 5,781 6,146 6,488 6,989 7,381 7,803 7,839 14.8%
Wyoming No Comparatives
Regional Average $4,914 $5,185 $5,420 $5,683 $6,070 $6,387 $6,624 12.8%
+(-) prev yr-$ $311 $271 $235 $263 $387 $316 $238
+(-) prev yr-% 6.7% 5.5% 4.5% 4.9% 6.8% 5.2% 3.7%
1/ This column reflects tuition and fees as a % of 2012 median household income, which takes into account the income of multiple wage earner families, and is a reflection of a family’s ability to pay.
18
A Comparison of North Dakota and Regional Averages 2013-14 Resident Undergraduate Tuition and Mandatory Fees
1/ 2013-14 Rate as a %
of Median Income 4-Year Regional
Colleges and Universities
2007-08 2008-09 2009-10 2010-11 2011-12 2012-13 2013-14 Households of
NORTH DAKOTA $4,648 $4,889 $5,073 $5,220 $5,432 $5,550 $5,707 10.2%
+(-) prev yr-$ $254 $241 $184 $147 $212 $118 $157
+(-) prev yr-% 5.8% 5.2% 3.8% 2.9% 4.1% 2.2% 2.8%
Colorado 3,364 3,738 4,116 4,598 5,310 6,084 6,670 11.6%
Iowa No Comparatives
Kansas No Comparatives
Minnesota No Comparatives
Missouri 5,028 5,188 5,188 5,188 5,729 5,998 6,110 12.3%
Montana 3,674 3,674 3,689 3,696 3,945 4,109 4,141 9.2%
Nebraska No Comparatives
Oklahoma No Comparatives
South Dakota 6,045 6,497 6,872 7,171 7,621 7,950 8,226 16.6%
Wisconsin
Wyoming
Regional Average $4,528 $4,774 $4,966 $5,163 $5,651 $6,035 $6,287 12.5%
+(-) prev yr-$ $101 $247 $192 $197 $488 $384 $252
+(-) prev yr-% 2.3% 5.4% 4.0% 4.0% 9.5% 6.8% 4.2%
1/ This column reflects tuition and fees as a % of 2012 median household income, which takes into account the income of multiple wage earner families, and is a reflection of a family’s ability to pay.
19
A Comparison of North Dakota and Regional Averages 2013-14 Resident Undergraduate Tuition and Mandatory Fees
1/ 2013-14 Rate as a %
of Median Income Two-Year Colleges 2007-08 2008-09 2009-10 2010-11 2011-12 2012-13 2013-14 Households of
NORTH DAKOTA $3,623 $3,779 $3,808 $3,833 $3,914 $3,977 $4,086 7.3%
+(-) prev yr-$ $181 $156 $29 $24 $81 $63 $109
+(-) prev yr-% 5.3% 4.3% 0.8% 0.6% 2.1% 1.6% 2.7%
Colorado 2,579 2,722 2,962 3,069 3,342 3,538
3,699 6.5%
Iowa 3,491 3,649 3,842 4,047 4,287 4,437
4,556 8.5%
Kansas 2,011 2,156 2,199 2,314 2,388 2,496
2,634 5.3%
Minnesota 4,444 4,565 4,697 4,984 5,171 5,355
5,370 8.7%
Missouri 3,375 3,529 3,521 3,504 3,507 4,068
4,225 8.5%
Montana 3,079 3,079 3,217 3,267 3,344 3,372
3,384 7.5%
Nebraska 2,160 2,225 2,320 2,441 2,567 2,690
2,753 5.3%
Oklahoma 2,479 2,684 2,706 2,841 3,025 3,178
3,337 6.9%
South Dakota No Comparatives
Wisconsin 4,520 4,555 4,567 4,577 4,832 5,086
5,103 9.6%
Wyoming 1,923 2,027 2,118 2,152 2,275 2,391
2,539 4.4%
Regional Average $3,006 $3,119 $3,215 $3,320 $3,474 $3,661 $3,760 7.1%
+(-) prev yr-$ $182 $113 $96 $105 $154 $187 $99
+(-) prev yr-% 6.5% 3.8% 3.1% 3.3% 4.6% 5.4% 2.7%
1/ This column reflects tuition and fees as a % of 2012 median household income, which takes into account the income of multiple wage earner families, and is a reflection of a family’s ability to pay.
SOURCE OF DATA (for Appendix 2)
2010-11 through 2013-14 - Tuition & Fees In Public Higher Education in the West, 2010-11 through 2013-14 Detailed Tuition & FeeTables (Colorado, Montana, South Dakota, Wyoming); Campus and/or Board of Regents websites (Iowa, Kansas, Minnesota, Missouri, Nebraska, Oklahoma and Wisconsin); 2010-11 through 2013-14 Institutional Charges Schedule (North Dakota)
2007-08 through 2009-10 - Washington State Higher Education Coordinating Board
Median Household Income - http://www.census.gov/hhes/www/income/data/historical/household/index.html