International Journal of Information Science and Management Vol. 12, No. 2, 2014, 1-17
Research Contributions in Malaysian Journal of Library and Information Science during 1996 - 2012
Kotti Thavamani Regional Medical Library,
The Tamil Nadu Dr. M. G. R Medical University, India [email protected]
Abstract
This article analyzed the various bibliometric components of the articles published in the Malaysian Journal of Library and Information Science from 1996 to 2012. Various quality aspects of the 279 articles published in the period were studied. The study demonstrates and elaborates on the various aspects of the journal, such as its distribution of article by year, authorship patterns, distribution of contributions by institution, subject distributions, citation patterns, length of article, and geographical distributions of authors. Analysis of data reveals that more number of research articles are published from Malaysia followed by India. Bibliometrics / Scientrometrics / Journal Studies and User Studies are leading subject areas have been carried out during this period. The highest number of contributions was published in the year of 2011. The maximum number of articles has been contributed by academic institutions. Citation analysis of 6779 citations includes finding out average number of citations per contribution. The average degree of author collaboration has been arrived at 0.645during the study period.
Keywords: bibliometrics, Malaysian Journal of Library and Information Science, publication analysis, authorship patterns, journal studies, MJLIS, degree of collaboration
Introduction
Bibliometrics is a set of methods to quantitatively analyze academic literature. Citation analysis and content analysis are commonly used bibliometric methods. While bibliometric methods are most often used in the field of library and information science, bibliometrics have wide applications in other areas. Many research fields use bibliometric methods to explore the impact of their field, the impact of a set of researchers, or the impact of a particular paper. The term bibliometrics was coined by Alan Pritchard in a paper published in 1969, titled “Statistical Bibliography or Bibliometrics”. He defined the term as "the application of mathematics and statistical methods to books and other media of communication".
work of Gross and Gross in 1927 in which they counted and analyzed the citations in articles from the Journal of the American Chemical Society and produced a list of journals deemed important to chemical education. Another prominent work was Bradford’s 1934 article on the distribution of literature in lubrication research. It is an important part of the theoretical foundation of bibliometrics, “Bradford’s Law of Scattering.”
In 1948, Ranganathan, father of library science, coined the term “librametry”, which historically appeared first and was intended to streamline the services of librarianship. Bibliometrics is analogous to Ranganathan’s librametrics, the Russian concept of Scientrometrics, Infometrics, and sub disciplines like Econometrics, Psychometrics, Sociometrics, Biometrics, Technometrics, Chemometrics, and Climetrics, where Mathematics and Statistics are applied to study and solve problems in their respective fields. Scientrometrics is now used for the application of quantitative methods to the history of science and overlaps with Bibliometrics to a considerable extent.
Malaysian Journal of Library and Information Science (MJLIS)
The Malaysian Journal of Library and Information Science is an international online journal. It is a scholarly journal in English devoted to the various fields of Library and Information Science that was first published bi-annually in 1996. The journal publishes original research articles in the field of Library and Information Science (LIS) as well related domains that encapsulate information and knowledge. It also encourages contribution about professional policies, practices, principles and progress in the LIS fields. The journal aims to provide a forum for communications amongst LIS professionals especially within the Asia Pacific region, to introduce new concepts, methodologies, systems and technology.
Literature Review
Karisiddappa, Maheswarappa, and Shirol (1990) studied the authorship pattern and collaborative research in psychology. Tiew, Abdullah, and Kaur (2002) analyzed citation patterns in the Malaysian Journal of Library and Information Science (MJLIS) from 2001-2006. Kamal Lochan (2006) traced and studied the trend of publications such as the year wise distribution of articles, bibliographical distribution of citations, authorship pattern, citation pattern, average length of articles, number of tables and figures used, time lag and geographical distribution of authors. Mahapatra and Padmanav (2006) studied, the growth of scientific research literature on Orissa published during 1985-2004. In this study, the authorship pattern, year wise growth, subject wise break up of papers, category of journals, place of origin, length of papers, and productivity of journals were evaluated. Verma, Tamrakar, and Sharma (2007) year wise, institutions wise, state wise distribution of contributions, authorship pattern, citation analysis, length of the contributions were found out in their research. Bakri and Willett (2008) studied the range of articles published per volume, average number of references per article, the average length per article pages, the percentage of multi-authored papers and geographically affiliation.
Kotti Thavamani 3
theses on zoology accepted for the award of the doctoral degree by Sri Venkateswara University, Tirupati, India. Zafrunnisha, and Pulla Reddy (2009) studied authorship pattern and collaborative research in the field of Psychology. Akhtar and Nishat (2011) studied the Chinese Librarianship: an International Electronic Journal for the period of 2006-2010. Warraich and Ahmad (2011) traces the author productivity, extent of authors’ collaboration, authors’ institutional affiliation, authors’ geographic affiliation, type of publication, language of papers, number of citations used per article, length of papers, and year-wise distribution of papers.
Pradhan, Panda, and Chandrakar (2011) studied the trends in authorship pattern and author’s collaborative research in Indian chemistry literature with a sample of 53,977 articles during the period 2000-2009. Neeraj Kumar, Jyoti, and Kaur (2011) analyzed the citation analysis of all the journal articles published in the Journal of Documentation from 1996-2010 and found that 487 articles are published in the journal during 15 years. Rattan and Gupta (2012) traced the author productivity, extent of authors’ collaboration, authors’ institutional affiliation, authors’ geographic affiliation, type of publication, language of papers, number of citations used per article, length of papers, and year-wise distribution of papers. Rashidi, Rahimi, and Delirrad (2013) also studied the productivity of Turkish and Iranian parasitologists’ papers, average number of citation per article, most cited journal in both countries, most cited references.
Amsaveni and Vasanthi (2013) traced the trend in authorship pattern and collaborative research in network security with a sample of 8051 articles during 2002 to 2011. Alimi, Taslimi, Ghodsi, and Rahimi‑Movaghar (2013) analyzed papers published by Iranian neurosurgeons and found a total of 1196 papers published by 422 Iranian neurosurgeons. Ramakrishnan and Thavamani (2013) studied the literature output in the field of Hepatitis C in the Journal of Gastroenterology between 2006-2010. Mousavi, Mansouri, and Ahmadvand (2013) assessed scientific output on rational use of drugs in Iran using a bibliometric analysis of publications. Thavamani and Velmurugan (2013) studied the publication trends of scholarly papers in Annals of Library and Information Studies published from New Delhi. The bibliometric analysis has been conducted with 310 contributions published in the journal during the year 2002 – 2012.
Objectives of the Study
The primary objective of this study is to understand the growth of Malaysian Journal of Library and Information Science and their research output in global during the period 1996 - 2012. More specific objectives are as follows:
To study growth of research articles by year and issue, To study authorship patterns,
To identify degree of author collaboration, To study authorship patterns by volume, To find out the contribution by subjects, To study contribution by institutions, To examine the average length of articles,
To study average number of citations per article, and
Methodology
The data was collected from the website (http://ejum.fsktm.um.edu.my) of the Malaysian Journal of Library and Information Science (MJLIS) that was first published bi-annually in 1996. It is currently publishing three times (2009 onwards) a year in April, August and December by the Department of Library and Information Science, University of Malaya. Thirty-eight issues from seventeen volumes from 1996 to 2012 have been selected for the study. The research article contributions by issue and year, number of authors, authorship patterns by volume, degree of author’s collaboration, contributions by subject, institution, global and citations per article are studied. Citations have been categorized as journal articles, books, web based sources and miscellaneous documents (dissertations, theses, technical manuals, abstracts, patents and personal communication includes monographs and conference proceedings, etc.) were recorded. These data were organized, calculated, tabulated, analyzed, and presented by using simple arithmetic and statistical methods. The study limited to 279 articles and 6779 citations published in last seventeen years and data were noted down for the study.
Data Analysis
Data on the bibliographic records were collected from the online version of Malaysian Journal of Library and Information Science pertaining to the period 1996-2012. A total of 279 articles bibliographic records were collected, which formed the source data for this study.
Table 1
Contribution of Research Articles by Year and Issue
Sl. No. Year Volume No. of Issues
No. of Contributions
Percentage
(%) Cumulative
Percentage (%)
1 1996 1 1 – 2 16 5.734 16 5.734
2 1997 2 1 – 2 16 5.734 32 11.469
3 1998 3 1 – 2 13 4.659 45 16.129
4 1999 4 1 – 2 15 5.376 60 21.505
5 2000 5 1 – 2 14 5.017 74 26.523
6 2001 6 1 – 2 14 5.017 88 31.541
7 2002 7 1 – 2 13 4.659 101 36.200
8 2003 8 1 – 2 16 5.734 117 41.935
9 2004 9 1 – 2 14 5.017 131 46.953
10 2005 10 1 – 2 14 5.017 145 51.971
11 2006 11 1 – 2 14 5.017 159 56.989
12 2007 12 1 – 2 14 5.017 173 62.007
13 2008 13 1 – 2 16 5.734 189 67.741
14 2009 14 1 – 3 18 6.451 207 74.193
15 2010 15 1 – 3 24 8.602 231 82.795
16 2011 16 1 – 3 28 10.035 259 92.831
17 2012 17 1 – 3 20 7.168 279 100.00
Kotti Thavamani 5
Figure 1. Contribution of research articles by year.
Table 1 and Figure 1 show the growth of research articles published in the Malaysian Journal of Library and Information Science journal from 1996 to 2012. Altogether, there are 279 research articles. The highest number of research articles 28(10.035%) was published in 2011 while the lowest number 13(4.659%) of research articles was published in the year of 2002 and 1998. The second highest number of articles 24(8.602%) was published in the year of 2010.
Table 2
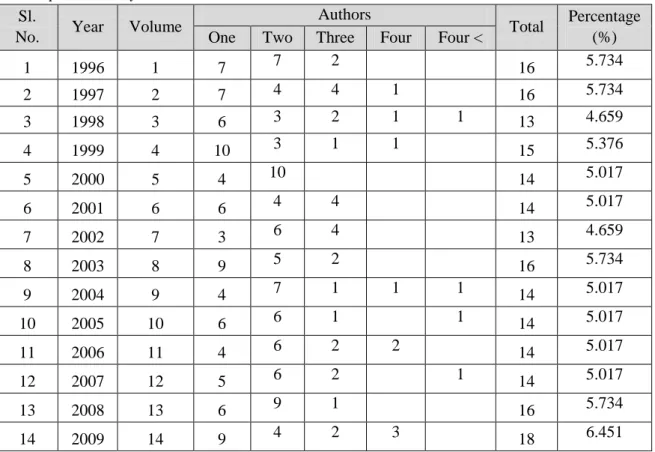
Authorship Patterns by Year/Volume Sl.
No. Year Volume
Authors
Total Percentage (%) One Two Three Four Four <
1 1996 1 7 7 2 16 5.734
2 1997 2 7 4 4 1 16 5.734
3 1998 3 6 3 2 1 1 13 4.659
4 1999 4 10 3 1 1 15 5.376
5 2000 5 4 10 14 5.017
6 2001 6 6 4 4 14 5.017
7 2002 7 3 6 4 13 4.659
8 2003 8 9 5 2 16 5.734
9 2004 9 4 7 1 1 1 14 5.017
10 2005 10 6 6 1 1 14 5.017
11 2006 11 4 6 2 2 14 5.017
12 2007 12 5 6 2 1 14 5.017
13 2008 13 6 9 1 16 5.734
Sl.
No. Year Volume
Authors
Total Percentage (%) One Two Three Four Four <
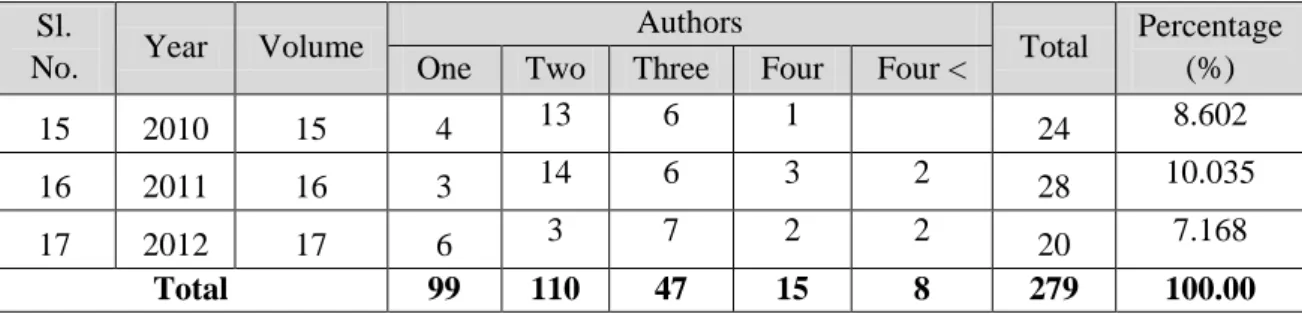
15 2010 15 4 13 6 1 24 8.602
16 2011 16 3 14 6 3 2 28 10.035
17 2012 17 6 3 7 2 2 20 7.168
Total 99 110 47 15 8 279 100.00
Table 2 show the distribution of research articles by year, volume and the authorship patterns of the journal from 1996 to 2012. It is clear that the number of research articles has been increased over the years. It indicates also that of 99 contributions of single authors, volume 4 has the highest number 10(10.10%) while volumes 7 and 16 have the lowest number 3(3.03%). Of the 110 research articles contributed by two authors, volume 16 has the highest number 14(12.72%) while volumes 3, 4 and 17 have the lowest number 3(3.30%). Of the 47 research articles contributed by three authors, volume 17 has the highest number 7 (14.89%) while volumes 4, 9, 10 and 13 have the lowest number 3(2.12%).
Table 3
Authorship Patterns
Sl. No. Author Total Percentage (%)
1 Single Author 99 35.483
2 Double Authors 110 39.426
3 Three Authors 47 16.845
4 Four Authors 15 5.376
5 Five Authors 3 1.075
6 Seven Authors 2 0.716
7 Eight Authors 1 0.358
8 Nine Authors 2 0.716
Kotti Thavamani 7
Figure 2. Authorship patterns of publications.
Table 3 and Figure 2 show that the majority of the research articles were written by double authors 110(39.426%), followed by single author 99(35.48%), three authors 47(16.845%), and four authors 15(5.376%). The lowest number of contributions was made by eight authors 1(0.358%).
Degree of Author Collaboration
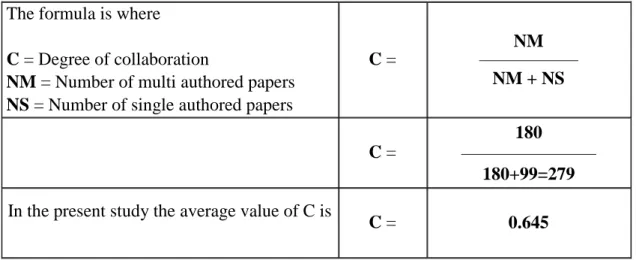
To determine the degree of author collaboration in quantitative terms, the formula given by Subramanyam (1983) was used:
The formula is where
C = Degree of collaboration
NM = Number of multi authored papers NS = Number of single authored papers
C =
NM –––––––––––
NM + NS
C =
180
––––––––––––––– 180+99=279
In the present study the average value of C is
C = 0.645
Table 4
Distributions by Subject
Sl. No. Subjects Total Percentage (%) Rank
1 Bibliometrics/ Scientrometrics/ Journal Studies 106 37.992 1
2 User Studies 27 9.318 2
3 Information Sources and Services 22 7.885 3
4 Digital Libraries 19 6.810 4
5 LIS Education 14 5.017 5
6 Academic Libraries 13 4.659 6
7 Internet Studies / Webology 11 3.942 7
8 Collection Development 10 3.584 8
9 Information Literacy 9 3.225 9
10 Cataloguing and Classification 6 2.150 10
11 Information Management 6 2.150 10
12 Information Professional and Librarians 6 2.150 10
13 Information Retrieval 6 2.150 10
14 Legal Issues in IS 6 2.150 10
15 School Libraries 6 2.150 10
16 Children Libraries 2 0.716 11
17 E-Commerce 2 0.716 11
18 Knowledge Management 2 0.716 11
19 Library Historiography 2 0.716 11
20 Public Libraries 2 0.716 11
21 Special Libraries 2 0.716 11
Kotti Thavamani 9
Figure 3. Distributions by subject.
Table 4 and Figure 3 show the distribution of subject areas of the articles. 106 articles (37.992%) were about Bibliometrics / Scientrometrics / Journal Studies. The least percentage 2 articles (0.716%) were about Children Libraries, E-Commerce, Knowledge Management, Library Historiography, Public Libraries and Special Libraries. The second highest percentage of study was done in the area of User Studies, i.e., 27(9.318%).
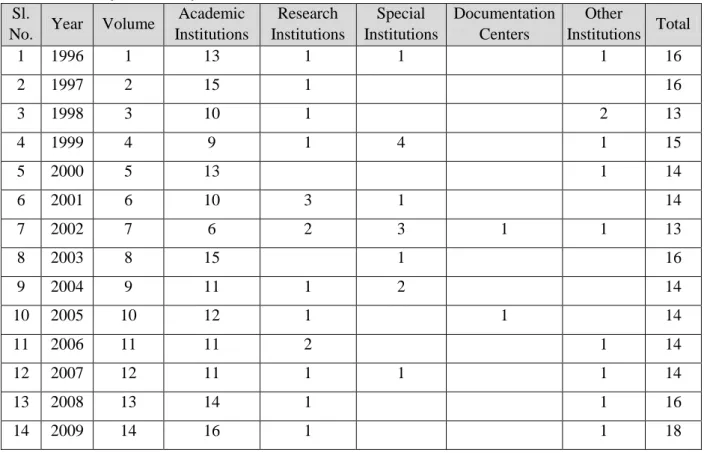
Table 5
Distribution of Articles by Institutions
Sl.
No. Year Volume
Academic Institutions
Research Institutions
Special Institutions
Documentation Centers
Other
Institutions Total
1 1996 1 13 1 1 1 16
2 1997 2 15 1 16
3 1998 3 10 1 2 13
4 1999 4 9 1 4 1 15
5 2000 5 13 1 14
6 2001 6 10 3 1 14
7 2002 7 6 2 3 1 1 13
8 2003 8 15 1 16
9 2004 9 11 1 2 14
10 2005 10 12 1 1 14
11 2006 11 11 2 1 14
12 2007 12 11 1 1 1 14
13 2008 13 14 1 1 16
Sl.
No. Year Volume
Academic Institutions
Research Institutions
Special Institutions
Documentation Centers
Other
Institutions Total
15 2010 15 19 1 2 2 24
16 2011 16 25 1 2 28
17 2012 17 16 2 1 1 20
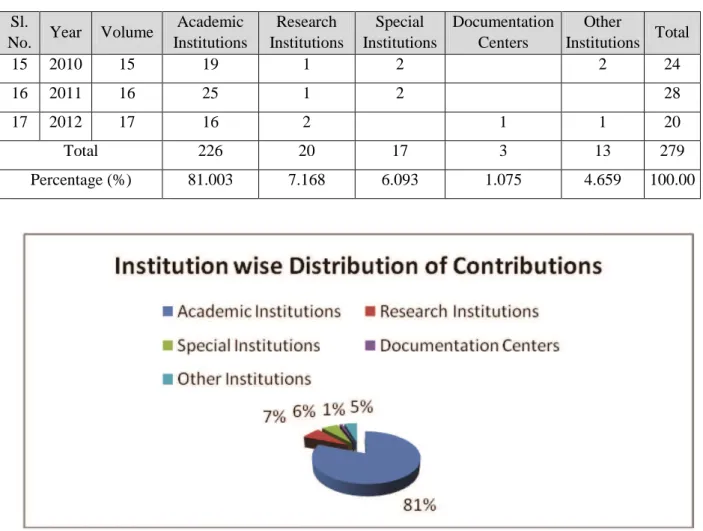
Total 226 20 17 3 13 279
Percentage (%) 81.003 7.168 6.093 1.075 4.659 100.00
Figure 4. Distributions of articles by institutions.
Table 5 and Figure 4 show the type of institutions with which the authors of the articles were affiliated. 226 articles (81.003%) were from authors affiliated to the academic institutions, followed by research institutions with 20(7.168%), special institutions 17(6.093%). The lowest number 3(1.075%) has been contributed by documentation centers.
Table 6
Distribution of Authors by Country
Sl. No. Global Total Percentage (%) Rank
1 Malaysia 128 45.878 1
2 India 50 17.921 2
3 Bangladesh 13 4.659 3
4 Iran 10 3.584 4
5 Nigeria 8 2.867 5
6 Singapore 8 2.867 5
7 Sri Lanka 8 2.867 5
8 Taiwan 8 2.867 5
9 Botswana 6 2.150 6
Kotti Thavamani 11
Sl. No. Global Total Percentage (%) Rank
13 Australia 4 1.433 8
14 Pakistan 3 1.075 9
15 UK 3 1.075 9
16 USA 3 1.075 9
17 Indonesia 2 0.716 10
18 Jordan 2 0.716 10
19 Belgium 1 0.358 11
20 Brunei 1 0.358 11
21 Kenya 1 0.358 11
22 New Zealand 1 0.358 11
23 South Korea 1 0.358 11
24 Spain 1 0.358 11
25 Sudan 1 0.358 11
26 Turkey 1 0.358 11
Total 279 100.00
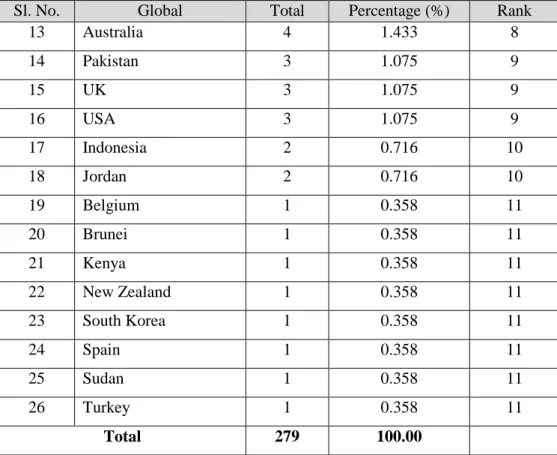
Table 6 and Figure 5 show the contribution of articles by country during the period under the study. Out of 279 articles, 128(45.878%) are from Malaysia, followed by India 50(17.921%), Bangladesh 13(4.659%), Iran 10(3.584%). Nigeria, Singapore, Sri Lanka, and Taiwan each 8(2.867%), by authors from China, Kuwait and Thailand each 5(1.792%), Australia 4(1.433%), Pakistan, UK and USA each 3(1.075%), and Indonesia and Jordan 2(0.716%). And least number 1(0.358%) have been contributed by authors from eight countries of Belgium, Brunei, Kenya, New Zealand, South Korea, Spain, Sudan, and Turkey.
Table 7
Length of Articles by Page
Sl. No. Length of Pages Total Percentage (%)
1 No Page 1 0.358
2 1 – 5 5 1.792
3 6 – 10 41 14.695
4 11 – 15 106 37.992
5 16 – 20 86 30.824
6 21 – 25 28 10.035
7 26 – 30 5 1.792
8 31 – 35 3 1.075
9 36 – 40 3 1.075
10 41 – 45 1 0.358
Total 279 100.00
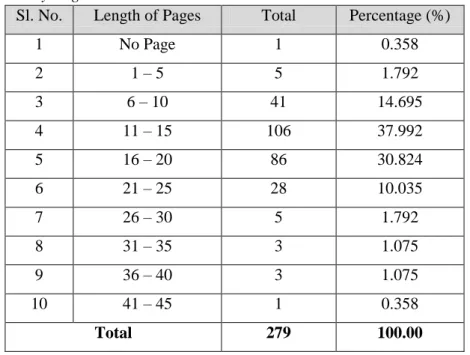
Table 7 show the length of articles by page in the period under study. One hundred and six articles (37.992%) are between 11 - 15 pages in length, 86 articles (30.824%) between 16 - 20 pages, 41 articles (14.695%) between 6 - 10 pages, 5 articles (1.792%) between 1 - 5 and 26 – 30 pages, and 1 article (0.358%) between 41 - 45 pages. Clearly, most articles 106 (37.992%) are between 11- 15 pages long. One contribution has no page number in 1997.
Table 8
Range of Citations per Article
Sl. No. No. of Citations Total Percentage (%)
1 Nil 2 0.716
2 1 – 10 72 25.806
3 11 – 20 84 30.107
4 21 – 30 61 21.863
5 31 – 40 27 9.677
Kotti Thavamani 13
Sl. No. No. of Citations Total Percentage (%)
9 71 – 80 2 0.716
10 81 – 90 3 1.075
11 91 – 100 3 1.075
12 191 – 200 1 0.358
13 201 – 210 1 0.358
14 211 – 220 1 0.358
Total 279 100.00
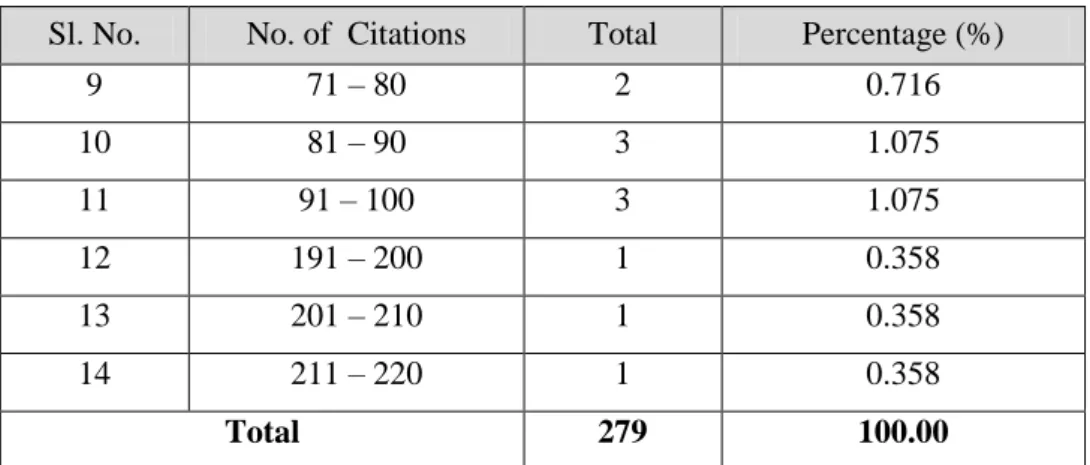
Table 8 show the range and percentage of citations per article. A total of 84 articles (30.10%) top the list with 11-20 citations, followed by 72 articles (25.80%) between 1-10, 61 articles (21.863%) with 21-30, and 27 articles (9.67%) with 31-40 citations. 11 articles (3.94%) with 41-50, 8 articles (2.86%) with 51-60, 3 articles (1.07%) with 61-71, 81-90 and 91-100 citations, 2 articles (0.71%) with 71-80, 1 article (0.35%) with 191-100, 201-210 and 211-220. Two (0.71%) articles have no citations.
Table 9
Distribution of Citations by Year Sl.
No. Year
No. of Contributions
No. of Citations Used
Percentage
(%) Cumulative
Percentage (%)
1 1996 16 177 2.611 177 2.611
2 1997 16 488 7.198 665 9.809
3 1998 13 180 2.655 845 12.464
4 1999 15 361 5.325 1206 17.790
5 2000 14 428 6.313 1634 24.103
6 2001 14 350 5.163 1984 29.266
7 2002 13 230 3.392 2214 32.659
8 2003 16 235 3.466 2449 36.126
9 2004 14 329 4.853 2778 40.979
10 2005 14 287 4.233 3065 45.213
11 2006 14 227 3.348 3292 48.561
12 2007 14 296 4.366 3588 52.928
13 2008 16 395 5.826 3983 58.754
14 2009 18 550 8.113 4533 66.868
15 2010 24 811 11.963 5344 78.831
16 2011 28 816 12.037 6160 90.868
17 2012 20 619 9.131 6779 100.00
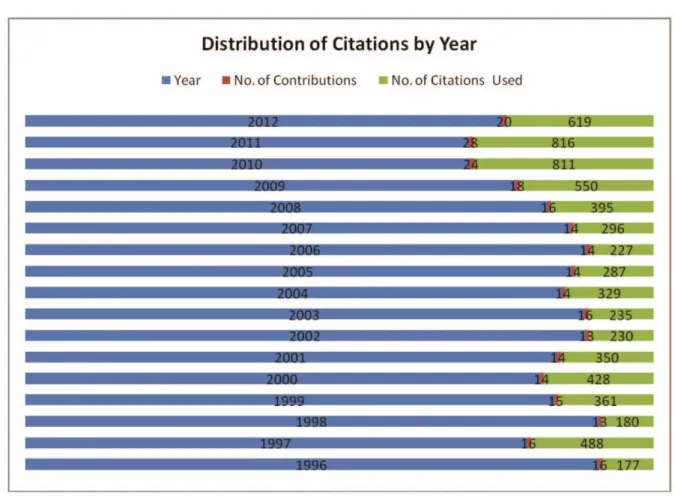
Figure 6. Citations by year.
Table 9 and Figure 6 present the distribution of citations per year. The 279 articles contained a total of 6779 citations and self-citations. The year 2011 has the most citations 816 (12.037%), followed by 811 (11.963%) in 2010. The year 1996 has the fewest citations 177 (2.611%).
Table 10
Sources of Citations Sl.
No. Source Total Percentage (%)
1 Journals 3844 56.704
2 Books 1324 19.530
3 Websites 804 11.860
4 Miscellaneous (seminars, conferences, proceedings and workshops, theses and dissertations, reports and newspaper / newsletters, etc.,)
807 11.904
Kotti Thavamani 15
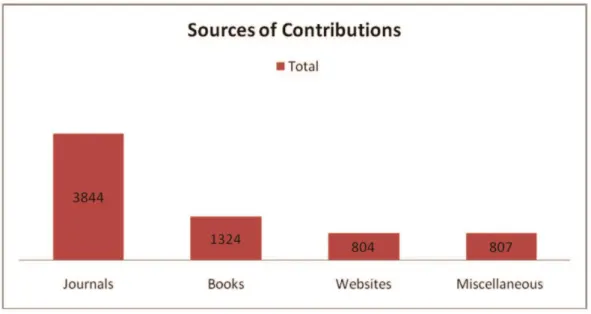
Figure 7. Sources of contributions.
Table 10 and Figure 7 show the majority of the authors preferred to use journal articles as the source of reference or citation, which accounts for a 3844 (56.704%) out of the total 6779 citations. The second highest used source is books with 1324 (19.530%) citations. It is followed by Online search/websites with 804 (11.860%) and miscellaneous (807) 11.904% are cited (seminars, conference, proceedings and workshops 356 (5.251%), theses and dissertations 171 (2.522%), reports 191 (2.817 %) and newspaper / newsletters 20 (0.295%)).
Findings
The present study has analyzed research contributions of the past seventeen years during 1996 - 2012.
The highest number of research articles 28(10.035%) was published in 2011. The second highest number of articles 24(8.602%) was published in the year of 2010.
The majority of the research articles were written by double authors 110(39.426%), followed by single author 99(35.48%).
The degree of author collaboration in the Malaysian Journal of Library and Information Science is 0.645 during the period under study. Therefore, the collaborative works are quite remarkably observed in the MJLIS.
Majority of 226 articles (81.003%) were from authors affiliated with academic institutions. This is followed by research institutions with 20(7.168%),
Maximum of 106 articles (37.992%) are about Bibliometrics / Scientrometrics / Journal Studies. The second highest percentage of study was done in the area of User Studies, i.e., 27(9.318%).
The highest number i.e., 128 (45.878%) has been contributed by authors from Malaya followed by India.
106 articles (37.992%) are between 11 - 15 pages in length, 86 articles (30.824%) between 16 - 20 pages.
The year 2011 has the most citations 816 (12.037%), followed by 811 (11.963%) which has the second most citations in 2010.
Majority of the authors preferred to use journal articles as the source of reference or citation, which accounts for a 3844 (56.704%) out of the total 6779 citations. The second highest used source is books with 1324 (19.530%) citations. It is followed by Online search/websites with 804 (11.860%).
Conclusion
The Malaysian Journal of Library and Information Science (MJLIS) have successfully completed 17 years of publication. It is an open access journal in the field of library and information science. It is getting world-wide popularity and identification by publishing scholarly articles from authors across the world. This Bibliometric research reveals a remarkable difference between the number of single author and multiple authors. It identifies the thrust areas of research in Library and Information Science; and also suggests the grey areas that require attention from LIS researchers. The study concludes that multiple-authorship research is predominant as compare to single contributions in case of Malaysian Journal of Library and Information Science. The collaboration and team work are among the most important necessities of scientific and technological work today.
References
Akhtar, H., & Nishat, F. (2011). A bibliometric analysis of the ‘Chinese Librarianship: An International Electronic Journal, (2006-2010). Chinese Librarianship: An International Electronic Journal. Retrieved from http://www.iclc.us/cliej/cl31HF.pdf.
Alimi, M., Taslimi, Sh., Ghodsi, M., & Rahimi‑Movaghar, V. (2013). Quality and quantity of research publications by Iranian neurosurgeons: Signs of scientific progress over the past decades. Surgical Neurology International, 4 (38).
Amsaveni, N., & Vasanthi, R. (2013). Authorship pattern and collaborative research in the field of network security. Indian Journal of Applied Research, 3(1), 52-54.
Assari, S., & Ahmadyar, M. (2009). Dental research in Iran: A bibliometric analysis of electronically available literature. Interrnational Dental Journal, 59(4), 210-214. Bakri, A., & Willett, P. (2008). The Malaysian Journal of Library and Information
Science-2006: A bibliometric study. Malaysian Journal of Library & Information Science, 13(1), 103-116.
Bardford, S.C. (1934). Source of information on specific subjects. Engineering, 26, 85-86. Gross, P.L.K., & Gross, F. M. (1927). College libraries and chemical education. Science, 66,
386-389.
Hulme, E. W. (1923). Statistical bibliography in relation to the growth of modern civilization. London: Grafton.
Kamal Lochan, J. (2006). A bibliometric analysis of the journal Indian Journal of Fibre and Textile Research, 1996-2004. Annals of Library and Information Studies, 53(1), 22-30. Karisiddappa, C. R., Maheswarappa. B.S., & Shirol, M. V. (1990). Authorship pattern and
Kotti Thavamani 17
Mousavi, S., Mansouri, A., & Ahmadvand, A. (2013). A bibliometric study of publication patterns in rational use of medicines in Iran. Pharmacy Practice, 11(1), 38-43.
Neeraj Kumar, S., Jyoti Sh., & Kaur, N. (2011). Citation analysis of Journal of Documentation. Webology, 8(1), Article 86. Retrieved from http://www.webology.org /2011/v8n1/a86.html.
Pitchard, A. (1969). Statistical bibliography or bibliometrics. Journal of Documentation, 25
(4), 348-349.
Pradhan, P., Panda, S., & Chandrakar. J. (2011). Authorship pattern and degree of collaboration in Indian chemistry literature. Presented at 8th International CALIBER - 2011, Goa University, Goa, March 02-04-2011.
Ramakrishnan, J., & Thavamani, K. (2013). Growth of literature in the field of Hepatitis-C.
Library philosophy and Practice, August 2013.
Ranganathan, S.R. (1969). Library and its scope. DRTC Annual Seminar, 702, 285-301. Rashidi, A., Rahimi, B., & Delirrad, M. (2013). Bibliometric analysis of parasitological
research in Iran and Turkey: A comparative study. Iran Journal of Parasitol, 8(2), 313– 322.
Rattan, G.K., & Gupta, K. (2012). Bibliometric analysis of Malaysian Journal of Library and Information Science: 2007-2011. International Journal of Information Dissemination and Technology, 2(4), 307-312.
Subramanian, K. (1983). Bibliometric studies of research collaboration: A review. Journal of Information Science, 6(1), 33-38.
Thavamani, K., & Velmurugan, C. (2013) Authorship pattern and collaborative research work in Annals of Library and Information Studies. Proceedings of the National Conference on Next Generation Library Services, SALIS 2013 – NGLIS August 16-17, 2013, Chennai. Tiew, W. S., Abdullah A., & Kaur K. (2002). Malaysian Journal of Library and Information
Science 1996-2000: A bibliometric study. Malaysian Journal of Library & Information Science, 6(2), 43-56.
Verma, N., Tamrakar, R., & Sharma, P. (2007). Analysis of contributions in 'Annals of Library and Information Studies'. Annals of Library and Information Studies, 54(2), 106-111.
Vimala, V., & Pulla Reddy, V. (2009). Authorship pattern and collaborative research in the field of Zoology. Malaysian Journal of Library & Information Science, 1(2), 43-50. Warraich, N. F., & Ahmad, S. (2011). Pakistan Journal of Library and Information Science:
A bibliometric analysis. Pakistan Journal of Library & Information Science, 12, 1-7. Zafrunnisha, N., & Pulla Reddy, V. (2009) Authorship pattern and degree of collaboration in