in Postal Service
Siti Rapidah Omar Ali1*, Siti Naemah Abd Hakim Amir2
1,2
Faculty of Business and Management, Universiti Teknologi MARA Cawangan Terengganu, Kampus Dungun, 23000 Dungun, Terengganu, Malaysia
Authors’ Email Address: *[email protected]
Received Date: 26 April 2020 Accepted Date: 13 May 2020 Published Date: 31 July 2020
ABSTRACT
Providing great quality services is essential for a sustainable competitive advantage in today’s aggressive business environment. An organisation’s success could be positively influenced by customer satisfaction. This study has attempted to examine the relationship between service-quality elements towards customer satisfaction. The modified SERVQUAL model by Parasuraman et al. has been used to measure four service-quality dimensions. Quantitative method is used for data collection in this research. A set of a self-administered questionnaire focused on customers of Pos Malaysia Centre in Kuala Terengganu was distributed and has collected a convenience sample of 322 Pos Malaysia customers. Pearson’s correlation analysis has revealed that all the four service-quality elements are positively associated with customer satisfaction with a moderate correlation. All the hypotheses of the study are also supported. Responsiveness and reliability have been discovered to influence customer satisfaction most compared to the other elements. Therefore, these findings have suggested that service industries, particularly postal services, should cultivate the key service-quality elements thoroughly in order to enhance customer satisfaction without overlooking the remaining dimensions.
Keywords: Service quality, customer satisfaction, SERVQUAL, postal
INTRODUCTION
The most significant aspect in the business world whether it is intended for products or services is customer satisfaction. Customer views are perceived as service delivery that aids as a standard against which a performance is judged (Veronica, Jacqueline, & Mellisa, 2015). They contribute to a better success, lower costs, and customer trustworthiness. Measuring service quality, as seen from the customers’ eyes, is complex (Arora & Arora, 2015). The ability of the service industry to influence aggressive improvement can be realised from better service quality. Service quality is in fact a quality of service when customers, users, or clients measure alongside their expectancies before purchasing products or services (Kant & Jaiswl, 2017).
customers’ trust and be able to last, service quality is a need in every establishment. Customers’ lifestyles and consumption forms support companies to deliver better service quality. Apart from that, service quality also emphasises efforts to satisfy customers’ needs and the precision of delivery to balance customer expectation (Ali & Raza, 2015).
Postal service or the logistic service industry is also expected to provide valuable service quality to its customers. In providing high-quality services to customers, like other business trades, this industry also faces challenges. It is important to consider that service quality and customer satisfaction are closely linked. Organisations that offer a higher level of service quality will receive higher customer satisfaction (Jayaraman, Shankar, & Hor, 2011). Customers is the most important asset and if service quality is taken as an essential part of an organisation, customer satisfaction can be maintained (Naem, Adeel, Hammad, Wasim, & Tayyaba, 2016). Thus, giving the attention to existing customers is more profitable and covers least costs than attracting new customers. Customers’ positive words to their relatives, friends, and family may influence customers buying products and services constantly as well as delivering good recommendations for the future enhancement of a company. In contrast, disappointed customers possibly change to other service providers or criticise if their services are lower than the customers’ expectations.
LITERATURE REVIEW
Service quality
The
service industry determines service quality as perceived by the ‘eyes’ of customers, which is complicated (Arora & Arora, 2015). Capability in giving better service quality can aid service trades to achieve aggressive improvement. Basically, customers’ expectations of a service and how they perceive the performance of it is unalike with service quality. The idea of service quality remains a significant research area in marketing since it delivers valuable understandings on how customers’ perceptions of services are (Joshi & Chadha, 2016; Kiumarsi, 2015).As stated by Kumar (2018), delivering services is a continuous method of communication between services providers and their customers. Offering premium service quality in the service industry has been claimed to be crucial to gain a competitive advantage (Muala, 2016). Muala (2016) and Ngo and Nguyen (2016) have argued that customers’ happiness is completely reliant on their observations and views concerning service quality after undergoing it. As mentioned by Kant and Jaiswal (2017) and Kumar (2018), there is a considerable relationship between customer satisfaction and service quality. The most common model used for determining service quality and customer satisfaction in service industries is SERVQUAL (Roslan et al., 2015; Gencer & Akkucuk, 2017). The model has been much widely used than other models since it is consistent, valid, and extensively applicable within service-sector organisations (Munusamy et al., 2010; Gencer & Akkucuk, 2017).
Reliability
Responsiveness
Responsiveness includes services timeliness. Apart from that, responsiveness is also associated with considerate customers’ wants, needs, and desires, staff consideration to customers, suitable operating hours, attending and solving customers’ problems appropriately, as well as security and ease of transactions (Izogo & Ogba, 2015). Responsiveness is considered as the willingness of service providers in providing assistance. It comprises the ease of managements (El Saghier & Nathan, 2013). Additionally, it embraces seeing requests and needs of customers, useful working hours, remarkable consideration given by staff, and customers’ well-being. Alnsour et al. (2014) have revealed in their previous study that responsiveness displays an important relationship with customer satisfaction.
Empathy
Empathy concerns about customer attention, wants, and problems, as well as efficiently tackling their desires, lesioning to the problems appropriately, caring, and resolving them (Izogo & Ogba, 2015). Rishi, Deepak, and Suyash (2017) have suggested that empathy embraces giving customers outstanding services, recognises the customers’ preferences, and provides ease of doing-business hours. In addition, Alnsour et al. (2014) have stated that empathy is found to have a connection with customer satisfaction.
Assurance
Safety and guarantee by service providers can be defined as assurance. Kindness, validity, security, and capability are also included as the elements in assurance. The crucial aspects about assurance when customers receive services are knowledge and politeness of employees. Besides, the capability of employees to form confidence and trust in customers also matters (Izogo & Ogba, 2015).
Customer Satisfaction
Customer satisfaction is defined as a customer’s pleasure or dissatisfaction which is created after the evaluation of a perceived service-quality performance and actual service delivered (Kotler et al., 2017). This assessment is also created based on a customers’ pre-purchase comparison and expectation towards a real service carried out (Rao & Sahu, 2013). Hence, when a service offered fulfils a customer’s need, satisfaction is formed, whereas disappointment is resulted from the failure of a service provider’s performance versus customer expectation (Kim-Soon et al., 2014).
THEORETICAL FRAMEWORK
Independent Variables Dependent Variable
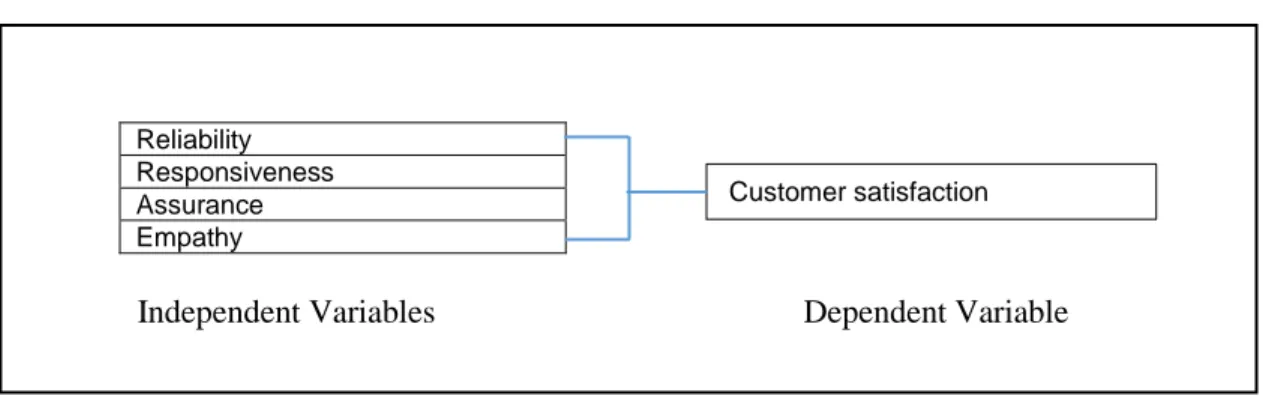
Figure 1: The theoretical framework of the SERVQUAL model and customer satisfaction
Figure 1 shows the proposed framework modified from the Parasuraman et al. (1991). The purpose of this study is to examine the influence of service quality elements, which are reliability, responsiveness, assurance, and empathy, towards customer satisfaction. Four hypotheses which have been established to be tested are as follows:
H1: Reliability positively influences customer satisfaction. H2: Responsiveness positively influences customer satisfaction. H3: Empathy positively influences customer satisfaction. H4: Assurance positively influences customer satisfaction.
METHODOLOGY
Items and Dimension
A self-administered questionnaire is the instrument for this study. The questionnaire is employed by using the modified SERVQUAL (Parasuraman et al., 1991) model version that has been reduced into four dimensions, which are reliability, responsiveness, empathy, and assurance. The questionnaire consists of six sections. Section A consists of questions concerning the demographic background of the respondents. Sections B until E require the respondents to answer the questions regarding service-quality elements, namely reliability, responsiveness, empathy, and assurance respectively. The last section of the questionnaire concerns about customer satisfaction.
Population and sampling
This study used the convenient sampling technique. Customers who are currently living in Kuala Terengganu and have experienced using various services at Pos Malaysia Centre Kuala Terengganu were the respondents of this study. The target customers of Pos Malaysia Centre Kuala Terengganu have been projected to be almost 2,000 individuals per month. Hence, the sample of 360 customers has been chosen from the 2,000 population by using the Krejcie and Morgan sample size determination (1970).
Reliability Responsiveness Assurance Empathy
FINDINGS
Demographic
Out of 360 questionnaires distributed, 322 sets were returned, which is equal to 89.44%, and the response rate is considered very good. More than half of the respondents (65.2%) are female while the rest are male. The majority of the respondents are Malay. In terms of marital status, 53.8% of the respondents are single whereas 42.5% are married. The highest age group of the respondents ranges from 21-29 years old. 33.2% of the respondents are self-employed, while others are students, officers, and people doing other occupations. 54.3% of the respondents use services at Pos Malaysia Centre Kuala Terengganu 1-2 times per month, followed by 24.5% of them who frequently use its services 3-6 times per month.
Reliability
The Cronbach’s alpha coefficient was applied to compute the result in order to establish the extent to which the contents of the questionnaires had been reliable in producing correct responses.
Table 1: Reliability Analysis
Section No. of Item Alpha Value
B (A. Reliability) 5 0.892
B (B. Responsiveness) 5 0.892
C (A. Empathy) 5 0.878
C (B. Assurance) 5 0.890
D (Customer Satisfaction) 5 0.890
The table above indicates the Cronbach’s Alpha reliability for all the variables. The result shows that the values are all above 0.6. Sekaran (2016) has stated that reliabilities of less than 0.6 are considered to be poor, 0.7 are acceptable, and above 0.8 are good. Thus, the reliability of the variables used in this is consistent and reliable since all the values are higher than 0.70 (Wulan & Husaeni, 2015).
Correlation Analysis
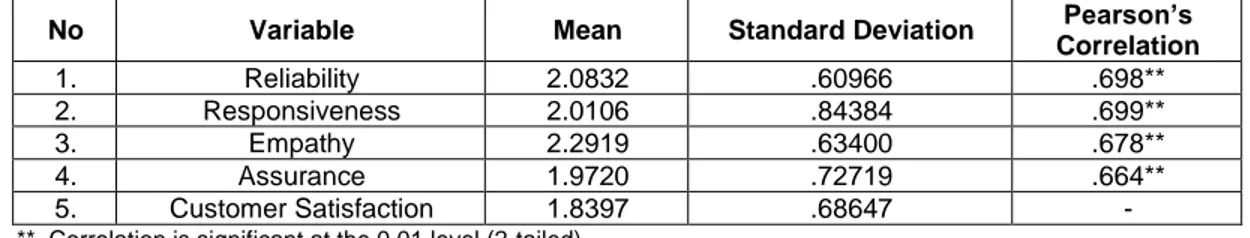
Table 2: Correlation Analysis (n=322)
No Variable Mean Standard Deviation Pearson’s
Correlation
1. Reliability 2.0832 .60966 .698**
2. Responsiveness 2.0106 .84384 .699**
3. Empathy 2.2919 .63400 .678**
4. Assurance 1.9720 .72719 .664**
5. Customer Satisfaction 1.8397 .68647 -
**. Correlation is significant at the 0.01 level (2-tailed)
Table 3: Guilford’s Rule of Thumb
R Strength of Relationship
<0.20 Almost negotiable relationship
0.20 – 0.40 Low correlation; definite but small relationship 0.40 – 0.70 Moderate correlation; substantial relationship
0.70 – 0.90 High correlation; marked relationship
According to the Guilford’s rule of thumb, the relationship between reliability, responsiveness, empathy, and assurance towards customer satisfaction represents a moderate, significant relationship.
Regression Analysis
Regression analysis is a modelling technique used to investigate a relationship between independent variables and a dependent variable. The percentage of the dependent variable enlightened by the independent variables can be measured by the regression analysis.
Table 4: Model Summary
R R Square Adjusted R Square Std. Error of the Estimate
.794a .631 .626 .51584
The influence of the four variables, namely reliability, responsiveness, empathy, and assurance, were tested by using regression. The percentage of variance in the dependent variable (customer satisfaction), which is explained by the variation in the independent variables, is described by the R square. Thus, it was found that 63.1% of the variance in customer satisfaction can be influenced by reliability, responsiveness, empathy, and assurance. In the meantime, the remaining 36.9% of the model was not enlightened by the independent variables in this study.
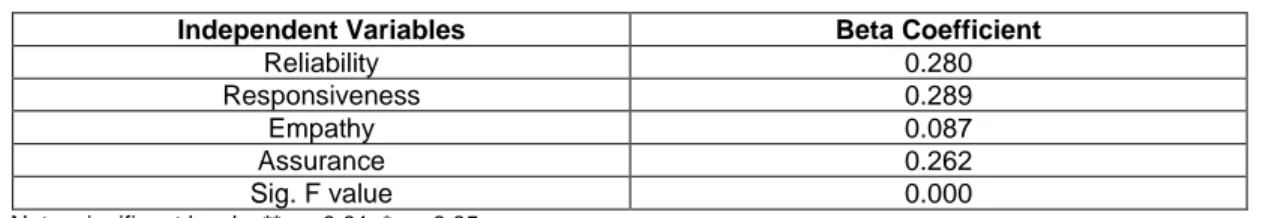
Table 5: Coefficient
Independent Variables Beta Coefficient
Reliability 0.280
Responsiveness 0.289
Empathy 0.087
Assurance 0.262
Sig. F value 0.000
Note: significant levels: **p < 0.01, *p < 0.05
DISCUSSION
This study has led the researcher to observe the relationship between service quality and customer satisfaction while using services at Pos Malaysia Centre Kuala Terengganu. The Pearson’s correlation results demonstrate that all service-quality aspects are positively correlated with customer satisfaction. The findings are supported by previous studies that have specified that all the elements on service quality have a substantially positive effect on customer satisfaction even though not all the elements give an equal impact on it (Tan & Maran, 2014).
Apart from that, the regression analysis has revealed that among the other service-quality determinants, responsiveness greatly influences customer satisfaction. Usually, customers prefer a welcoming atmosphere in which service providers are keen to assist their customers during the service process. In the interim, readiness to help customers is expected to develop positive satisfaction of customers. Furthermore, paying attention to the other elements of service quality, for instance, reliability, assurance, and empathy, is also important for the management to consider since the level of customer satisfaction is also contributed by these factors.
CONCLUSION AND RECOMMENDATION
The aspects of service quality are crucial in today’s competitive market. The ‘wow’ factor that customers experience is equally imperative to service providers in delivering their superior services. This study has discovered that all four SERVQUAL dimensions have positive and significant relationship with customer satisfaction. This has suggested that service quality leads to customer satisfaction. The most influential factor of service quality is responsiveness. This finding is also supported by previous scholars, as well as other researches literature, on service quality. It can be recommended that the management of service providers should improve their promised effective services. Emphasis needs to be given to a timely manner service to customers. Meanwhile, the rapid of exchange and performance is the greatest thing impacting customer satisfaction (Janahi & Almubarak, 2017). Since the most significant factor contributing to customer satisfaction is responsiveness, any actions concentrating on refining staff’s problem-solving skills should be taken into consideration by the management team in order to build customers’ trust while delivering prompt services without problems and mistakes. Anticipating customers’ needs, understanding, and listening to them will lead to their satisfaction.
REFERENCES
Ali & Raza (2015). Analyzing the effect of service quality on customer satisfaction of Islamic banking in west Java province, Indonesia; Management Science Letters 9 ;2347–2356.
Arora & Arora (2015). The Impact of Service Quality in Postal Services: The Mediating Role of Self-Service Technology; Int. J. Self-Services and Operations Management, Vol. 33, No. 3, 2019.
Arsanam, P., & Yousapronpaiboon, K. (2014). The relationship between service quality
and customer satisfaction of pharmacy departments in public hospitals. International Journal of Innovation, Management and Technology, 5(4), 261.
Dahari, Abduh, & Fam, (2015); Analyzing the effect of service quality on customer satisfaction of Islamic banking in west Java province, Indonesia; Management Science Letters 9 ;2347–2356.
El Saghier, N., & Nathan, D. (2013, April). Service quality dimensions and customers’ satisfactions of banks in Egypt. In Proceedings of 20th International Business Research Conference (Vol. 13 Gencer, Y.G. & Akkucuk, U. (2017). Measuring Quality in Automobile Aftersales: AutoSERVQUAL Scal.
Izogo, E. E., & Ogba, I. E. (2015). Service quality, customer satisfaction and loyalty in automobile repair services sector. International Journal of Quality & Reliability Management, 32(3), 250-269.
Janahi, M.A. & Al-Mubarak, M.M.S. (2017). "The impact of customer service quality on customer satisfaction in Islamic banking", Journal of Islamic Marketing, Vol. 8 Issue: 4, pp. 595-604, https://doi.org/10.1108/JIMA-07-2015-0049.
Jayaraman, M., Shankar, C. & Hor, W.M. (2011)., " Service Quality Delivery and Its Impact on Customer Satisfaction in the Banking Sector in Malaysia," International Journal of Innovation, Management and Technology vol. 1, no. 4, pp. 398-404.
Joshi, P. & Chadha, S.K. (2016). ‘Measuring service quality perception of students in business schools’, International Journal of Services and Operations Management, Vol. 25, No. 4, pp.479–507.
Kant & Jaiswal (2017). The Impact of Umrah Service Quality on Customer Satisfaction Towards Umrah Travel Agents in Malaysia; Management Science Letters 9 ;1763–1772.
Khan, M.M. & Fasih, M., 2014. Impact of Service Quality on Customer Satisfaction and Customer Loyalty: Evidence from Banking Sector. Pakistan Journal of Commerce and Social Sciences, 8(2), pp.331- 354.
Kim-Soon. N., Ahmad. A.R. & Visvalingam, L. (2014). SERVQUAL: Can It Be Used to Differentiate Guest’s Perception of Service Quality of 3 Star from a 4 Star Hotel. International Business Research; 7 (7). doi:10.5539/ibr.v7n7p37.
Kotler, P., & Keller, K. (2017). How to Improve Perceived Service Quality by Increasing Customer Participation. Marketing management (14th ed.). Prentice Hall, pp 483-487.
Krejcie, R.V., & Morgan, D.W., (1970). Determining Sample Size for Research Activities. Educational and Psychological Measurement.
Kumar, A. (2018). Effect of service quality on customer loyalty and the mediating role of customer satisfaction: an empirical investigation for the telecom service industry. Journal of Management Research and Analysis, 4(4), 159-166.
Muala, A. A. (2016). The effect of service quality dimensions on customers' loyalty through customer satisfaction in Jordanian Islamic Bank. International Journal of Marketing Studies, 8(6), 141-146. Naeem, A., Adeel, A., Hammad, A., Wasim A. & Tayyaba, N. A. (2016). Impact of Service Quality on
Customer Satisfaction: A Case of National Bank of Pakistan, International Review of Management and Business Research, 5(2); 536 – 546.
Ngo, M. V. & Nguyen, H. H. (2016). The relationship between service quality, customer satisfaction and customer loyalty: An Investigation in Vietnamese Retail Banking Sector. Journal of Competitiveness, 8(2), 103–16.
Pallant, J. (2011). SPSS survival manual: A step by step guide to data analysis using the SPSS program. 4th Edition, Allen & Unwin, Berkshire.
Parasuraman, A., Zeithaml, V.A. & Berry, L.L. (1991), "Refinement and reassessment of the SERVQUAL scale|", Journal of Retailing, Vol. 67, pp. 420-450.
Rao, P.S. & Sahu, P.C. (2013). Impact of Service Quality on Customer Satisfaction in Hotel Industry. Journal of Humanities and Social Science (IOSR-JHSS), 18 (5) pp. 39-44.
Rishi, K. Deepak, J. & Suyash, M. (2017). The Investigation of Service Quality Dimensions, Customer Satisfaction and Corporate Image in Indian Public Sector Banks: An Application of Structural Equation Model (SEM). Journal of Business Perspective. 21 (1) 76-85.
Roslan, A., Abdullah, N.H. & Wahab, E. (2015). Service Quality: A Case Study of Logistics Sector in Iskandar Malaysia Using SERVQUAL Model. Procedia - Social and Behavioral Sciences 172, 457 – 462.
S. Alnsour, M, Tayeh, B.A. & Alzyadat M.A. (2014). Using SERVQUAL to assess the quality of service provided by Jordanian telecommunications Sector. International Journal of Commerce and Management 24(3):209-218. DOI: 10.1108/IJCoMA-03-2012-0021.
252-Tan, L. H. & Maran, M (2014). Relationship Between Service Quality and Customer Satisfaction: A Study of Malaysian Banking Industry, Journal of Technology Management and Technopreneurship, ISSN: 2231-7996, Vol. 2, No. 2.
Veronica, J. & Melissa, R. (2015). Customer Satisfaction on Service Quality of Bus Transport: A Survey of Passengers from Phnom Penh to Poipet in Cambodia; Journal of Social Science Studies ISSN 2329-9150 2018, Vol. 5, No. 2.