207
The Evaluation of Fresh Cheese with Basil Addition
Adriana Pavelková
1, Alena Janigová
1, Jana Tkáčová
11
Slovak University of Agriculture in Nitra, Department of evaluation and processing of animal products, Tr. A. Hlinku 2, 949 76 Nitra, Slovakia
Abstract
The aim of the study was to assess the chemical and sensory characteristics of fresh cheese with the addition of basil. The basil was added in the form of hydrosol (H1 - 1.0 mL; H2 - 1.25 mL; H3 - 1.50 mL; H4 - 1.75 ml to 1 L of milk). The samples of produced fresh cheeses were evaluated sensory by Time-Intensity method and chemically (fat content, dry matter, titrable acidity) after 24 hours and vacuum-packed samples of cheeses were evaluated after 7 days storage under refrigeration. From the obtained chemical results we can state that in the case using of hydrosol was increased dry matter after 7 days of storage, the average 4.25 %. Content of acid substances was also increased, from 22.5 °SH to 30.5 °SH. Content of fat was ranged from 3.5 g.100 g-1 (H2) to 6.0 g.100 g-1 (H1) after 24 hours and from 6.0 g.100 g-1 (H4) to 7.3 g.100 g-1 (H3) after 7 days in samples with the addition of hydrosol. From the obtained sensory results we can conclude that from samples of fresh cheese with the addition of basil hydrosol were best evaluated samples H3 (the addition of 1.5 mL hydrosol to 1 L of milk) after 24 hours and 7 days of storage and the weakest intensity was observed in sample H4 (the addition 1.75 mL to 1 L of milk). We can state, that using basil in form as hydrosol can be good alternative for increasing consumption of fresh cheese.
Keywords: basil, fresh cheese, quality of cheese, sensory analysis, Time-Intensity.
1. Introduction
Milk and dairy products are recognized as an almost complete food product in the human diet because it provides all macronutrients (such as proteins, lipids and carbohydrates) and all micronutrients (elements, vitamins and enzymes) [1, 2]. [3] reported that consumers prefer cow's milk and products. One option to increase consumption of milk by dairy products could be used as spices in cheese. Spices, especially its essential oils, are rich in phenolic compounds such as flavonoids and phenolic acids, which exhibit a wide range of biological effects including antioxidant and anti-microbial properties [4-8]. Essential oils (EOs) are aromatic oily liquids obtained from plants or spices (flowers, buds, seeds, leaves, twigs, bark, herbs, wood, fruits and roots) are rich sources of biologically active
* Corresponding author: Adriana Pavelková,
adriana.pavelkova@uniag.sk
compounds such as terpenoids and phenolic acids.
They can be obtained by expression, fermentation, effleurage or extraction but the method of steam distillation is most commonly used for commercial production of EOs [9-11].
Basil (Ocimum basilicum L.) a member of genus Ocimum is an ornamental, culinary, and medicinal herb that is cultivated worldwide and flourishes under a variety of growing conditions [12]. Basil is a rich source of phenolic compounds such as phenolic acids – rosmarinic, chicoric, caffeic, and caftaric acids – are found in high concentrations in numerous cultivars [13-15] and strongly contribute to the herb’s known antioxidant properties [16-18].
208 The time–intensity technique measures the sensory perception of a specific attribute's intensity, and enables the monitoring of perceptual intensity changes during product evaluation [20-23]. Although these changes are often relatively slowly changing sensations, the temporal dimension may be less obvious, and T–I measurement can provide useful information beyond that found using a conventional, ‘static’, sensory method [24].
Recently, the time–intensity analysis has been widely used in studies to determine the behavior of sweeteners [25-27], in studies concerning beverages [28] chewing gum [29], meat product [30,31], salad dressing [32] and in the study of dairy products [33-36].
The aim of the present work was to assess the chemical and sensory characteristics of fresh cheese with the addition of basil in form hydrosol and dry basil.
2. Materials and methods
Cheese preparation
The samples of fresh cheese were made and assessed in Department of Evaluation and Processing of Animal Products, Slovak University of Agriculture in Nitra. Half-fat milk with fat content of 1.5 % obtained from trade network was used for cheese production. Production of cheese samples was carried out in parallel with the conventional method using calcium chloride (2 ml of 40% solution per 1 L of milk; Reachem, Slovak Republic) and rennet (Milase, CSK, Food Enrichment, The Netherlands) in the doses resulted in coagulation of milk during five hours at 31°C. The basil, which was purchased in the commercial network, was added before renneting. The samples of cheese were obtained as follows:
o sample C – control sample without basil hydrosol;
o sample H1 - addition of 1 mL of basil in the form hydrosol to 1 L of milk;
o sample H2 – addition of 1.25 mL of basil in the form hydrosol to 1 L of milk;
o sample H3 – addition of 1.50 mL of basil in the form hydrosol to 1 L of milk;
o sample H4 – addition of 1.75 mL of basil in the form hydrosol to 1 L of milk.
Basil hydrosol was obtained after 24 hours swelling of 15 g dried crushed basil in 200 mL of distilled water at ambient temperature by distilling.
After, coagulation, cutting, heating up and drying of curd were followed, respectively. Subsequently, cheese samples (5 pcs per each group) were evaluated after 24 hours after production and 7 days of vacuum-wrapped storage at 4°C.
Chemical analysis
Followed chemical properties of these three cheese samples: titratable acidity, fat content and dry matter content were analysed. The analyses were performed according to STN 57 0107 (2001). Titrable acidity (°SH) was determined by Soxhlet-Henkel, fat content (g.100g-1; wt%) was determined by acidobutyrometric (operating) method according to van Gulik and dry matter (%) determination was made by infrared lamp ULTRA X.
Statistical analysis
Results of the experiment were evaluated by statistical program SAS 9.3 with using application Enterprise Guide 4.2 [44]. The variation-statistical values (mean, standard deviation) were calculated and to determine the significant difference between groups was used variance analyse by Wilcoxon test (P<0.05).
3. Results and discussion
Content of fat, titrable acid and dry content of cheese with addition of hydrosol and dry crushed basil after 24 hour and 7 days of vacuum-wrapped storage at 4°C are presented in Tables1-3.
209
Table 1. Fat content of cheese (g.100g-1) (mean ±SD)
n=5 Control H1 H2 H3 H4
24 hours 4.3±0.414a 6.0±0.403b 3.5±0.271c 5.0±0.412a 4.5±0.311a 7 days 7.0±0.296a 6.3±0.235b 6.5±0.335ab 7.3±0.432a 6.0±0.632b
Wilcoxon test (P<0.05) + - + + +
Legend: mean value in the same lines with different superscripts (a, b, c) are significantly different at P<0.05 level
Table 2. Titrable acid of cheese (°SH) (mean ±SD)
n=5 Control H1 H2 H3 H4
24 hours 21±3.480ab 24±3.393a 22±1.512a 26±2.211a 18±1.646b 7 days 28±1.161a 32±1.660b 28±0.856a 32±2.117b 30±1.944ab
Wilcoxon test (P<0.05) + + + + +
Legend: mean value in the same lines with different superscripts (a, b) are significantly different at P<0.05 level
Table 3. Dry matter of cheese (%) (mean ±SD)
n=5 Control H1 H2 H3 H4
24 hours 29±1.149a 34±1.701b 29±1.529a 29±2.737a 20±2.655c 7 days 28±1.692ad 34±1.924b 31±1.412ab 37±0.944c 26±2.438d
Wilcoxon test (P<0.05) - - - + +
Legend: mean value in the same lines with different superscripts (a, b, c, d) are significantly different at P<0.05 level
In the case of titrable acid evaluation was measured the lowest value in samples of cheese with addition of 1.75 mL of basil hydrosol H4 (18 °SH) and the highest value in sample H3 (26 °SH) after 24 hours from production. After 7 days of vacuum storage was measured the highest value in samples H1 and H3 (32 °SH) and the lowest value in samples K and H2 (28 °SH). The average of titrable acid in samples of cheese with addition of basil hydrosol was 30.5 °SH after 7 days from production and 22.5 °SH after 24 hours.
The lowest value of dry matter after 24 hours from production was measured in sample H4 (20 %) and the highest value was in sample H1 (34 %). After 7 days from production was the highest value measured in samples H3 (37%) and the lowest in samples H4 (26 %). The average value of dry matter in samples of cheese with addition of basil hydrosol after 24 hours was 28 % and after 7 days vacuum storage was 32.25 %.
Statistical significant differences of fat, titrable acid and dry matter between dates of storage within testing group and between testing groups after 24 hours and 7 days of storage are showed in table 1-3.
Direct integration of essential plant oils in foods may result in reduction of microbial count, but may be affected by the sensory quality of the food. The evaluation of the temporality of the sensory perception in food products is mainly assessed using the time–intensity (TI) methodology. This
approach is useful for studying the temporal aspects of the perception of a given sensory attribute in a product. The evolution of sensations in sensory analysis of food products is increasingly studied. To obtain such temporal information, the most often used method is time– intensity (TI) which consists in recording the evolution of the intensity of a given sensory attribute over time [38]. This method has been used on a large variety of products such as model solutions [39], beer [40], wine [41] and with solid food, where texture properties were also evaluated, like meat [42] or cheese [43].
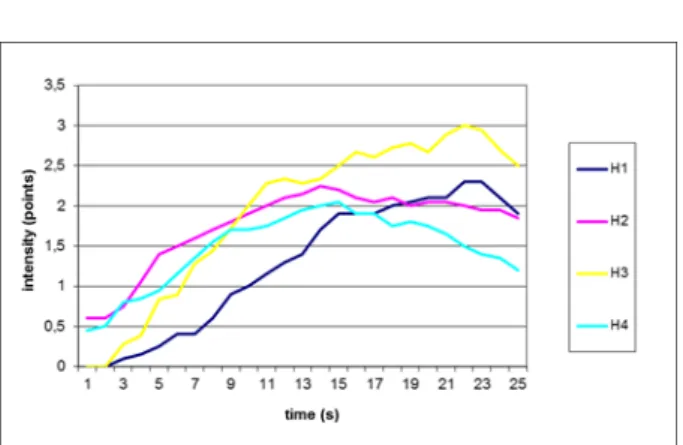
Figure 1 and 2 show intensity of basil taste perception in fresh cheese with addition of basil hydrosol after 24 hour and 7 days vacuum storage from production.
From the obtained sensory results we can conclude that from samples of fresh cheese with the addition of basil hydrosol were best evaluated samples H3 with the addition of 1.5 mL hydrosol to 1 L of milk after 24 hours where the taste was developed gradually and maximum intensity of basil taste equal to 3.0 and it took approximately 22 s of chewing. The weakest intensity was observed in sample of cheese with addition 1.75 mL of basil hydrosol (H4).
210
Figure 1. Time-intesity of fresh cheese with addition of basil hydrosol after 24 hours from production
Figure 2. Time-intesity of fresh cheese with addition of basil hydrosol after 7 days from production
The evaluation of the taste trough TI analysis is very important in the development of new products. Utilization of Time Intensity method used [44] for evaluation salt taste on Mozzarella cheese.
4. Conclusions
The fresh cheese with basil addition in form hydrosol can be good alternative to traditional cheese as was confirmed by our experiment.
The
fresh cheeses with added basil hydrosol
maintain their characteristics even after 7 days
of vacuum storage at 4 °C.
References
1. Boza, J., Sanz Sampelayo, M. R. Aspectos nutricionales de la leche de cabra. In Anales de la Real Academia de Ciencias Veterinarias de Andalucía Oriental, 1997, 10,109–139.
2. Ataro, A., Mc Crindle, R.I., Botha, B.M., Mc Crindle, C.M.E., Ndibewu, P.P. Quantification of trace elements in raw cow’s milk by inductively coupled
plasma mass spectrometry (ICP-MS). Food Chemistry, 2008, 111, 243-248.
3. Kozelová, D., Mura, L., Zeleňáková, L., Lengyelová, L., Hodnotenie názorov spotrebiteľov na bezpečnosť mliečnych výrobkov s využitím štatistických metód. Forum statisticum slovacum, 2011, 7, 104-108. 4. Shelef, L. A. Antimicrobial effect of spices. Journal of Food Safety, 1983, 6, 29-44.
5. Nychas, G. J. E., Natural antimicrobials from plants. In G. W. Gould (Ed.), New methods of food preservation (pp. 58–89). 1995. Aspen Publication Inc. 6. Suppakul, P., Miltz, J., Sonneveld, K., Bigger, S. W. Antimicrobial properties of basil an dits possible application in food packaging. Journal of Agricultural Food Chemistry, 2003, 51, 3197–3207.
7. Dadalioglu, I., Evrendilek, G. Chemical compositions and antibacterial effects of essential oils of Turkish oregano (Origanum minutiflorum), bay laurel (Laurus nobilis), Spanish lavender (Lavandula stoechas L.), and fennel (Foeniculum vulgare) on common foodborne pathogens. Journal of Agricultural and Food Chemistry, 2004, 52, 8255–8260.
8. Matan, N., Rimkeeree, H., Mawson, A. J., CHompreeda, P., Haruthaithanasan, V., Parker, M. Antimicrobial activity of cinnamon and clove oils under modified atmosphere conditions. International Journal of Food Microbiology, 2006, 107, 180–185. 9. Van de Braak, S. A. A. J., Leijten, G. C. J. J. Essential Oils and Oleoresins: A Survey in the Netherlands and other Major Markets in the European Union. CBI, Centre for the Promotion of Imports from Developing Countries, Rotterdam, 1999, 116.
10. Burt, S. Essential oils: their antibacterial properties and potential applications in foods - a review. International Journal of Food Microbiology, 2004, 94, 223–253.
11. Tajkarimi, M. M., Ibrahim, S. A., Cliver, D. O. Antimicrobial herb and spice compounds in food. Food Control, 2010, 21, 1199–1218.
12. Makri, O., Kintzios, S. Ocimum sp. (basil): Botany, cultivation, pharmaceutical properties, and biotechnology. J Herbs Spices Med Plants. 2007, 13, 123–50.
13. Javanmardi, J., Stushnoff, C., Locke, E., Vivanco, J.M. Antioxidant activity and total phenolic content of Iranian Ocimum accessions. Food Chemistry, 2003, 83, 547-550.
14. Kwee, E.M., Niemeyer, E.D. Variations in phenolic composition and antioxidant properties among 15 basil (Ocimum basilicum L.) cultivars. Food Chemistry, 2011, 128, 1044-1050.
15. Lee, J., Scagel, C. F. Chicoric acid found in basil (Ocimum basilicum L.) leaves. Food Chemistry, 2009, 115, 650–656.
211 17. Surveswaran, S., Cai, Y.-Z., Corke, H., Sun, M. Systematic evaluation of natural phenolic antioxidants from 133 Indian medicinal plants. Food Chemistry, 2007, 102, 938–953.
18. Zheng, W., Wang, S. Y. Antioxidant activity and phenolic compounds in selected herbs. Journal of Agricultural and Food Chemistry, 2001, 49, 5165– 5170.
19. Wendin, K., Janestad, H., Hall, G. Modelling and analysis of dynamic sensory data. Food Quality and Preference, 2003, 14, 663–671.
20. Cliff, M., Heymann, H. Development and use of time–intensity methodology for sensory evaluation: A review. Food Research International, 1993, 26, 375– 385.
21. Desobry-Banon, S., Vickers, Z. Cohesiveness of mass evaluation by time–intensity and single-value measurements. Journal of Food Science, 1998, 63, 174–176.
22. Piggott, J.R. Dynamism in flavor science and sensory methodology. Food Research International, 2000, 33, 191–197.
23. Chung, S.J., Heymann H., Grün, I.U. Temporal release of flavor compounds from low-fat and high-fat ice cream during eating. Journal of Food Science, 2003, 68, 2150–2156.
24. Dijksterhuis, G.B., Piggott, J.R. Dynamic methods of sensory analysis. Trends in Food Science and Technology, 2001, 11, 284–290.
25. Ujikawa, M., Bolini, H.M.A. Descriptive profile, time–intensity sweetness profile and affective taste of traditional and low-calorie nectar peach (Prunus persica). Alimentaria, 2004, 357, 85–92.
26. Cavallini, D.C.U., Bolini, H.M.A. Comparação da percepção temporal de doçura, amargor e sabor de fruta em suco de manga reconstituído e adoçado com sacarose, mistura ciclamato/sacariona 2:1, aspartame, sucralose e estévia. Boletim Centro de Pesquisa de Processamento de Alimentos, 2005, 23, 361–382. 27. Mosca, A. C., Van De Velde, F., Bult, J. H. F., Van Boekel, M. A. J. S., Stieger, M. Enhancemente of sweetness intensity in gels by inhomogeneous distribution of sucrose. Food Quality and Preference, 2010, 21, 837–842.
28. François, N., Guyot-Declerck, C., Hug, B., Callemien, D., Govaerts, B., Collin, S. Beer astringency assessed by time–intensity and quantitative descriptive analysus: Influence of pH and accelerated aging. Food Quality and Preference, 2006, 17, 445– 452.
29. Mcgowan, B.A., Lee, S.-Y. Comparison of methods to analyze time–intensity curves in a corn zein chewing gum study. Food Quality and Preference, 2006, 17, 296–306.
30. Duizer, L.M., Bloom, K., Findlay, C.J. Dual-attribute time–intensity measurement of sweetness and
peppermint perception of chewing gum. Journal of Food Science, 1996, 61, 636–638.
31. Ventanas, S., Puolanne, E., Tuorila, H. Temporal changes of flavor and texture in cooked bologna type sausages as affected by fat and salt content. Meat Science, 2010, 85, 410–419.
32. Guinard, J.-X., Wee, C., Mcsunas, A., Fritter, D. Flavor release from salad dressing varying in fat and garlic flavor. Food Quality and Preference, 2002, 13, 129–137.
33. Chung, S.J., Heymann, H., Grün, I.U Temporal release of flavor compounds from low-fat and high-fat ice cream during eating. Journal of Food Science, 2003, 68, 2150–2156.
34. Pionnier, E., Nicklaus, S., Chabanet, C., Mioche, L., Taylor, A.J., Le Quéré, J.L., Salles, C. Flavor perception of a model cheese: relationship with oral and physico-chemical parameters. Food Quality and Preference, 2004, 15, 843–852.
35. González-Tomás, L., Bayarri, S., Taylor, A.J., Costell, E. Flavour release and perception from model dairy custards. Food Research Internacional, 2007, 40, 520–528.
36. Cadena, R. S., Bolini, H. M. A. Time–intensity analysis and acceptance test for traditional and light vanilla ice cream. Food Research International, 2011, 44, 677–683.
37. Vietoris, V. 2010. Software TI-TDS. Release 1.1. 2010.
38. Lee, W. E. Iii, Pangborn, R.-M. Time-intensity: the temporal aspects of sensory perception. Food Technology, 1986, 40, 71-8.
39. Bonnans, S.R., Noble, A.C. Interaction of Salivary flow with temporal perception of sweetness, sourness and fruitiness. Physiol. Behav., 1995, 57, 569-574. 40. King, B. M., Duineveld, C. A. A. Changes in bitterness as beer ages naturally. Food Quality and Preference, 1999, 10, 315-324.
41. Ishikawa, T., Noble, A. C. Temporal perception of astringency and sweetness in red wine. Food Quality and Preference, 1995, 6, 27-34.
42. Duizer, L.M., Bloom, K., Findlay, C.J. Dual-attribute time–intensity measurement of sweetness and peppermint perception of chewing gum. Journal of Food Science, 1996, 61, 636–638.
43. Wendin, K., Janestad, H., Hall, G., 2003: Modelling and analysis of dynamic sensory data. Food Quality and Preference, 2003, 14, 663–671.