VOLUME 17 ISSUE 2 (2019), Page 74 – 91
SERVICE CATCHMENT OF MASS RAPID TRANSIT (MRT) FEEDER BUS: A PRELIMINARY STUDY OF T461 ROUTE TAMAN KAJANG
UTAMA
Chloe Aida Lim Jhin Lin1 & Zakiah Ponrahono2
1,2
Faculty of Environmental Studies
UNIVERSITI PUTRA MALAYSIA
Abstract
The planning and development of rail services require various considerations. Land availability, land use, catchment, route matching, infrastructure fitting, barrier free and micro-climate friendly designs are some of the factors heeded prior to such installations. A deviation between designated and highly demanded service area in urban sprawl zones of the city has been occurring in many Malaysian cities. These gaps have led to the mismatch between origin/destination of passengers and planned locations of train stations and its feeder bus stops. As such, rail services become less accessible to populations with the highest demands. This paper discusses the preliminary findings from a pilot study which seeks to calibrate the research instrument and validate preliminary findings before actual data collection for the purpose of determining the service catchment of the T461 feeder bus in Kajang MRT Station. The Garmin GPS device acts as the research instrument to obtain coordinates of locations where passengers board and alight feeder buses. On-board surveys and comparison analyses are methods that have been used to obtain the optimum GPS coordinates of the bus stop locations. The preliminary findings indicate that the research instrument is ready to be used for actual data collection and geospatial analysis to determine the service catchment of the T461 feeder bus service.
INTRODUCTION
The planning and development of rail services require various considerations. Land availability, land use, catchment, route matching, infrastructure fitting, barrier free and micro-climate-friendly designs are some of the factors heeded prior to such installations. A deviation between designated and highly demanded service areas in urban sprawl zones of the city has been occurring in many Malaysian cities. These gaps have led to the mismatch between origin/destination of passengers and planned locations of train stations and its feeder bus stops. As such, rail services become less accessible to populations with the highest demands. Whilst many types of bus services are provided to varying degrees in Malaysia, less has been prioritised on ensuring the feeder bus system’s integration, coordination and monitoring to reach an efficient level of sustainability (Hayashi, Doi, Yagishita, & Kuwata, 2004).
Rail lines provide maximum efficiency when it comes to transporting a huge number of passengers in the most convenient way, whereas feeder bus routes provide a platform for passengers to travel from bus stops to rail line stations. It is important that the designated feeder bus routes and stops provided along the route is planned and located in a way that uses the least cost, while serving a sufficient number of passengers to a satisfactory level. Nevertheless, several issues in feeder bus services such as the lack of facilities, low passenger trips and long waiting times still occur. Therefore, the feeder bus route design is the first and most important step in the planning procedure. A good bus route network with high coverage and high accessibility will increase the quality of service for a travelling passenger (Almasi, Sadollah, Oh, Kim, & Kang, 2018; Almasi, Mounes, Koting, & Karim, 2014).
Service Catchment
To access the transit network, passengers have to travel to stations either by walking, cycling and public or private transportation. These stations are meant to be located at strategic locations that have catchment areas of high potential travellers. Vuchic (2005) suggests that maximising area coverage is a crucial goal in the design of rail network, as the frequency of usage depends on how easily accessible the stations are to potential travellers. Catchment areas are generally defined as the maximum walking distance or acceptable walking distance, of which the passengers are willing to walk rather than drive (Pongprasert & Kubota, 2017).
concept depicts the relationship between residential components of a neighbourhood based on a five-minute walking radius, which is within 400 meters (Khalid, n.d.). Perry’s concept has contributed tremendously in the field of urban planning in cities as a basic guideline for acceptable walking distances in a neighbourhood. However, the neighbourhood unit concept has also raised questions and criticisms globally as to what extent is this method is responsive to local housing needs. Based on several studies (as cited in Asfour & Zourob, 2017), recent social changes and diverse lifestyles, self-sufficiency, and cross-neighbourhood walkability are determinants of walking behaviours and distances that are acceptable by the residents.
In the public transit industry, service catchment guidelines are commonly based on buffers at 400 meters around bus stops and 800 meters around rail stations (El-Geneidy, Grimsrud, Wasfi, Tétreault, & Surprenant-Legault, 2014). In the Malaysian context, the Green Neighbourhood Guidelines developed by PLANMalaysia stated that for human movement in a neighbourhood, common facilities such as bus stops are to be placed in walkable locations that are within 400 meters or a five minute walk, and transit stations to be located within 800 meters or a ten minute walk. However, acceptable walking distances depend on many factors and differ between communities. Azmi and Karim (2011) found that residents in Shah Alam tend to walk a maximum distance of 200 meters to reach community facilities before deciding to drive. Moreover, Sukor and Fisal (2018) discovered that respondents in Penang Island are willing to walk an average distance of 600 meters to access bus services, with the average time travelled to be around 20 minutes. In Singapore, it is found that about 60% of MRT passengers walked to the stations with an average walking distance of 608 meters (Olszewski & Wibowo, 2005).
The willingness to walk varies for different countries and cities due to the many factors that influence acceptable walking distance, such as gender, age, income and weather (Johar, Jain, Garg, & Gundaliya, 2015). El-Geneidy et al. (2014) concluded that service areas around transit stations should vary based on the service offered and attributes of the people and places served.
Good Design of Feeder Bus System
A well-designed route network can improve the efficiency of the feeder bus system and reduce total costs of supplying the transit service (Salvo & Sabatini, 2014; Lovett, Haynes, Sünnenberg, & Gale, 2002). The route network should be designed in a way that utilises and fully maximises the catchment areas of the station (Shi, Blainer, & Hounsell, 2017). Besides route networks, bus operations should follow designated feeder bus routes and stops for passengers’ access and egress points, to avoid inefficient transit services and inconvenience to the passengers. The bus stop facilities should also meet the passengers’ needs, such as the provision of a shade and bench for passengers to sit while waiting for the bus to arrive. The lack of facilities will decrease the level of satisfaction of bus transit for the passengers, which may lead to them choosing other means of transportation.
The feeder bus is a public transit service for the connection of local areas, where the demand for bus services has to be gathered and transferred to the main stop, which is usually a transit hub or terminal, such as a rapid rail transit station or an express bus terminal (Ciaffi, Cipriani, & Petrelli, 2012). Feeder buses also provide services to transport passengers between the outskirts of a city to the urban centre. Inefficient feeder bus services can impede access to better housing, employment and income opportunities (O’Connor & Caulfield, 2017) and lessen the level of service of the rail system. The current feeder bus system adopted in many urban routes is not appropriate for the urban settlement forms, as well as the socio-demographic and trip characteristics of the communities (Almasi et al., 2014). Many advantageous measures of bus priority as applied in developed countries have not been adopted in assessing feeder bus service levels in Malaysia (Advani & Tiwari, 2006). Several contemporary studies have propagated the use of the following variables to assess a bus service’s sustainability levels: the number of bus fleets, the route coverage of bus operations, the percentage of main land use activity points covered by designated routes, the bus speed and schedules/route adherence, the passenger load factors, as well as service durations and time periods of service provision (Almanis et al., 2014; Ciaffi et al., 2012; Huang, Liu, Huang, & Shen, 2010); yet, such studies are lacking in the contemporary research of feeder bus services quality in Malaysia, especially in evaluating the effectiveness and quality of feeder bus performance. Focusing on the service catchment of feeder bus services and whether the placement of bus stops maximise coverage while avoiding gap redundancies, a case study in Malaysia’s urban area can be considered useful to illustrate an assessment of feeder bus services and the land use transport strategy.
waiting experiences, as well as buses’ reliability and accessibility. This study assesses the current system of feeder bus services in supplementing rail services in urban areas of Malaysia. In this context, therefore, the overall aim of this research is to obtain the service catchment gap of planned feeder bus routes.
This paper discusses the preliminary findings on the existing operations of the feeder bus service in Kajang MRT station based on a pilot study that took place on a Wednesday during morning off-peak hours. The purpose of the pilot study is to test and calibrate the research instrument. A preliminary discussion on issues related to existing feeder bus operation, services and recommendations is drawn in this paper, focusing on data based upon the on-board survey and interviews.
MATERIALS AND METHODS
To determine the service catchment of the T461 feeder bus service, the research instrument plays an important role in the collection and analysis of data. For this study, the main research instrument required is a global positioning system (GPS) device. To calibrate the GPS device, a pilot study was conducted through an on-board survey method, whereby the GPS coordinates of the locations when passengers board and alight the feeder bus are recorded. The pilot study consists of three repetitive trips along the T461 feeder bus route, covering the Taman Kajang Utama area. The GPS coordinates were recorded during each trip to calibrate the research instrument. The pilot study took place on a Wednesday morning off-peak hour, to avoid peak hours as the purpose of the pilot study is to calibrate the research instrument. To validate the accuracy of the GPS coordinates recorded, the coordinates recorded for each trip are compared with actual coordinates of the bus stops found on the Google Maps service.
For this paper, results and discussions are focussed on the pilot study, which is based on data collected through an on-board survey to obtain GPS coordinates of the passengers’ boarding and alighting locations.
On-board survey
To determine the service catchment of the T461 feeder bus service, data collection involves identifying the locations of the designated bus stops along the bus route by utilizing the GPS device. This is done to analyse the service catchment areas of each bus stop through spatial analysis, which requires exact locations of the bus stops.
shoulder hour (from 9.00am until 12.30pm or 2.30pm until 4.30pm) and evening peak hour (from 4.30 pm until 6.30 pm). The data collected includes 1 day over the weekend and 3 days over the weekdays, as working hours and traffic flow are usually heavier on weekdays. The comparison between peak and non-peak hours, as well as weekdays and weekends, will be done in the full paper.
GPS Points Recording
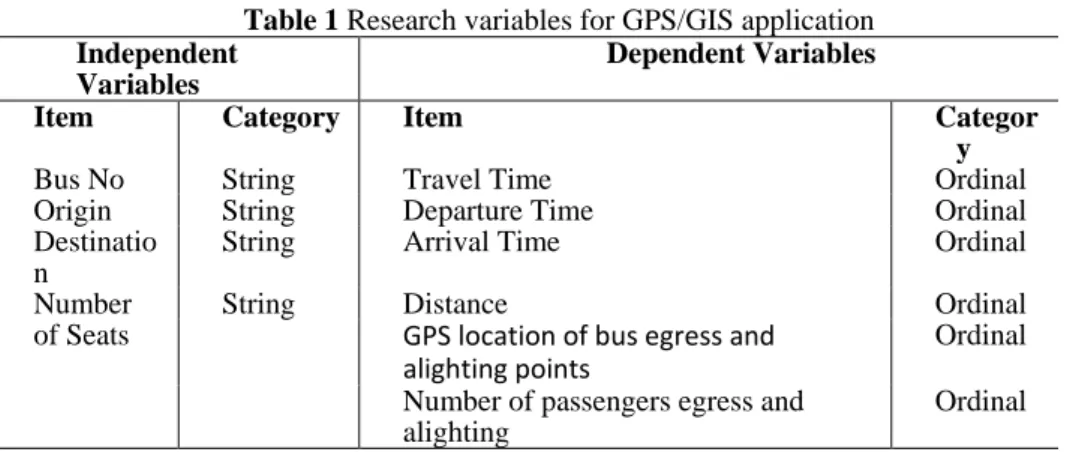
The GPS location of passengers’ access and egress points were recorded during rides for the on-board survey. The use of GPS for the coordinates recorded and GIS for the spatial analysis offers advantages on graphical and attribute data input. For this study, the coordinates/GPS points of passenger’s access and egress points are recorded through the on-board survey, where the points are plotted on a projected map using geographical information system (GIS). The variables (Table 1) for this method applied are:
Table 1 Research variables for GPS/GIS application
Independent Variables
Dependent Variables
Item Category Item Categor
y
Bus No String Travel Time Ordinal
Origin String Departure Time Ordinal Destinatio
n
String Arrival Time Ordinal
Number of Seats
String Distance Ordinal
GPS location of bus egress and alighting points
Ordinal
Number of passengers egress and alighting
Ordinal
Interview with Bus Operator
Brief interviews with bus operators were conducted during the on-board survey upon alighting the feeder bus, where information on the feeder bus service was obtained. The nature of the interviews with the bus operators was informal and included 4 bus drivers operating the feeder buses at the Kajang MRT Station.
Ped Shed Analysis
GIS Spatial Analysis
Spatial analysis is be done by using programs that utilise GIS, such as MapInfo Professional, Google Earth and Basecamp. These programs aid in determining the service catchment area, types of land use surrounding the feeder bus stops and applying the ped shed analysis.
RESULTS AND DISCUSSION
This paper discusses the preliminary findings based on the pilot survey conducted for the purpose of calibrating the research instrument and validating the GPS coordinates of the passengers’ access and egress points. The validation of the accuracy of locations is fundamental and important to achieve the main research aim, which is to determine the service catchment of the T461 feeder bus service provided at the Kajang MRT Station.
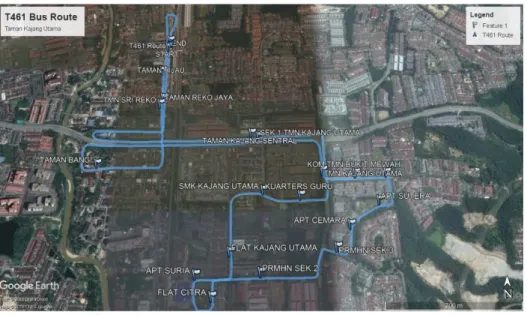
T461 Feeder Bus Route
The T461 feeder bus route consists of 19 bus stops, including the origin and final destination of the feeder bus, which is Kajang MRT Station. Figure 1 shows the locations obtained through the on-board survey for the pilot study. The distance and area covered in the T461 route is 9.4 km and 0.3 square km respectively.
Figure 1 Map of T461 bus route with location of bus stops
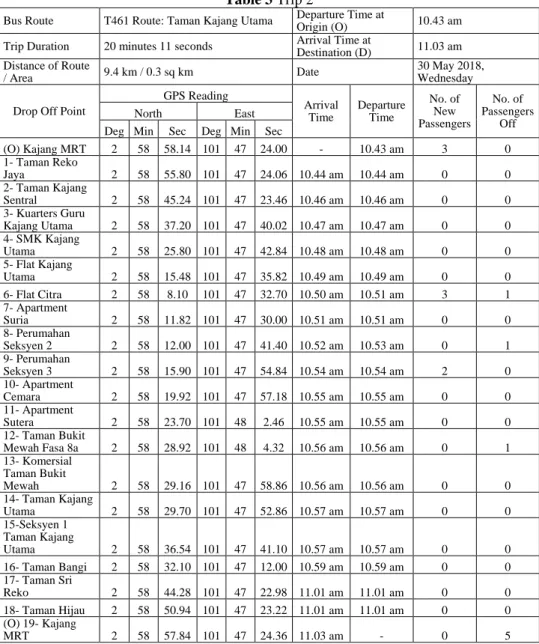
Findings from Pilot Study
The GPS coordinates of locations where passengers board and alight the feeder bus were recorded three times to calibrate the research instrument. The findings for each trip are recorded in Tables 2, 3 and 4 below.
Table 2 Trip 1
Bus Route T461 Route: Taman Kajang Utama Departure Time at Origin (O) 10.13 am
Trip Duration 21 minutes 34 seconds Arrival Time at Destination (D) 10.34 am
Distance of Route /
Area 9.4 km / 0.3 sq km Date
30 May 2018, Wednesday
Drop Off Point
GPS Reading Arrival Time Departur e Time No. of New Passenger s No. of Passengers Off
North East
De g
Mi n Sec
De g
Mi n Sec
(O) Kajang MRT 2 58 55.80 101 47 24.10 - 10.13 am 0 0
1- Taman Reko Jaya 2 58 101 47 0 0
2- Taman Kajang
Sentral 2 58 101 47 0 0
3- Kuarters Guru
Kajang Utama 2 58 101 47 0 0
4- SMK Kajang
Utama 2 58 25.20 101 47 44.60
10.19
am 10.19 am 0 0
5- Flat Kajang
Utama 2 58 15.40 101 47 35.70
10.20
am 10.21 am 2 0
6- Flat Citra 2 58 8.00 101 47 32.50 10.22
am 10.22 am 0 0
7- Apartment Suria 2 58 11.70 101 47 29.80 10.23
am 10.23 am 0 0
8- Perumahan
Seksyen 2 2 58 11.80 101 47 41.30 10.23
am 10.23 am 0 0
9- Perumahan
Seksyen 3 2 58 15.80 101 47 54.50 10.25
am 10.25 am 1 0
10- Apartment
Cemara 2 58 19.40 101 47 57.30 10.25
am 10.25 am 0 0
11- Apartment
Sutera 2 58 23.70 101 48 3.00 10.25
am 10.25 am 3 1
12- Taman Bukit
Mewah Fasa 8a 2 58 28.90 101 48 4.40 10.26
am 10.26 am 0 0
13- Komersial Taman Bukit
Mewah 2 58 29.20 101 47 59.40
10.27
am 10.27 am 0 0
14- Taman Kajang
Utama 2 58 29.70 101 47 52.80
10.27
am 10.27 am 0 0
15-Seksyen 1 Taman Kajang
Utama 2 58 36.70 101 47 41.40
10.28
am 10.28 am 0 0
16- Taman Bangi 2 58 32.10 101 47 11.70 10.30
am 10.30 am 0 0
17- Taman Sri Reko 2 58 44.40 101 47 23.20 10.31
am 10.31 am 0 0
18- Taman Hijau 2 58 51.20 101 47 23.20 10.31
am 10.32 am 0 4
(O) 19- Kajang
MRT 2 58 58.10 101 47 24.00
10.34
am - 0 1
Table 3 Trip 2
Bus Route T461 Route: Taman Kajang Utama Departure Time at Origin (O) 10.43 am
Trip Duration 20 minutes 11 seconds Arrival Time at Destination (D) 11.03 am
Distance of Route
/ Area 9.4 km / 0.3 sq km Date
30 May 2018, Wednesday
Drop Off Point
GPS Reading
Arrival Time
Departure Time
No. of New Passengers
No. of Passengers
Off
North East
Deg Min Sec Deg Min Sec
(O) Kajang MRT 2 58 58.14 101 47 24.00 - 10.43 am 3 0
1- Taman Reko
Jaya 2 58 55.80 101 47 24.06 10.44 am 10.44 am 0 0
2- Taman Kajang
Sentral 2 58 45.24 101 47 23.46 10.46 am 10.46 am 0 0
3- Kuarters Guru
Kajang Utama 2 58 37.20 101 47 40.02 10.47 am 10.47 am 0 0 4- SMK Kajang
Utama 2 58 25.80 101 47 42.84 10.48 am 10.48 am 0 0
5- Flat Kajang
Utama 2 58 15.48 101 47 35.82 10.49 am 10.49 am 0 0
6- Flat Citra 2 58 8.10 101 47 32.70 10.50 am 10.51 am 3 1 7- Apartment
Suria 2 58 11.82 101 47 30.00 10.51 am 10.51 am 0 0
8- Perumahan
Seksyen 2 2 58 12.00 101 47 41.40 10.52 am 10.53 am 0 1 9- Perumahan
Seksyen 3 2 58 15.90 101 47 54.84 10.54 am 10.54 am 2 0 10- Apartment
Cemara 2 58 19.92 101 47 57.18 10.55 am 10.55 am 0 0
11- Apartment
Sutera 2 58 23.70 101 48 2.46 10.55 am 10.55 am 0 0
12- Taman Bukit
Mewah Fasa 8a 2 58 28.92 101 48 4.32 10.56 am 10.56 am 0 1 13- Komersial
Taman Bukit
Mewah 2 58 29.16 101 47 58.86 10.56 am 10.56 am 0 0
14- Taman Kajang
Utama 2 58 29.70 101 47 52.86 10.57 am 10.57 am 0 0
15-Seksyen 1 Taman Kajang
Utama 2 58 36.54 101 47 41.10 10.57 am 10.57 am 0 0
16- Taman Bangi 2 58 32.10 101 47 12.00 10.59 am 10.59 am 0 0 17- Taman Sri
Reko 2 58 44.28 101 47 22.98 11.01 am 11.01 am 0 0
18- Taman Hijau 2 58 50.94 101 47 23.22 11.01 am 11.01 am 0 0 (O) 19- Kajang
MRT 2 58 57.84 101 47 24.36 11.03 am - 0 5
Table 4 Trip 3
Bus Route T461 Route: Taman Kajang Utama Departure Time at Origin (O) 11.14 am
Trip Duration 25 minutes 34 seconds Arrival Time at Destination (D) 11.39 am
Distance of Route
/ Area 9.4 km / 0.3 sq km Date
30 May 2018, Wednesday
Drop Off Point
GPS Reading
Arrival Time
Departure Time
No. of New Passengers
No. of Passengers
Off
North East
Deg Min Sec Deg Min Sec
(O) Kajang MRT 2 58 56.28 101 47 23.88 - 11.14 am 5 0
1- Taman Reko
Jaya 2 58 45.06 101 47 23.40 11.15 am 11.15 am 0 0
2- Taman Kajang
Sentral 2 58 37.26 101 47 40.08 11.19 am 11.19 am 2 0
3- Kuarters Guru
Kajang Utama 2 58 25.08 101 47 48.54 11.22 am 11.22 am 0 2 4- SMK Kajang
Utama 2 58 26.22 101 47 41.94 11.23 am 11.23 am 0 0
5- Flat Kajang
Utama 2 58 15.54 101 47 35.88 11.24 am 11.24 am 0 2
6- Flat Citra 2 58 8.28 101 47 32.76 11.25 am 11.26 am 1 0 7- Apartment
Suria 2 58 11.88 101 47 30.00 11.27 am 11.27 am 0 1
8- Perumahan
Seksyen 2 2 58 11.94 101 47 41.10 11.28 am 11.28 am 0 0 9- Perumahan
Seksyen 3 2 58 15.78 101 47 54.36 11.29 am 11.29 am 0 0 10- Apartment
Cemara 2 58 19.62 101 47 57.00 11.30 am 11.30 am 2 0
11- Apartment
Sutera 2 58 23.82 101 48 2.52 11.30 am 11.30 am 0 2
12- Taman Bukit
Mewah Fasa 8a 2 58 28.86 101 48 4.32 11.31 am 11.32 am 7 1 13- Komersial
Taman Bukit
Mewah 2 58 28.92 101 47 58.74 11.32 am 11.32 am 0 0
14- Taman Kajang
Utama 2 58 29.58 101 47 52.86 11.33 am 11.33 am 0 0
15-Seksyen 1 Taman Kajang
Utama 2 58 36.54 101 47 41.46 11.34 am 11.34 am 0 0
16- Taman Bangi 2 58 32.10 101 47 11.76 11.35 am 11.35 am 0 0 17- Taman Sri
Reko 2 58 43.86 101 47 22.80 11.37 am 11.37 am 0 0
18- Taman Hijau 2 58 51.00 101 47 22.92 11.37 am 11.37 am 0 3 (O) 19- Kajang
MRT 2 58 57.84 101 47 24.24 11.39 am - 0 6
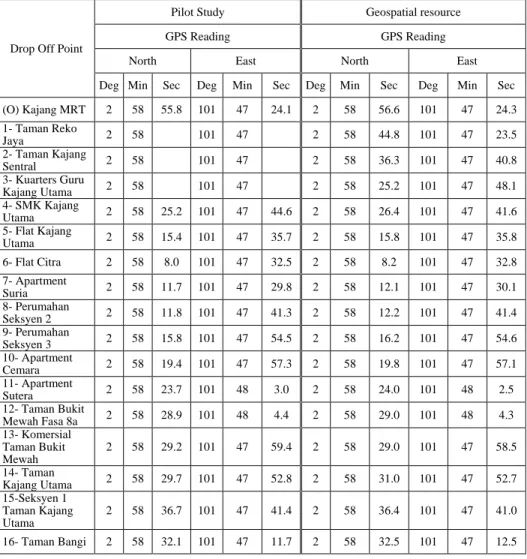
Comparison Analysis
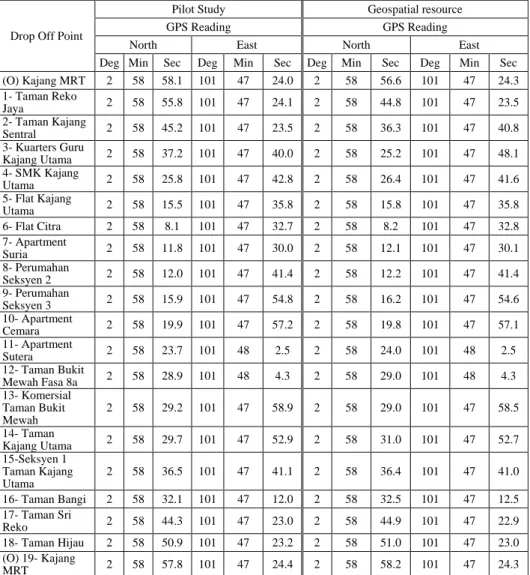
To validate the accuracy of the GPS coordinates recorded during the pilot study, a comparison analysis between the findings from the pilot study and actual coordinates of the bus stop locations was done. Through comparison analysis, we were able to identify any difference between data obtained from the on-board survey and data obtained from a geospatial resource. The actual bus stop coordinates were obtained through Google Maps, which is a good resource for geospatial data. Tables 5, 6 and 7 below show the comparison of GPS coordinates, while Table 8 shows the difference in coordinates for all three trips during the pilot study.
Table 5 Comparison of GPS Coordinates between pilot study (Trip 1) and geospatial resource
Drop Off Point
Pilot Study Geospatial resource
GPS Reading GPS Reading
North East North East
Deg Min Sec Deg Min Sec Deg Min Sec Deg Min Sec
(O) Kajang MRT 2 58 55.8 101 47 24.1 2 58 56.6 101 47 24.3
1- Taman Reko
Jaya 2 58 101 47 2 58 44.8 101 47 23.5
2- Taman Kajang
Sentral 2 58 101 47 2 58 36.3 101 47 40.8
3- Kuarters Guru
Kajang Utama 2 58 101 47 2 58 25.2 101 47 48.1
4- SMK Kajang
Utama 2 58 25.2 101 47 44.6 2 58 26.4 101 47 41.6
5- Flat Kajang
Utama 2 58 15.4 101 47 35.7 2 58 15.8 101 47 35.8
6- Flat Citra 2 58 8.0 101 47 32.5 2 58 8.2 101 47 32.8
7- Apartment
Suria 2 58 11.7 101 47 29.8 2 58 12.1 101 47 30.1
8- Perumahan
Seksyen 2 2 58 11.8 101 47 41.3 2 58 12.2 101 47 41.4 9- Perumahan
Seksyen 3 2 58 15.8 101 47 54.5 2 58 16.2 101 47 54.6 10- Apartment
Cemara 2 58 19.4 101 47 57.3 2 58 19.8 101 47 57.1
11- Apartment
Sutera 2 58 23.7 101 48 3.0 2 58 24.0 101 48 2.5
12- Taman Bukit
Mewah Fasa 8a 2 58 28.9 101 48 4.4 2 58 29.0 101 48 4.3 13- Komersial
Taman Bukit Mewah
2 58 29.2 101 47 59.4 2 58 29.0 101 47 58.5
14- Taman
Kajang Utama 2 58 29.7 101 47 52.8 2 58 31.0 101 47 52.7 15-Seksyen 1
Taman Kajang Utama
2 58 36.7 101 47 41.4 2 58 36.4 101 47 41.0
17- Taman Sri
Reko 2 58 44.4 101 47 23.2 2 58 44.9 101 47 22.9
18- Taman Hijau 2 58 51.2 101 47 23.2 2 58 51.0 101 47 23.0
(O) 19- Kajang
MRT 2 58 58.1 101 47 24.0 2 58 58.2 101 47 24.3
Source: Google Maps, Research Study for Service Catchment of Mass Rapid Transit (MRT) Feeder Bus: A Preliminary Study of T461 Route Taman Kajang Utama
Table 6 Comparison of GPS Coordinates between pilot study (Trip 2) and geospatial resource
Drop Off Point
Pilot Study Geospatial resource
GPS Reading GPS Reading
North East North East
Deg Min Sec Deg Min Sec Deg Min Sec Deg Min Sec (O) Kajang MRT 2 58 58.1 101 47 24.0 2 58 56.6 101 47 24.3 1- Taman Reko
Jaya 2 58 55.8 101 47 24.1 2 58 44.8 101 47 23.5
2- Taman Kajang
Sentral 2 58 45.2 101 47 23.5 2 58 36.3 101 47 40.8
3- Kuarters Guru
Kajang Utama 2 58 37.2 101 47 40.0 2 58 25.2 101 47 48.1 4- SMK Kajang
Utama 2 58 25.8 101 47 42.8 2 58 26.4 101 47 41.6
5- Flat Kajang
Utama 2 58 15.5 101 47 35.8 2 58 15.8 101 47 35.8
6- Flat Citra 2 58 8.1 101 47 32.7 2 58 8.2 101 47 32.8 7- Apartment
Suria 2 58 11.8 101 47 30.0 2 58 12.1 101 47 30.1
8- Perumahan
Seksyen 2 2 58 12.0 101 47 41.4 2 58 12.2 101 47 41.4 9- Perumahan
Seksyen 3 2 58 15.9 101 47 54.8 2 58 16.2 101 47 54.6 10- Apartment
Cemara 2 58 19.9 101 47 57.2 2 58 19.8 101 47 57.1
11- Apartment
Sutera 2 58 23.7 101 48 2.5 2 58 24.0 101 48 2.5
12- Taman Bukit
Mewah Fasa 8a 2 58 28.9 101 48 4.3 2 58 29.0 101 48 4.3 13- Komersial
Taman Bukit Mewah
2 58 29.2 101 47 58.9 2 58 29.0 101 47 58.5
14- Taman
Kajang Utama 2 58 29.7 101 47 52.9 2 58 31.0 101 47 52.7 15-Seksyen 1
Taman Kajang Utama
2 58 36.5 101 47 41.1 2 58 36.4 101 47 41.0
16- Taman Bangi 2 58 32.1 101 47 12.0 2 58 32.5 101 47 12.5 17- Taman Sri
Reko 2 58 44.3 101 47 23.0 2 58 44.9 101 47 22.9
18- Taman Hijau 2 58 50.9 101 47 23.2 2 58 51.0 101 47 23.0 (O) 19- Kajang
MRT 2 58 57.8 101 47 24.4 2 58 58.2 101 47 24.3
Table 7 Comparison of GPS Coordinates between pilot study (Trip 3) and geospatial resource
Drop Off Point
Pilot Study Geospatial resource
GPS Reading GPS Reading
North East North East
Deg Min Sec Deg Min Sec Deg Min Sec Deg Min Sec (O) Kajang MRT 2 58 56.3 101 47 23.9 2 58 56.6 101 47 24.3 1- Taman Reko
Jaya 2 58 45.1 101 47 23.4 2 58 44.8 101 47 23.5
2- Taman Kajang
Sentral 2 58 37.3 101 47 40.1 2 58 36.3 101 47 40.8
3- Kuarters Guru
Kajang Utama 2 58 25.1 101 47 48.5 2 58 25.2 101 47 48.1 4- SMK Kajang
Utama 2 58 26.2 101 47 41.9 2 58 26.4 101 47 41.6
5- Flat Kajang
Utama 2 58 15.5 101 47 35.9 2 58 15.8 101 47 35.8
6- Flat Citra 2 58 8.3 101 47 32.8 2 58 8.2 101 47 32.8 7- Apartment
Suria 2 58 11.9 101 47 30.0 2 58 12.1 101 47 30.1
8- Perumahan
Seksyen 2 2 58 11.9 101 47 41.1 2 58 12.2 101 47 41.4 9- Perumahan
Seksyen 3 2 58 15.8 101 47 54.4 2 58 16.2 101 47 54.6 10- Apartment
Cemara 2 58 19.6 101 47 57.0 2 58 19.8 101 47 57.1
11- Apartment
Sutera 2 58 23.8 101 48 2.5 2 58 24.0 101 48 2.5
12- Taman Bukit
Mewah Fasa 8a 2 58 28.9 101 48 4.3 2 58 29.0 101 48 4.3 13- Komersial
Taman Bukit Mewah
2 58 28.9 101 47 58.7 2 58 29.0 101 47 58.5
14- Taman
Kajang Utama 2 58 29.6 101 47 52.9 2 58 31.0 101 47 52.7 15-Seksyen 1
Taman Kajang Utama
2 58 36.5 101 47 41.5 2 58 36.4 101 47 41.0
16- Taman Bangi 2 58 32.1 101 47 11.8 2 58 32.5 101 47 12.5 17- Taman Sri
Reko 2 58 43.9 101 47 22.8 2 58 44.9 101 47 22.9
18- Taman Hijau 2 58 51.0 101 47 22.9 2 58 51.0 101 47 23.0 (O) 19- Kajang
MRT 2 58 57.8 101 47 24.2 2 58 58.2 101 47 24.3
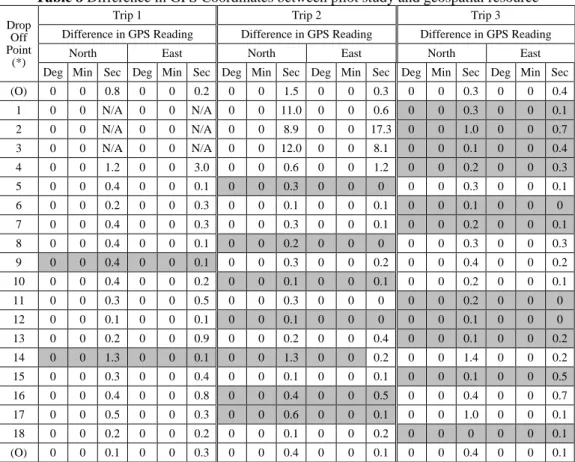
Table 8 Difference in GPS Coordinates between pilot study and geospatial resource
Drop Off Point
(*)
Trip 1 Trip 2 Trip 3
Difference in GPS Reading Difference in GPS Reading Difference in GPS Reading
North East North East North East
Deg Min Sec Deg Min Sec Deg Min Sec Deg Min Sec Deg Min Sec Deg Min Sec
(O) 0 0 0.8 0 0 0.2 0 0 1.5 0 0 0.3 0 0 0.3 0 0 0.4
1 0 0 N/A 0 0 N/A 0 0 11.0 0 0 0.6 0 0 0.3 0 0 0.1
2 0 0 N/A 0 0 N/A 0 0 8.9 0 0 17.3 0 0 1.0 0 0 0.7
3 0 0 N/A 0 0 N/A 0 0 12.0 0 0 8.1 0 0 0.1 0 0 0.4
4 0 0 1.2 0 0 3.0 0 0 0.6 0 0 1.2 0 0 0.2 0 0 0.3
5 0 0 0.4 0 0 0.1 0 0 0.3 0 0 0 0 0 0.3 0 0 0.1
6 0 0 0.2 0 0 0.3 0 0 0.1 0 0 0.1 0 0 0.1 0 0 0
7 0 0 0.4 0 0 0.3 0 0 0.3 0 0 0.1 0 0 0.2 0 0 0.1
8 0 0 0.4 0 0 0.1 0 0 0.2 0 0 0 0 0 0.3 0 0 0.3
9 0 0 0.4 0 0 0.1 0 0 0.3 0 0 0.2 0 0 0.4 0 0 0.2
10 0 0 0.4 0 0 0.2 0 0 0.1 0 0 0.1 0 0 0.2 0 0 0.1
11 0 0 0.3 0 0 0.5 0 0 0.3 0 0 0 0 0 0.2 0 0 0
12 0 0 0.1 0 0 0.1 0 0 0.1 0 0 0 0 0 0.1 0 0 0
13 0 0 0.2 0 0 0.9 0 0 0.2 0 0 0.4 0 0 0.1 0 0 0.2
14 0 0 1.3 0 0 0.1 0 0 1.3 0 0 0.2 0 0 1.4 0 0 0.2
15 0 0 0.3 0 0 0.4 0 0 0.1 0 0 0.1 0 0 0.1 0 0 0.5
16 0 0 0.4 0 0 0.8 0 0 0.4 0 0 0.5 0 0 0.4 0 0 0.7
17 0 0 0.5 0 0 0.3 0 0 0.6 0 0 0.1 0 0 1.0 0 0 0.1
18 0 0 0.2 0 0 0.2 0 0 0.1 0 0 0.2 0 0 0 0 0 0.1
(O) 0 0 0.1 0 0 0.3 0 0 0.4 0 0 0.1 0 0 0.4 0 0 0.1
Source: Google Maps, Research Study for Service Catchment of Mass Rapid Transit (MRT) Feeder Bus: A Preliminary Study of T461 Route Taman Kajang Utama (*)Drop Off Point
(O) Kajang MRT 6- Flat Citra 12- Taman Bukit Mewah Fasa
8a 18- Taman Hijau
1- Taman Reko Jaya 7- Apartment Suria 13- Komersial Taman Bukit Mewah
2- Taman Kajang Sentral 8- Perumahan Seksyen 2 14- Taman Kajang Utama 3- Kuarters Guru Kajang
Utama 9- Perumahan Seksyen 3
15-Seksyen 1 Taman Kajang Utama
4- SMK Kajang Utama 10- Apartment Cemara 16- Taman Bangi
5- Flat Kajang Utama 11- Apartment Sutera 17- Taman Sri Reko
no optimum coordinates are chosen as the feeder buses may depart or arrive at different locations. For Trip 1, the coordinates for drop off points 1, 2 and 3 were unattainable due to the unfamiliarity of the route and locations of the bus stops during the pilot survey.
One second of latitude and one second of longitude represents 30.72m and 30.92m respectively. The findings show that for the optimum coordinates, the range of the difference in latitude are within 0 seconds to 1.3 seconds, which represents a gap distance of less than 40m, whereas the range of difference in longitude are within 0 seconds to 0.7 seconds, which represents a gap distance of less than 30m. Generally, the difference in coordinates is minimal, which is acceptable for this study due to the situational nature of the movement of feeder buses. Hence, the pilot study was able to calibrate the research instrument and validate the accuracy of the GPS coordinates. The revised GPS coordinates based on the optimum locations can be seen in Table 9 below.
Table 9 Optimum GPS coordinates of bus stop locations
Drop Off Point
Pilot Study GPS Reading
North East
Deg Min Sec Deg Min Sec (O) Kajang MRT 2 58 56.3 101 47 23.9 1- Taman Reko Jaya 2 58 45.1 101 47 23.4 2- Taman Kajang Sentral 2 58 37.3 101 47 40.1 3- Kuarters Guru Kajang
Utama 2 58 25.1 101 47 48.5
4- SMK Kajang Utama 2 58 26.2 101 47 41.9 5- Flat Kajang Utama 2 58 15.5 101 47 35.8 6- Flat Citra 2 58 8.3 101 47 32.8 7- Apartment Suria 2 58 11.9 101 47 30.0 8- Perumahan Seksyen 2 2 58 12.0 101 47 41.4 9- Perumahan Seksyen 3 2 58 15.8 101 47 54.5 10- Apartment Cemara 2 58 19.9 101 47 57.2 11- Apartment Sutera 2 58 23.8 101 48 2.5 12- Taman Bukit Mewah
Fasa 8a 2 58 28.9 101 48 4.3
13- Komersial Taman
Bukit Mewah 2 58 28.9 101 47 58.7 14- Taman Kajang Utama 2 58 29.7 101 47 52.8 15-Seksyen 1 Taman
Kajang Utama 2 58 36.5 101 47 41.5 16- Taman Bangi 2 58 32.1 101 47 12.0 17- Taman Sri Reko 2 58 44.3 101 47 23.0 18- Taman Hijau 2 58 51.0 101 47 22.9 (O) 19- Kajang MRT 2 58 57.8 101 47 24.2
Recommendations
From the larger context of the tudy, further discussion should be done on several aspects in the feeder bus system regarding the service catchment of the feeder bus service. The following are recommendations for further discussion in the actual study:
• Bus stop spacing
• Bus stop environment and facilities
• Process of Ped shed analysis
• Redundancies in service gap
• Land use pattern
• Geospatial analysis
CONCLUSION
Literature review shows that walkable catchment areas differ all around the world and depend on various factors. Commonly, the 400m and 800m buffers are applied in urban planning to determine walkable catchment areas in a neighbourhood. By determining the service catchment of feeder buses, we are able to identify gaps or mismatches in the feeder bus system that might potentially affect the performance and effectiveness of urban rail transit. Ped shed terminology has been used as a tool in urban planning to assess the walkability catchments of common facilities. It is also useful in suggesting improvements for the connectivity and walkability of bus stops.
The findings from this preliminary study indicate that the research instrument is ready to be used for actual data collection and geospatial analysis to determine the service catchment of the T461 feeder bus service. Optimum GPS coordinates derived from the pilot study will be used for geospatial analysis to achieve the research objectives.
ACKNOWLEDGEMENTS
This research was fully supported by the UPM Putra Grant – IPM/2018/9592500 (UPM RMC).
REFERENCES
Active Healthy Communities. (2014). PedShed analysis. Retrieved from http://www.activehealthycommunities.com.au/plan/gis-analysis/walking-cycling-pedshed-analysis/
Advani, M., & Tiwari, G. (2006). Review of capacity improvement strategies for bus transit service. Indian Journal of Transport Management, 30(4), 363-391.
Almasi, M. H., Mounes, S. M., Koting, S., & Karim, M. R. (2014). Analysis of feeder bus network design and scheduling problems. The Scientific World Journal,
Almasi, M. H., Sadollah, A., Oh, Y., Kim, D., & Kang, S. (2018). Optimal coordination strategy for an integrated multimodal transit feeder network design considering multiple objectives. Sustainability 2018, 10, 734.
Asfour, O. S., & Zourob, N. (2017). The neighbourhood unit adequacy: An analysis of the case of Gaza, Palestine. Cities, 69, 1-11.
Azmi, D. I., & Karim, H. A. (2012). A comparative study of walking behavior to community facilities in low-cost and medium cost housing. Procedia – Social and Behavioral Sciences, 35, 619-628.
Ciaffi, F., Cipriani, E., & Petrelli, M. (2012). Feeder bus network design problem : A new metaheuristic procedure and real size applications. Procedia - Social and Behavioral Sciences, 54, 798-807.
El-Geneidy, A., Grimsrud, M., Wasfi, R., Tétreault, P., & Surprenant-Legault, J. (2014). New evidence on walking distances to transit stops: Identifying redundancies and gaps using variable service areas. Transportation, 41(1), 193-210.
Hayashi, Y., Doi, K., Yagishita, M., & Kuwata, M. (2004). Urban transport sustainability: Asian trends, problems and policy practices. EJTIR, 4(1), 27-45.
Huang, Z. D, Liu, X. J., Huang, C. C., & Shen, J. W. (2010). A GIS-based framework for bus network optimization using genetic algorithm. Annals of GIS, 16(3), 185-194.
Johar, A., Jain, S. S., Garg, P. K., & Gundaliya, P. J. (2015). A study for commuter walk distance from bus stops to different destination along routes in Delhi. European Transport, 59(3), (n.p.).
Khalid, N. S. (n.d.). Human walking behaviour to open spaces. Retrieved from https://www.academia.edu/9714659/HUMAN_WALKING_BEHAVIOUR_T O_OPEN_SPACES
Lovett, A., Haynes, R., Sünnenberg, G., & Gale, S. (2002). Car travel time and accessibility by bus to general practitioner services: A study using patient registers and GIS. Social Science and Medicine, 55, 97-111.
LeGates, R. T., & Stout, F. (Eds.). 1943- (2011). The city reader (5th ed). London: Routledge.
Meenakshi. (2011). Neighborhood unit and its conceptualization in the contemporary urban context. Institute of Town Planners, India Journal 8(3), 81-87.
New Zealand, Auckland Council. (2010). New Lynn Urban Plan 2010-2030. Retrieved from https://www.aucklandcouncil.govt.nz/plans-projects-policies-reports- bylaws/our-plans-strategies/place-based-plans/docsnewlynnurbanplan/new-lynn-urban-plan-2010-part-1.pdf
O’Connor, D., & Caulfield, B. (2017). Level of service and the transit neighbourhood – observations from Dublin city and suburbs. In 15th International Conference
Series on Competition and Ownership in Land Passenger Transport. Stockholm,
Sweden.
Olszewski, P., & Wibowo, S. (2005). Using equivalent walking distance to assess pedestrian accessibility to transit stations in Singapore. Transportation Research Record: Journal of the Transportation Research Board, 1927, 38-45.
Salvo, G., & Sabatini, S. (2014). A GIS approach to evaluate bus stop accessibility.
Advanced OR and AI Methods in Transportation. Retrieved from
http://www.iasi.cnr.it/ewgt/ 16conference/ID108.pdf.
Shi, Y., Blainey, S., & Hounsell, N. (2017). Using GIS to assess the potential for centralised planning of bus networks. Transportation Planning and Technology, 40(1), 119-142.
Sukor, N. S., & Fisal, S. F. (2018). Factors influencing the willingness to walk to the bus stops in Penang Island. Planning Malaysia, 16(1), 193-204.
Vuchic, v. R. (2005). Urban transit: Operations, planning and economics. New Jersey: John Wiley & Sons