International Journal of Research in Engineering & Applied Sciences
Email:- [email protected], http://www.euroasiapub.org
77
QUANTIFYING THE DYNAMICS OF LANDSCAPE PATTERNSIN
THIRUVANANTHAPURAM
CORPORATION USING OPEN SOURCE GIS TOOLS
Prasad Rajendran
1Assistant Professor,
Department of Geography,University College,
Thiruvanathapuram,Kerala
Dr.K.Mani
2Associate Professor,
Department of Geography,University College,
Thiruvanathapuram,Kerala
ABSTRACT
Urbanization is taking place at an unprecedented rate in Thiruvananthapuram,the capital city of Indian state of Kerala.Here,urban sprawl effects instigateda complex pattern of land use practices,leading to redundant landscape structural changes and undesirable micro-climate.Hence,an evaluation of landscapecharacteristics of the study area is crucial in effective urban planning and decision making for creating a sustainable urban environment.In this context,this study investigated the complexity of landscape structure based on landscape metrics indices on a temporal scale.Theclass-level metrics were computedusing the reclassified land cover grids derived from Landsat 7 ETM+ (2000) and Landsat 8 OLI (2015) images pertaining to the study area.All tasks in the methodology was accomplished by using the potentialities of Open Source tools like Semi-Automatic Classification Plugin and LecoS(Landscape ecology Statistics)in Quantum GIS environment.The results were adhered to absolute manifestations of urban sprawl effects on the spatial and temporal patterns of landscape heterogeneity.
Keywords: Urbanization,Landscape Metrics,Open Source GIS,Remote Sensing
INTRODUCTION
International Journal of Research in Engineering & Applied Sciences
Email:- [email protected], http://www.euroasiapub.org
78
Characterizing landscape is associated with quantification of linkages between spatial patterns and ecological processes.Key components of spatial patterns of landscape include composition, configuration and connectivity.According to McGarigal et al.(1994),landscape composition refers to number of occurrence of different types of landscape elements, while configuration encompasses the physical distribution or spatial character within the landscape.When the landscape composition explains presence,relative abundance and diversity, configuration or structure refers to spatial arrangement, position, orientation and shape complexity of patches of the landscape.Connectivity is generally connoted as the degree to which the landscape facilitates or impedes species movement.In landscape ecology,patch-based metrics are used to quantify landscape composition and configuration.The variables representing the characteristics of patches calledlandscape metrics or indicators, can be used to assess the state of health of natural landscapes at local and regional levels.As indices of landscape structure,landscape metrics can be used to describe the composition and spatial arrangement of a landscape.They can be applied at different levels to describe single landscape elements by such features as size, number or for whole landscapes by describing the arrangement of landscape elements and the diversity of landscapes (Ulrich Walz,2006).A plethora of metrics developed to quantifycomposition (landscape proportion,pacth richness,patch evenness and patch diversity) and spatial configuration (patch size,shape complexity, edge effects) can be categorized as: area/density/edge metrics, shape metrics, core area metrics, connectivity metrics, diversity metrics etc.With rapid advances in Computer technology, GIS (Geographical Information System) has become crucial in classifying and characterizing landscapes.Integration of GIS and Remote Sensing (RS) have given us a much broader perspective of how human disturbances create complex patterns of landscape change at spatial and temporal scales.Free and Open Source (FOSS) softwares like Quantum GIS have flexibility and greater potential to integrate with other packages and plugins and thereby an array of analysis performed in spatial domain are limitless (Chelaru D et al.,2014).
Since all human activities vary from location to location in urban landscapes,spatial heterogeneity is more profound in cities than other landscape systems.Urbanization is one of the processes that undoubtedly modify landscape patterns through human induced landcover changes that have subtleimpact on the ecological processes.The state of Kerala has undergone highest level of urbanization (47.71%) during 2001-2011, a percentage increase of 83.2% over the previous decade. Urban regions in Kerala are highly fragmented, with disconnected patches of urban fabric broken up by swathes ofagriculturalland. Rapid, often unplanned urbanization in TUA (Thiruvananthapuram Urban Agglomeration) has altered natural landscape patterns through increase of impervious cover and drastic change of land use/land cover in the area.Spatio-temporal patterns of urban sprawl effects haveinduced undesirable micro climate and complex landscape structural changes.Thus quantifying landscape pattern and its change is essential for the monitoring and assessment of ecological consequences of urbanization.In this context, the present study proceeds with the following specific objectives:
1) To delineate land use/land cover (LULC) patterns of Thiruvananthapuram Corporation on a temporal scale using Open Source GIS tools.
2) To quantify the dynamics of landscape configuration and composition and to highlightthe impact of urban sprawl effects on the spatial heterogeneity.
STUDY AREA
International Journal of Research in Engineering & Applied Sciences
Email:- [email protected], http://www.euroasiapub.org
79
ThiruvananthapuramCorporation covering an area of 214.86 km².Itlies between 8°12'23''N to8°36'27''N latitudes and76°51'17''E to 77°0'58''E longitudes.Theregion is characterized by undulating terrain of low coastal hills with mean elevation ranging from 0 to 80 m above MSL.The regionenjoys a warm-humid climate with high annual variability of rainfall.Thiruvananthapuramis drained by Karamana and Killi riverswhich joins the Arabian Sea at Thiruvallom.The Corporation has a population of 9,57,730 (2011) with a population density of 4,454/km².
MATERIALS AND METHODS
Data Sources
The data used to study temporal landscape structure changes and to quantify landscape metrics were Landsat 7 Enhanced Thematic Mapper (ETM+) images of 2000 and Landsat 8 (OLI) images of 2015(Path/Row-144/054) pertaining to the study area. Topographic maps of Survey of India (SOI) of 1:25,000 scale were used as the base map for the present study. Hand held GPS (Global Positioning System) was used to collect necessary ground truth data and the classified outputs were validated using Google Earth.Softwares and Plugins used: Free and Open source (FOSS) Quantum GIS, Plugins like Orfeo toolbox, Semi-Automatic Classification 4.3.3 (SCP,Luca Congedo) for image classification,LecoS 1.9.7(Landscape ecology Statistics) for quantification of landscape metrics indices.
Methodology
International Journal of Research in Engineering & Applied Sciences
Email:- [email protected], http://www.euroasiapub.org
80
The landscape characterization of the study area was conducted through two-stage analysis which focusing on :1)a standardized approach to understand the land cover patterns 2)a quantitative approach to describe compositional and spatial aspects of landscape based on categorical thematic maps.
Digital Image Classification/Land Classification Scheme
Landsat images (Path 144/Row 054) covering ThiruvanathapuramCorporation area were obtained for the years 2000 and 2015 from US Geological Survey (USGS).Necessary pre-processing (line correction,enhancement,DOS1atmospheric correction, resampling,DN(Digital Number)conversion to (TOA)Top of Atmospheric reflectance, clipping) was performed over the Landsat bands to improve visual quality and better interpretation using the SCP plugin.Next step involved creation of a training shapefile which stores ROIs (Regions of Interest)that defines land cover classes.Several ROIs were created considering the spectral variability using the Region Growing process (ie.segementation of image, grouping similar pixels).The following five landcover classes were delineated in the process :Built-Up area(Buildings,paved surfaces,roads,playgrounds),Waterbody(streams,lakes,ponds),MixedVegetation(Trees,scrubland, Grass) and Agricultural lands (Paddy fiels,Other croplands).The classification of land cover was based on spectral signatures defined in the training shape file.Maximum likelihood algorithm is applied to classify the satellite dataand in order to assess reliability of classification, error matrix was calculated (Congedo& Munafo,2012).Field data were used to supplement classification procedure and validation of the results. In the post-classification phase, the image grids were reclassified into four main classes by assigning new values in the look up table.Report on the classification was the produced to obtain the percentage and area under the land cover classes.
9DN) 9DN)
Landsat Bands (DN) 2000, 2015
9DN)
Conversion of raster bands from DN to reflectance
9DN) 9DN)
Landsat Bands (Corrected)
9DN)
Definition of classification inputs
Band Set
9DN)
Training Shapefile
9DN)
Creation of ROIs
Land Cover classification
9DN)
Semi-automatic classification (Supervised)
Accuracy assessment
International Journal of Research in Engineering & Applied Sciences
Email:- [email protected], http://www.euroasiapub.org
81
Estimation of Landscape Metrics
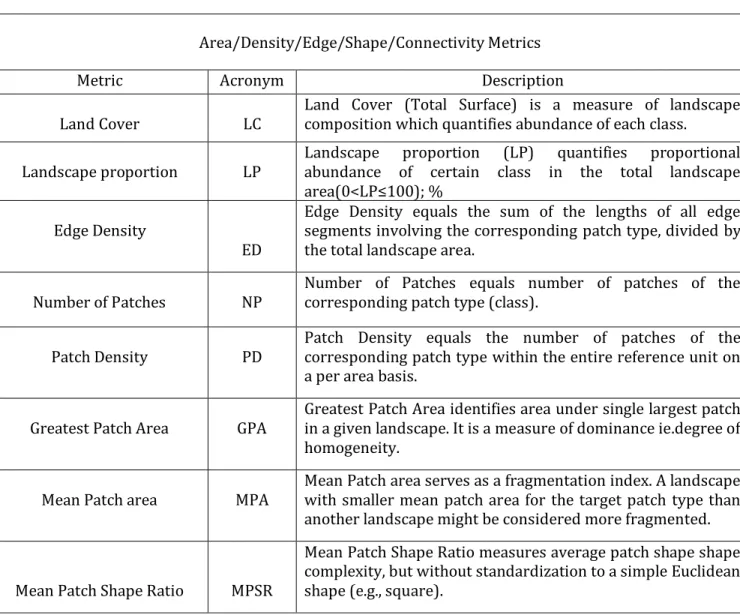
Conventional landscape metrics measure spatial configuration and composition of categorical patch mosaics.Under patch mosaic model of landscape structure, a landscape is represented as a collection of discrete patches (Andre B L et.al, 2012).In this study, we used LecoS pluginwhich identifies patches by class to calculate landscape metrics.The defined method of landscape ecology indices within landscape structure analysis was performed for the LULC classes in identified categories, spatial and compositional relations of landscape elements.Calculated coefficients can be classified according to the type of evaluated characteristic into categories of indexes:of shape, size,diversity,edges and proximity (Stejskalova et.al, 2012).Statistically, many of the metrics are correlated and can be depicted into concised form according to the structural characteristics. Table 3.1 shows the indices, acronyms used and a short description of each indicator.
Table 1.Landscape Metrics used in the study
Area/Density/Edge/Shape/Connectivity Metrics
Metric Acronym Description
Land Cover LC
Land Cover (Total Surface) is a measure of landscape composition which quantifies abundance of each class.
Landscape proportion LP
Landscape proportion (LP) quantifies proportional abundance of certain class in the total landscape area(0<LP≤100); %
Edge Density
ED
Edge Density equals the sum of the lengths of all edge segments involving the corresponding patch type, divided by the total landscape area.
Number of Patches NP
Number of Patches equals number of patches of the corresponding patch type (class).
Patch Density PD
Patch Density equals the number of patches of the corresponding patch type within the entire reference unit on a per area basis.
Greatest Patch Area GPA
Greatest Patch Area identifies area under single largest patch in a given landscape. It is a measure of dominance ie.degree of homogeneity.
Mean Patch area MPA
Mean Patch area serves as a fragmentation index. A landscape with smaller mean patch area for the target patch type than another landscape might be considered more fragmented.
Mean Patch Shape Ratio MPSR
International Journal of Research in Engineering & Applied Sciences
Email:- [email protected], http://www.euroasiapub.org
82
RESULTS AND DISCUSSION
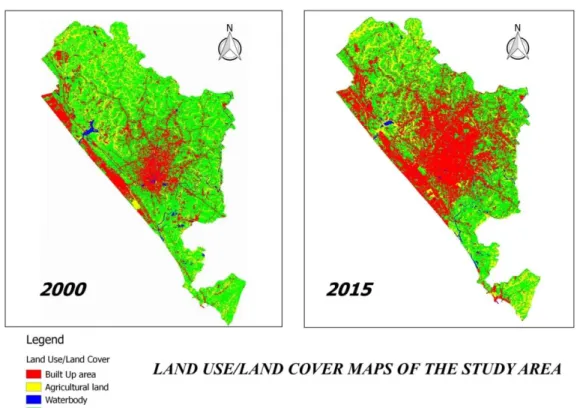
Urban growth in Thiruvananthapuram UA has induced complex land use land cover relationship in the last few decades.A quantitative analysis of the landscape structure would reveal the landscape heterogeneity and fragmentation,whichmaybe useful in urban land use planning and decision making in an emerging Metropolis like Thiruvananthapuram City.The first objective of the study was to prepare urban land use-land cover maps of 2000 and 2015 using on Landsat images of the study area. The images were classified using SCP 4.6.5 (Semi-Automatic Classification Plugin)with Gaussian Maximum Likelihood algorithm with an overall accuracy of 95 % (2000) and 98 %( 2015).The reclassified land cover grids were used to compute landscape metrics indices using the LecoS plugin to understand thedynamics of landscape structure and patterns for two selected time periods.The classified images representing the land use/land cover for different time periods is given below and the results of landscape metrics is reported in Table 4.1,4.2 and 4.3.
Landscape Division LD
Landscape Division is defined as the probability that two randomly chosen places in the landscape to be found in the same patch.
Effective Mesh Size m
Effective Mesh Size (m) indicates probability that two points randomly chosen in region will be connected.
Shannon’s Diversity Index SHDI
The SHDI expresses the proportional abundance of every patch of a certain type; multiplied by that proportion.
Shannon Equitability Index
SHEI
Shannon Equitability (Evenness) Index expresses the dominance of patches within the total area.
Simpson Diversity Index (SIDI
SIDI
International Journal of Research in Engineering & Applied Sciences
Email:- [email protected], http://www.euroasiapub.org
83
In the context of landscape ecology, diversity indices are significant in characterizing the structural pattern of landscapes.Diversity indices provide valuable information about rarity and commonness of classes in a particular landscape.This study computed multiple indices such as Shannon’s Diversity Index, Shannon Equitability (Evenness) Index and Simpson Diversity Index (SIDI) to calculate both evenness and diversity using the LecoS plugin in QGIS.These indices are composition metrics reflecting richness and evenness at the landscape level. Table 4.1shows values of diversity indices calculated for the two time periods.
Table 2.Landscape Diversity Indices between 2000 and 2015
Metrics Values_2000 Values_2015
SHDI 1.992 1.1297
SHEI 0.7155 0.6828
SIDI 0.559 0.528
International Journal of Research in Engineering & Applied Sciences
Email:- [email protected], http://www.euroasiapub.org
84
Simpson Diversity Index (SIDI), whichtakes into account of these two factors, shows values lowest for the two periods.
Table 3.Landscape Metrics computed for class types for 2000
Class LC LP ED NP PD GPA MPA MPSR D m
1
4610.53 21.47 0.102 3921 1.89 201.46 11.35 2.21 0.99006 205.86 2
3531.83 16.45 0.01 4991 2.41 70.09 6.83 1.58 0.99990 4.16 3
311.66 1.45 0.001 791 3.82 6.83 3.81 1.146 0.99998 0.255 4
13018.88 60.63 0.019 1179 5.69 1187.49 10.66 0.819 0.67153 6806.08
Table 4.Landscape Metrics computed for class types for 2015
Class LC LP ED NP PD GPA MPA MPSR D m
1 8401.17 39.12 0.011 2781 1.3 403.4 30.18 1.049 0.92621 1584.5 2 1649.1 7.68 0.007 3413 1.59 55.7 3.35 2.552 0.9998 1.94 3 274.45 1.28 0.0009 771 3.6 5.006 3.45 1.156 0.999995 0.087 4 9658.53 51.92 0.016 2330 1.09 998.93 4.15 0.791 0.9554 957.75
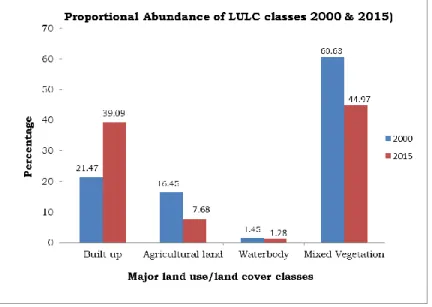
Land Cover (LC) and Landscape proportion (LP) indices highlight composition and relative abundance of classes in the given landscape.Land Cover quantifies abundance of each class without any reference to spatial arrangement. There is a significant rise in under Built-up cover; nearly doubled (4610.53 ha to 8401.17 ha) between the selected time period.On the other hand,a phenomenal decline is recorded among mixed tree vegetation, water body and agricultural lands; 13018.88 ha to 9658.529 ha,311.66 to 274.45 ha, 3531.83 ha to 1649.1 ha respectively.
International Journal of Research in Engineering & Applied Sciences
Email:- [email protected], http://www.euroasiapub.org
85
Edge Density(ED) is a measure of complexity of shape of patches and expresses the spatial heterogeneity of a landscape mosaic. Decreasing values of ED illustrated in the Table 4.2,4.3 suggests a waning heterogeneity of the landscape.Urban sprawl effects in the study area largely contribute to this effect of landscape homogenization.Number of Patches (NP) and Patch Density (PD) are direct indicators of the degree of fragmentation and extent of subdivision of the landscape.Landscape with greater NP has a finer grain ie.spatial heterogeneity occurs at a finer resolution.Decrease in NP values of Built-up, from 3921 to 2781 suggest the tendency of urban agglomeration in the landscape.As a result of infrastructural developments in the rural-urban fringe, isolated settlements in the periphery hasbecome more compact in the post-2000 period.Patch Density reflects the extent of landscape fragmentation and therefore crucial for landscape structure assessment.Comparison of classes with varying sizes showed decreasing PD indexes in Built-up,agricultural land and waterbody.In sharp contrast to thispheneomenon,the values of mixed vegetation increased between 2000 and 2015,indicating a high degree of fragmentation.Theinformation on the degree of fragmentationin this landscape is useful in sustainable urban planning and decision making.
Greatest Patch Area (GPA) is a measure of the degree of dominance or homogeneity of the landscape.Values of Built-up increased from 201.45664ha to 403.4ha,while agricultural lands reduced from 70.0896 to 55.69ha,waterbodies to 5.006ha and mixed vegetation from 1187.49344ha to 998.927ha, slightly consistent in areal extent.Values of Mean Patch Area for Built-up recorded a change from 11.34671 to 30.049178,increase of average patch size in the study area.Other classes in the landscape have lower values in 2015 compared to the previous decade.
Unlike Edge Density, Mean Patch shape ratio measures the average of patch shape complexity (geometry of shapes), the values of which equals 1 when the patch is maximally compact.It increases without limit as patch shape becomes more irregular. Values of Built-up class decreased from 2.213 to 1.049,indicating aggregation trends due torapid urban growth.Values of agricultural land is increases from 1.585to 2.552 on a temporal scale;an an indication of irregularity and loss of contiguity of patches.Other classes records slight variations; thereby showing stability in their distribution.
Degree of cohesion in the landscape is estimated through Landscape Division Index and it is interpreted as a probability that is expressed as: 0 ≤ LD < 1.LD achieves maximum values when the landscape is maximally subdivided.In the study area,values of LD for all classes are high (above 0.9),reflecting high degree of fragmentation of class types.Landscape Division and Effective Mesh Size (m) are complementary indices;but are expressed in different units.Mesh (m) consider patch size distribution of the class and total landscape area.Values obtained for Effective Mesh (m) for Built-up land recorded change of 205.8 ha in 2000 to 1584.5 ha in 2015;representing high degree of homogeneity among the classes considered.On the other hand, mixed vegetation class becomes more fragmented with values changing from 6806.078 ha to 957.745 ha in 2015.
International Journal of Research in Engineering & Applied Sciences
Email:- [email protected], http://www.euroasiapub.org
86
become more compact and agglomerated during the recent decade.Thus,the entire urban agglomeration represents heterogeneous patches of diverse functions.
CONCLUSION
In landscape ecological research, integration of GIS(Geographic Information System) and remote sensing techniques offer broad avenues for characterizing landscapes.They are capable of analyzing complex patterns of landscapes on spatial and temporal scale.The present study focused on the quantification of landscape structure at different scales in space and time.QuantumGIS,a Free and Open Source Software package employed in this study has the flexibility to integrate with other packages and Plugins to conduct spatial analysis at different levels.Landscape metrics computed using these open source tools provided quantitative description of the complex patterns of landscape structure changes in the urban landscape.
Results derived through the quantitative analysis showed that urban sprawl effects and uncontrolled expansion of built up cover largely influencelandscape configuration in Thiruvananthapuram Corporation.There has been a considerable amount of loss of agriculturaland vegetation areas between the 2000 and 2015, resulting in complex landscape structure and composition.The diversity and heterogeneity indices are controlled by human interference and specifically pattern of urban sprawl in the study area.Moreover, loss of greenness and increasing impervious surface density in the coastal area are critical issues which haveenvironmental consequences that has to be addressed by the urban planners an authorities.
REFERENCES:
[1]Andre B.L.,Miller,J,Ahern,J, McGarigal,K.,2012,Measuring Landscapes: A Planner's Handbook, Island Press.
[2]Chander, G. & Markham, B.,2003. Revised Landsat-5 TM radiometric calibration procedures and postcalibration dynamic ranges Geoscience and Remote Sensing, IEEE Transactions on, 41, 2674 – 2677
[3]Chelaru,D,OisteA,and Mihai,F.,2014,Quantifying the changes in landscape configuration using open source GIS. Case study: Bistritasubcarpathian valley. Published in: 14th International Multidisciplinary Scientific GeoConference on ECOLOGY, ECONOMICS, EDUCATION AND LEGISLATION SGEM 2014, Conference Proceedings , Vol. 1, : pp. 557-565 [4]Congedo,L&Munafo,M.,2012,Development of a Methodology for Land Cover Classification Validation[pdf].Rome:Sapienza University. Available at :<http://www.planning4adaptation.eu/>
[5]DasguptaA,KumarU,Ramachandra T.V.,2009,Urban landscape analysis through
Spatial Metrics, Proceedings of International Conference on Infrastructure, Sustainable Transportation and Urban Planning, (CISTUP@CiSTUP), Indian Institute of Science, Bangalore, India.
[6]Gökyer,E.,2013,Understanding Landscape Structure Using Landscape Metrics, Advances in Landscape Architecture, Dr. Murat Ozyavuz (Ed.), ISBN: 978-953-51-1167.
[7]Farina,A.,2000,Landscape ecology inaction. Kluwer Academic Publishers, Netherlands. [8]Forman,R and Godron,M.,1986,Landscape Ecology,JohnWiley& Sons,NewYork.
[9]Jung M.,2013,LecoS -A QGIS plugin for automated landscape ecology analysis. https://dx.doi.org/10.7287/peerj.preprints.116v2.
International Journal of Research in Engineering & Applied Sciences
Email:- [email protected], http://www.euroasiapub.org
87
[11]Mallick, J.; Singh, C. K.; Shashtri, S.; Rahman, A. & Mukherjee, S.,2012. Land surface emissivity retrieval based on moisture index from LANDSAT TM satellite data over heterogeneous surfaces of Delhi city International Journal of Applied Earth Observation and Geoinformation,, 19, 348 – 358
[12]McGarigal.K, Marks, B.J.,(1994), ``FRAGSTATS manual: spatial pattern analysis program for quantifying landscape structure'', http://ftp.fsl.orst.edu/pub/fragstats.2.0
[13]McGarigal, K., Cushman, S.A., Neel, M.C and Ene,E.,2002,FRAGSTATS v3: Spatial Pattern Analysis Program for Categorical Maps. Computer software program produced by the authors at the University of Massachusetts, Amherst. http://www.umass.edu/landeco/research/fragstats/fragstats.html
[14]Stejskalova,D,Karasek,P,Tlapakova,L,Podhraszka,J.,2012, Landscape Metrics as a tool for evaluation of landscape structure,a case study of Hubenovregion,CzechRepublic.Availableat:http://dx.doi.org/10.11118/actaun2013610101 93.
[15]Turner, M.G and Gardner, R.H (eds 1991), Quantitative techniques in Landscape ecology-The analysis and Interpretation of Landscape Heterogeneity, Springer,New York. [16] Turner,M.G,Gardner,R.H.,O’Neill,R.V.,2001,Landscape Ecology in Theory and Practice: Pattern and Process,Springer-Verlag,New York.