15
Bioproductive Parameters and Fatty Acids Profile of the
Meat from Broilers Treated With Flax Meal and Grape
Seeds Meal
Margareta Olteanu
*, Rodica Diana Criste, Tatiana Dumitra Panaite, Mariana Ropota,
Petru Alexandru Vlaicu, Raluca Paula Turcu
National Research-Development Institute for Animal Biology and Nutrition-IBNA-Balotesti, Calea Bucuresti, 1, Romania
Abstract
The 3-week feeding trial was conducted on 120, Cobb 500 chicks (14 days) assigned to two groups (C, E). Compared to C diet formulation (corn, wheat, soybean meal and flax meal as basic ingredients), E diet formulation also included 3% grape seeds meal as natural antioxidant. The feed intake and the gains were not significantly (P>0.05) different between groups. Six broilers/group were slaughtered in the end of the trial and 6 samples of breast and thigh meat/group were formed and assayed for the feeding value. The proportion of polyunsaturated fatty acids (PUFA) was significantly (P≤0.05) higher in group E than in group C, both for the chicken breast: 32.6±0.87g (E) vs 29.29±0.96 g/100 g total fatty acids (C), and in the thigh: 37.68±2.07g (E) vs 29.58±1.16 g/100g total fatty acids (C). The content of alfa linolenic acid (ALA) was significantly (P≤0.05) higher also in group E, both in the breast meat: 0.99±0.02g (E) vs 0.89±0.34g/100g total fatty acids (C), and in the thigh meat: 1.20±0.07g (E) vs 0.90±0.0g/100g total fatty acids (C). The omega-3 PUFA content was the highest in the breast meat sample, 2.19±0.07g/100g total fatty acids (E), with no significant (P>0.05) differences between groups.
Keywords: broiler, grape seeds meal, meat quality, natural antioxidants, PUFA
1. Introduction
The need for antioxidants, particularly natural ones, in diet formulations, with the purpose to block oxidation by their reaction with the free radicals, appeared when polyunsaturated fatty acids-rich feed ingredients were used with the aim of producing foods enriched in polyunsaturated fatty acids, particularly omega-3, which have beneficial effects on human health [1-3].
Winery by-products, such as grape pomace, grapes seeds and peels, are a natural source with a high level of polyphenols, which bestow them
* Corresponding author: Margareta Olteanu Tel: (+4021)3512082; Fax: (+4021)3512080
E-mail: [email protected]
with antioxidant capacity. The abundancy of bioactive polyphenols in these by-products [4, 5], is of real interest for many researchers from the food industry and feed additives industry. Grape seeds meals result from the cold pressing process or from the chemical extraction processes.
The literature [6-8] shows the chemical composition of the grape seeds: 86.74–89.17% dry matter; 6.26–9.01% protein, and 2.14–8.28% ash. About 60-70% of the total polyphenols content of the grapes is in the seeds, about 28-35% are in the peel and 10% in the grape pulp % [9, 10].
Several studies reported the effect of using various levels of winery by-products in broiler chicks feeding on broiler performance, protein and amino acids digestibility, intestinal microflora and meat quality [11-14].
16 from broilers which received feeds rich in polyunsaturated fatty acids, treated with grape seeds meal as natural antioxidant.
2. Materials and methods
The feeding trial was conducted in the experimental halls of the National Research-Development Institute for Animal Biology and Nutrition (IBNA-Balotesti, Romania), according to a protocol approved by the Ethics Commission of the institute. The 3-week feeding trial was
conducted on 120, Cobb 500, fast growing broiler chicks, aged 14 days, with an average initial body weight of 405.56 g/chick, assigned to two groups (C and E), with 12 cages each (5 broilers per cage). The broilers had free access to the feed and water; the light regimen was 23h/day, according to Cobb 500 management guide.
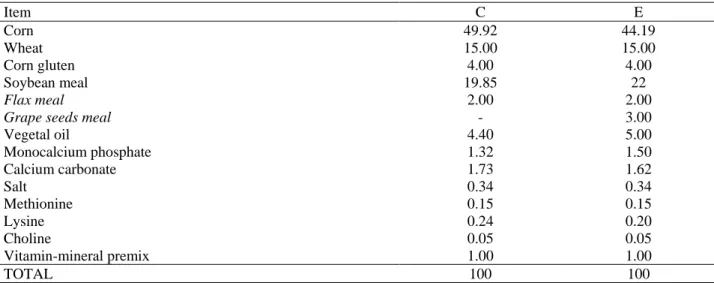
The basic formulation of the two diets (Table 1) consisted of corn, wheat, soybean meal and flax meal, which is rich in polyunsaturated fatty acids. Unlike diet C, the experimental diet (E) also included 3% grape seeds meal as natural antioxidant.
Table 1. Diet formulations
Item C E
Corn 49.92 44.19
Wheat 15.00 15.00
Corn gluten 4.00 4.00
Soybean meal 19.85 22
Flax meal 2.00 2.00
Grape seeds meal - 3.00
Vegetal oil 4.40 5.00
Monocalcium phosphate 1.32 1.50
Calcium carbonate 1.73 1.62
Salt 0.34 0.34
Methionine 0.15 0.15
Lysine 0.24 0.20
Choline 0.05 0.05
Vitamin-mineral premix 1.00 1.00
TOTAL 100 100
*
Content per kg diet: vitamin A-11000IU; vitamin D3-2000IU; vitamin E-27IU, vitamin K3-3mg; vitaminB1-2mg;
vitamin B2-4mg; pantothenic acid -14.85mg; nicotinic acid -27mg; vitamin B6-3mg; vitamin B7-0.04mg; vitamin B9
-1mg; vitamin B12-0,018mg; vitamin C-20mg; Mn-80mg; Fe-80mg; Cu-5mg; Zn-60mg; Co-0.37mg; I-1.52mg;
Se-0.18 mg, coccidiostat
Grape seeds meal samples were collected and assayed for the feeding quality and for the polyphenols content, antioxidant capacity. A single batch of feeds was manufactured for each group, for the entire feeding period; feed samples were collected and assayed for the nutritional quality.
The following parameters were monitored throughout the experimental period: initial weight (g), final weight (g), average daily compound feed intake (g/broiler/day), average daily weight gain (g/ broiler /day), feed conversion ratio (g feed/g gain).
At the end of the 3-week experimental period, at the age of 35 days, 6 broilers/group were slaughtered according to the working protocol approved by the Ethics Commission of the institute. Six samples of breast meat and 6 samples
of thigh meat were collected from each group and assayed for the proximal chemical composition and for the fat and fatty acids profile.
17 ash (Ash) by the gravimetric method, according to Regulation (CE) 152/2009 for compound feeds, and SR ISO 1442:2010 for meat, using Caloris CL 1206 furnace, calcium (Ca) by the titrimetric method, according to standard SR ISO 6491-1:2006; phosphorus (P) by photometric method, according to Regulation (CE) 152/2009, using Jasco V-530 spectrophotometer.
Fat acidity was determined by the volumetric method, according to STAS 12266: 84.
The fatty acids were determined by gas chromatography, according to standard SR CEN ISO/TS 17764 -2: 2008, using Perkin Elmer-Clarus 500 gas chromatograph, with capillary column injection system, high polarity stationary phase (BPX70: 60m x 0.25mm inner diameter and 0.25µm thick film), and high polarity cyanopril phase, which give similar resolution for different geometric isomers (THERMO TR-Fame: 120m x 0.25mm ID x 0.25µm film).
The polyphenols content from the methanol extracts, expressed as mg gallic acid equivalents/g sample (mg GAE /g sample), was determined according to the method described by Mihailovic et al. [15], modified, using Thermo Scientific UV-VIS spectrophotometer.
The antioxidant capacity if the methanol extracts, expressed as miliMols Trolox equivalents/g sample (mM TE/g sample), was determined by DPPH method, proposed by Marxen et al. [16], using Analytik Jena Specord 250 Plus UV-VIS spectrophotometer with thermostatic carousel.
Gross energy (GE) was determined by calculation, using the gross chemical analysis data and the equations developed by Burlacu et al. (2002) [17]. The experimental results are expressed as mean values±standard error; WINDOWS StatView (SAS, version 6.0) software and the analysis of variance (ANOVA and t test) were used for statistical processing of the data, the differences being considered statistically significant for P≤0.05.
3. Results and discussion
The grape seeds meal, used as antioxidant, had: 11.33±0.52% crude protein, 0.69±0.14% ether extractives, 39.51±1.21% crude fibre and 16.08±0.04 MJ/kg gross energy, values similar to those reported by Mironeasa et al. (2010) [7] and by Elagamey et al. (2013) [8].
The grape seeds meal has a varied content of fatty acids, from 57.13 g linoleic acid, to 19.13 g oleic acid or 4.51 g stearic acid/100 g total fatty acids, comparable with the results reported by Tangolar et al. (2009) [18] and Sabir et al. (2012) [19]. The average content of polyphenols was 3.86 mg±0.16 mg GAE/g sample, and the average antioxidant capacity was 34.99±1.27 mM TE/g sample.
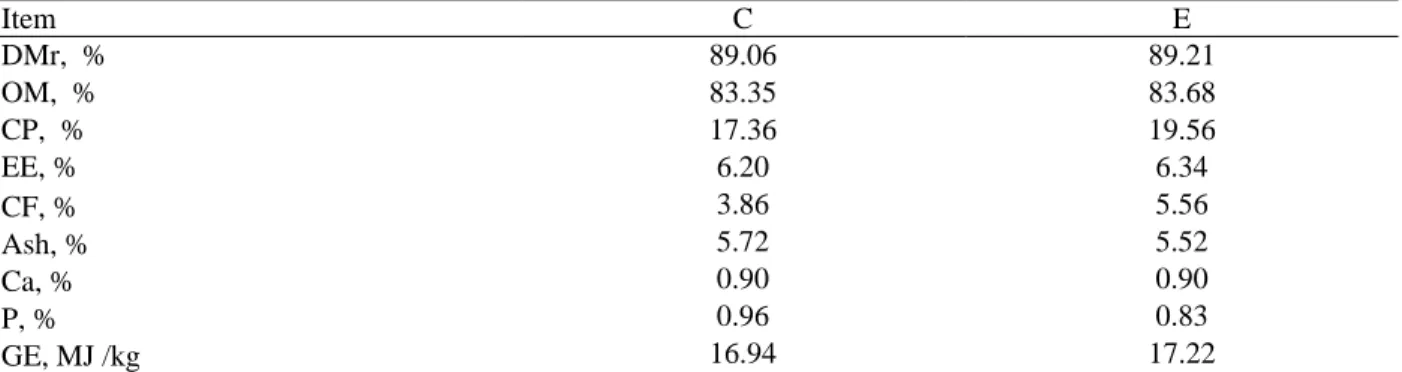
Table 2 shows a rather similar content of nutrients between the two groups, except for the protein.
Table 2. Compound feeds nutrients and gross energy content
Item C E
DMr, % 89.06 89.21
OM, % 83.35 83.68
CP, % 17.36 19.56
EE, % 6.20 6.34
CF, % 3.86 5.56
Ash, % 5.72 5.52
Ca, % 0.90 0.90
P, % 0.96 0.83
GE, MJ /kg 16.94 17.22
DMr-dry matter; CP-crude protein; EE- ether extractives; CF-crude fibre; Ash-ash, Ca-calcium, P-phosphorus, GE-gross energy
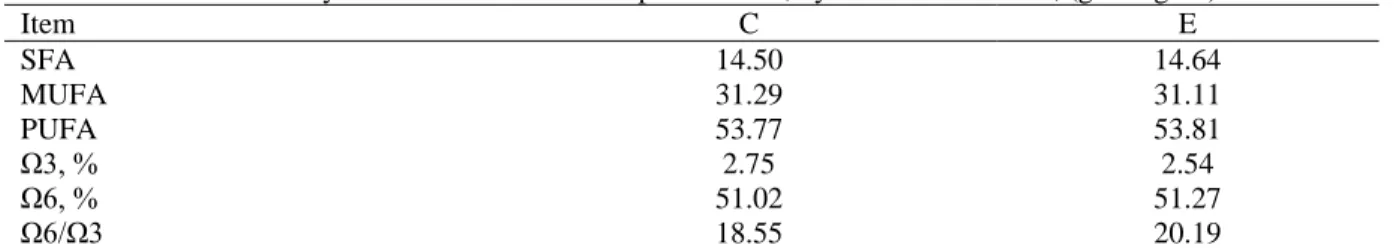
The average content of total polyunsaturated fatty acids, PUFA (Table 3) was 53.79 g/100g fat, the average content of omega-3 PUFA was 2.65
18
Table 3. Fatty acids content of the compound feeds, by level of saturation, (g/100 g fat)
Item C E
SFA 14.50 14.64
MUFA 31.29 31.11
PUFA 53.77 53.81
Ω3, % 2.75 2.54
Ω6, % 51.02 51.27
Ω6/Ω3 18.55 20.19
SFA-saturated fatty acids; MUFA-monounsaturated fatty acids; PUFA-polyunsaturated fatty acids; Ω3- omega 3
polyunsaturated fatty acids; Ω6- omega 6 polyunsaturated fatty acids.
The bioproductive parameters throughout the experimental period were slightly different between the two groups, but the differences were not statistically significant (Table 4).
The literature also reports other studies on winery by-products use in broiler feeding. Thus, Sossidou et al. (2013) [12] reported that the different levels of grape pomace: 0.25g; 0.5g and 1g/100 g broiler feed, for a period of 0-42 days, had positive effects on the average daily weight gain:
72.97±0.85 g/day/chick in the groups with 1 g grape pomace/100 feed, compared to 71.42±0.85 g/day/chick in group C.
Khodayari and Shahria (2014) [13] analysing the effect of 0, 2, 4 and 6% dietary grape pomace on broiler performance, notice that only the 2% level had a positive influence of feed intake and body weight at 42 days, with a significant difference compared to group C.
Table 4. Broiler performance throughout the experimental period (14-35 days, average values/group)
SEM–standard error of the mean; P – level at which the difference between the means is statistically significant
The values of the main nutrients in the breast and thigh meat were not significantly (P>0.05)
different between groups (Table 5).
Table 5. Level of the main nutrients in broiler meat (average values/group)
Item C E
Broiler breast meat
DMr, % 24.69±1.43 24.74±1.75
OM, % 22.55±1.23 22.56±1.30
CP, % 21.09a±1.20 21.07a ±1.10
EE, % 1.28c ±0.11 1.33c±0.30
Ash, % 1.14±0.10 1.11±0.15
GE, MJ/kg 5.56±0.35 5.57±0.4
Broiler thigh meat
DMr, % 33.97±1.91 28.67±1.36
OM, % 31.47±1.32 26.30±1.23
CP, % 17.71b ± 0.64 18.46b±0.93
EE, % 9.38d±0.84 7.39d±0.62
Ash, % 1.03±0.16 1.06±0.15
GE, MJ/kg 8.56±0.72 7.41±0.53
DMr-dry matter; CP-crude protein; EE-ether extractives; GE-gross energy; a,b–significant differences (P≤0.05) of
the protein level between the breast and thigh meat within the same group; c,d–significant differences (P≤0.05) of the
fat level between the breast and thigh meat within the same group
Item C E SEM P
Average daily feed intake, g/broiler/day 105.86±4.31 103.35±4.86 3.023 0.7013
Initial weight, g 407.58±6.14 405.54±10.42 5.8970 0.8720
Final weight, g 1876.38±36.99 1875.79±47.58 29.737 0.9370
Average daily weight gain, g/broiler/day 69.94±1.85 70.01±2.44 1.514 0.9671
19 Significant differences (P≤0.05), however, were noticed within the same group regarding the protein content, which was higher in the breast meat than in the thigh meat, by 19.08% in group C and by 14.13% in group E; the fat content was also significantly lower in the breast meat than in the thigh meat, by 86.35% in group C and by 82.00% in group E. These results are rather similar to those reported by Mridula et al. (2015)
[20], where the 2.5% flax seeds supplement to broiler diets resulted in a protein level of de 20.17±1.02% (breast), and 19.10±0.77% (thigh); a fat level of 2.55±0.21% (breast), and 5.81±0.72% (thigh) and an ash level of 1.21±0.18% (breast), and 1.20±0.20% (thigh). The acidity of breast and thigh meat fat (Table 6) was slightly lower, after 7 days of refrigeration, in group E than in group C, but with no statistically significant differences.
Table 6. Acidity of breast and thigh meat fat (mg KOH/g fat)
Item C E
Breast Day 0 23.33 22.12
Day 7 36.50 36.02
Tigh Day 0 27.73 27.73
Day 7 32.23 30.48
Table 7. Fatty acids content of the breast meat fat, depending on the level of saturation (g acid/100 g total fatty acids)
Item C E SEM P
SFA, % 29.94b±0.57 28.65a±0.89 0.312 0.0255
MUFA, % 40.18b±0.52 38.48a±1.12 0.385 0.0150
UFA, % 69.47b±0.61 70.94a±0.87 0.332 0.0148
PUFA, % of which: 29.29b±0.96 32.46a±0.87 0.595 0.0006
ALA, % 0.89b±0.34 0.99a±0.02 0.025 0.0415
Ω3, % 2.14±0.05 2.19±0.07 0.020 0.2393
Ω6, % 27.15b±0.99 30.27a±0.80 0.583 0.0006
Ω6/Ω3 12.68b±0.58 13.82a±0.19 0.227 0.0036
SFA- saturated fatty acids; MUFA- monounsaturated fatty acids; PUFA-polyunsaturated fatty acids; Ω3- omega 3 polyunsaturated fatty acids; Ω6- omega 6 polyunsaturated fatty acids; a,b – significant differences (P≤0.05) compared to C, E.
The content of polyunsaturated fatty acids (PUFA) in the fat of the breast samples (Table 7) was significantly (P≤0.05) higher, by 10.82%, in group E, treated with 3% grape seeds meal, compared to group C; the content of omega 3- PUFA was significantly (P≤0.05) higher, by 2.34%, also in group E, compared to group C. Omega 6 PUFA level was also significantly (P≤0.05) higher, by 11.49%, in group E than in group C.
The highest level of alfa linolenic acid (ALA) in the breast meat fat, 0.99±0.02 g/100g total fatty acids, was noticed in group E, but it was smaller than the value reported by Mridula et al. (2015) [20].
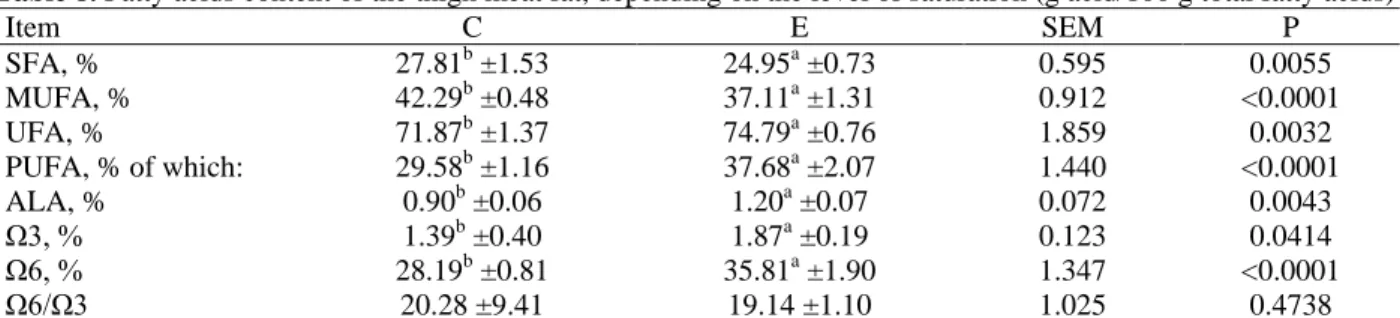
The content of total polyunsaturated fatty acids (PUFA) in the fat of the thigh samples (Table 8) was significantly (P≤0.05) higher, by 27.38%, in group E, compared to group C.
Table 8. Fatty acids content of the thigh meat fat, depending on the level of saturation (g acid/100 g total fatty acids)
Item C E SEM P
SFA, % 27.81b ±1.53 24.95a ±0.73 0.595 0.0055
MUFA, % 42.29b ±0.48 37.11a ±1.31 0.912 <0.0001
UFA, % 71.87b ±1.37 74.79a ±0.76 1.859 0.0032
PUFA, % of which: 29.58b ±1.16 37.68a ±2.07 1.440 <0.0001
ALA, % 0.90b ±0.06 1.20a ±0.07 0.072 0.0043
Ω3, % 1.39b ±0.40 1.87a ±0.19 0.123 0.0414
Ω6, % 28.19b ±0.81 35.81a ±1.90 1.347 <0.0001
Ω6/Ω3 20.28 ±9.41 19.14 ±1.10 1.025 0.4738
20 The content of omega 3-PUFA was also was significantly (P≤0.05) higher, by 34.53%, group E, compared to group C. Omega 6 PUFA level was also significantly (P≤0.05) higher, by 27.03%, in group E than in group C. The highest level of alfa linolenic acid (ALA) in the thigh meat fat, 1.20±0.02 g/100g total fatty acids, was noticed in group E, but it was smaller than the value reported by Mridula et al. (2015) [20], who reported a content of alfa linolenic acid (ALA) of 3.01±0.80% in the thigh meat of broilers treated with 2.5% flax seeds.
4. Conclusions
The use of 2% flax meal in the compound feeds for broilers enriched the omega-3 polyunsaturated fatty acids content both in the compound feeds and in the broiler meat (breast and thigh). The inclusion of 3% grape seeds meal, as natural antioxidant, in E diet formulation improved the quality of the broiler meat (breast and thigh), by inhibiting the reactions of lipid degradation, which resulted in higher proportions of total polyunsaturated fatty acids (PUFA) and omega-3 PUFA in group E compared to group C.
Acknowledgements
This paper presents part of the results obtained within project PN 1641_02.04, Contract 24 N/2016, NUCLEUS program, National Authority for Scientific Research and Innovation, Ministry of Research and Innovation.
References
1. Huang, T. L., Omega-3 fatty acids, cognitive
decline, and Alzheimer’s disease: a critical review and evaluation of the literature, J. Alzheimer’s Dis., 2010, 21, 673–90.
2. Pilkington, S.M., Watson, R.E.B., Nicolaou, A.,
Rhodes, L. E., Omega-3 polyunsaturated fatty acids:
photoprotective macronutrients, Experimental
Dermatology, 2011, DOI:10.1111/j.16000625.2011. 01294.x, www.blackwellpublishing.com/EXD.
3. Flachs, P., Rossmeisl, M., Kopecky, J., The effect
of n-3 fatty acids on glucose homeostasis and insulin sensitivity, Physiological Research, 2014, 63(1), S93-118.
4. Radovanovic, A., Radovanovic, B., Jovancicevic,
B., Free radical scavenging and bacterial activities of
southern Serbian red wines. Food Chem., 2009, 117, 326–31.
5. Granato, D., Castro, I. A., Katayama, F.C.U.,
Assessing the association between phenolic compounds and the antioxidant activity of Brazilian red wines using chemometrics, LWT Food Sci Technol, 2010, 43:1542–9.
6. Razavi, S. M. A. and Fathi, M.,
Moisture-Dependent Physical Properties of Grape (Vitis vinifera L.) Seed, The Philippine Agricultural Scientist, 2009, 92(2), 201-212.
7. Mironeasa, S., Leahu, A., Codină, G., Stroe, S.
Mironeasa C., Grape Seed: physico-chemical, structural
characteristics and oil content, Journal of
Agroalimentary Processes and Technologies, 2010, 16(1), 1-6.
8. Elagamey, A. A., Abdel-Wahab, M. A., Shima, M.
M. E., Abdel-Mogib, M., Comparative Study of Morphological Characteristics and Chemical Constituents for Seeds of Some Grape Table Varieties, Journal of American Science, 2013, 9(1), 447-454.
9. Xu, C. M., Zhang, Y. L., Wang, J., Lu, J. A.,
Extraction, distribution and characterisation of phenolic compounds and oil in grape seeds, Food Chem., 2010, 122(3), 688–694.
10. Surai, P. F., Polyphenol compounds in the
chicken/animal diet: from the past to the future,Journal of Animal Physiology and Animal Nutrition 98, 2014, 19–31 © 2013 Blackwell Verlag GmbH.
11. Viveros, A., Chamorro, S., Pizarro, M., Arija, I.,
Centeno, C., Brenes, A., Effect of dietary polyphenol-rich grape products on intestinal microflora and gut morphology in broiler chicks, Poult Sci., 2011, 90, 566-578.
12. Sossidou, E.N., Kasapidou, E., Dotas, V.,
Ioannidis, I., Mitlianga, P., Effect of grape pomace supplementation on broiler performance and eating quality. The 64th Annual Meeting of the European Federation of Animal Science (EAAP), Nantes, Franta, 26-30 augus 2013.
13. Khodayari, F., Shahria, H. A., The Effect of Red
Grape pomace on Performance, Lipid Peroxidation (MDA) and some Serum Biochemical Parameters in Broiler, Adv. Biores., 2014, 5(3), 82-87, doi: 10.15515/abr.0976- 4585.5.3.8287.
14. Lichovnikova, M., Kalhotka, L., Adam, V.,
Klejdus, B., Anderle, V., The effects of red grape pomace inclusion in grower diet on amino acid digestibility, intestinal microflora, and sera and liver antioxidant activity in broilers, Turk J Vet Anim Sci., 2015, 39, 406-412; doi:10.3906/vet-1403-64.
15. Mihailović, V., Matić, S., Mišić, D., Solujić, S., Stanić, S., Katanić, J., Stanković, N., Chemical composition, antioxidant and antigenotoxic activities of
different fractions of Gentiana asclepiadea L. roots
21
16. Marxen, K., Vanselow, K. H., Lippemeier, S.,
Hintze, R., Ruser, A., Hansen, U.P., Determination of DPPH radical oxidation caused by methanolic extracts of some microalgal species by linear regression analysis of spectrophotometric measurements, Sensors 2007, 7: 2080-2095.
17. Burlacu, G. H., Cavache, A., Burlacu, R.,
Potentialul productiv al nutreturilor si utilizarea lor. Ed. Ceres, 2002, ISBN: 973-40-0541-3.
18. Tangolar, S. G., Ozoğul, Y., Tangolar, S., Torun,
A., Evaluation of fatty acid profiles and mineral content
of grape seed oil of some grape genotypes, Int. J. Food Sci. Nutr., 2009, 60(1), 32-39.
19. Sabir, A., Unver, A., Kara, Z., The fatty acid and
tocopherol constituents of the seed oil extracted from 21 grape varieties (Vitis spp.), J Sci Food Agric., 2012, 92(9), 1982-7, doi: 10.1002/jsfa.5571.
20. Mridula, D., Kaur, D., Nagra, S.S., Barnwal, P.,