VOLUME XIV (2016), Page 39 - 54
INFORMATION QUALITY FOR FLOOD RISK REDUCTION IN SITE PLANNING: TOWN PLANNERS’ PERCEPTION
Intan Afida1, Shaharudin Idrus2 & Halimaton Saadiah Hashim3
1Department of Built Environment (PPD)
2Institute for Environment and Development (LESTARI)
UNIVERSITI KEBANGSAAN MALAYSIA
3REKARANCANG Planning and Development Consultant
Abstract
One of the main tasks of a town planner in Malaysia is to prepare a Development Proposal Report (DPR) to be submitted together with the layout plan to get planning permission from the local planning authority (LPA). Incorporation of flood risk reduction aspects in site planning in the DPR is important to allow the LPA to make good and effective planning decisions. This study examines town planners’ perception on information quality for the incorporation of flood risk reduction in site planning in the context of five town planning reference instruments, namely the Town and Country Planning Act 1976, Selayang Municipal Council Local Plan 2020, Town and Country Planning Department Planning Guidelines, Selangor Manual and Planning Guidelines 2nd Edition and DPR Manual 2nd Edition that assist them to prepare the DPR for obtaining planning permission from Selayang Municipal Council, Selangor, Malaysia, where the study was carried out. The findings show that there is a need to improve existing town planning reference instruments and access to information to generally enhance town planners planning activities and specifically improve DPR quality in the future.
INTRODUCTION
The word information has been used in many different ways to refer to different things in different circumstances. Information is the structure of any text that is capable of changing the image and reaction structure of a recipient (Cover & Thomas, 1991; Belkin & Robertson, 1976). Buckland (1991) identifies three main definitions of information: (1) information as process; (2) information as knowledge; and (3) information as thing. When information is selected, analysed, judged and organized, it can be used for informing and reduce uncertainty in decision making (Higgins, 1999; Taylor, 1986).
Institutions and individual depend on information in their daily decision making routine. Therefore, the quality of information is one of the key determinants to achieve quality decision making. Information quality can be defined as information that is fit for use by information consumers (Gustavsson & Wanstrom, 2009; Wang & Strong, 1996). According to Kahn and Strong (1998), information quality is the characteristic of information to meet or exceed customer expectations and meets user specifications or requirements. While Eppler (1999) states that information quality is the characteristic of information to meet the functional, technical, cognitive and aesthetic requirements of information producers, administrators, consumers and experts.
Information will influence the choice of decision makers and can change how the user makes decisions as well as the results (Fisher et al., 2011). It is clear that if information is wrong, decisions based upon that information might be wrong. The ‘garbage in, garbage out’ phrase often show the importance for user using quality information as a basis before any decision is taken. Decision taken without using quality information will result in mistake of action, reduced customer satisfaction, increased expenses, reduced job satisfaction, hindered business strategy, and affects operational, tactical and strategic decision making (Fisher et al., 2011; Stvilia et al., 2007).
THE IMPORTANCE OF QUALITY INFORMATION FOR TOWN PLANNERS’ DECISION MAKING
In town planning, information is needed in different planning processes and stages such as in the first stage where information is needed to identify planning problems that need to be solved. In later stages, information is needed to produce several planning alternatives and to identify positive and negative effects related to those particular planning alternatives. Information is also needed to later evaluate planning alternatives before choosing the preferred alternative and also evaluate planning alternative that has been implemented for that particular area (Wagemans, 1990). According to Han and Kim (1990), information is needed by town planners to minimize uncertainties in decision making. Town planners are responsible to provide and use quality information to help themselves make good planning decision. If poor quality information is used, it will lead to less effective planning decision making (English, 1999; Redman, 2001; Wand & Wang, 1996).
Information influences planning activities by becoming deeply set within the thoughts and practices of town planners and in that way influencing their actions. For making the best decision, town planners need quality and complete information. There are two types of information in town planning which include formal information such as various requirements of laws and planning procedures and informal information such as personal judgments, hunches, hearsay and personal experiences (Burch, Felix & Gary,1979).
According to Inness (1998), town planners will provide the decision makers with information that is based on identified planning problems. These information sources include surveys, feasibility studies, predictions, reports and studies based on calculations and scientifically validated knowledge. Town planners need to produce quality analysis in understandable formats for decision makers, who later will use the information to decide policies, plans, and related regulations (Intan Afida & Halimaton Saadiah, 2014). If the information does not meet the quality criteria, planning and decision making will have flaws and will lead to poor decision outcomes (Chengular-Smith, Ballou & Pazer, 1999; Fisher et al., 2003; Laudon & Laudon, 2012).
INFORMATION QUALITY DIMENSIONS
Information quality is generally thought of as a multi-dimensional concept with various dimension characteristics, depending on the author’s viewpoint (Klein, 2001). Information quality dimension vary depending on context (Mai 2013; Shankar & Watts, 2003) and intended use (Katerattanakul & Siau, 1999).
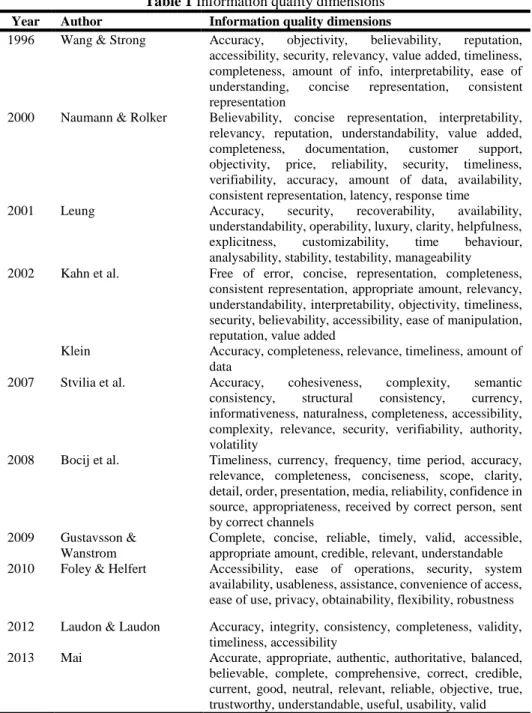
Table 1 Information quality dimensions Year Author Information quality dimensions
1996 Wang & Strong Accuracy, objectivity, believability, reputation, accessibility, security, relevancy, value added, timeliness, completeness, amount of info, interpretability, ease of understanding, concise representation, consistent representation
2000 Naumann & Rolker Believability, concise representation, interpretability, relevancy, reputation, understandability, value added, completeness, documentation, customer support, objectivity, price, reliability, security, timeliness, verifiability, accuracy, amount of data, availability, consistent representation, latency, response time
2001 Leung Accuracy, security, recoverability, availability,
understandability, operability, luxury, clarity, helpfulness, explicitness, customizability, time behaviour, analysability, stability, testability, manageability
2002 Kahn et al. Free of error, concise, representation, completeness, consistent representation, appropriate amount, relevancy, understandability, interpretability, objectivity, timeliness, security, believability, accessibility, ease of manipulation, reputation, value added
Klein Accuracy, completeness, relevance, timeliness, amount of data
2007 Stvilia et al. Accuracy, cohesiveness, complexity, semantic consistency, structural consistency, currency, informativeness, naturalness, completeness, accessibility, complexity, relevance, security, verifiability, authority, volatility
2008 Bocij et al. Timeliness, currency, frequency, time period, accuracy, relevance, completeness, conciseness, scope, clarity, detail, order, presentation, media, reliability, confidence in source, appropriateness, received by correct person, sent by correct channels
2009 Gustavsson & Wanstrom
Complete, concise, reliable, timely, valid, accessible, appropriate amount, credible, relevant, understandable 2010 Foley & Helfert Accessibility, ease of operations, security, system
availability, usableness, assistance, convenience of access, ease of use, privacy, obtainability, flexibility, robustness
2012 Laudon & Laudon Accuracy, integrity, consistency, completeness, validity, timeliness, accessibility
2013 Mai Accurate, appropriate, authentic, authoritative, balanced, believable, complete, comprehensive, correct, credible, current, good, neutral, relevant, reliable, objective, true, trustworthy, understandable, useful, usability, valid
INFORMATION QUALITY DIMENSIONS AND ATTRIBUTES USED IN THE STUDY OF SELAYANG MUNICIPAL COUNCIL, SELANGOR, MALAYSIA
Table 2 below summarizes the information quality dimensions and attributes used by the researcher in the study of five town planning reference instruments used in Selayang Municipal Council, Selangor, Malaysia.
Table 2 Information quality dimensions used in this study Information quality dimensions Attributes
Believability Believable
Reputation The reputation of the information source
The reputation of information
Accuracy Accurate in context
Content error-free
Format error-free
Completeness Detail explanation
Various scope
Relevancy Relevant to context
Usable
Ease of understanding Easily understood
Clear explanation
Accessibility Accessible format
Easy to find
Available
Timeliness Up to date
Concise representation Well presented
Well formatted
Compact
Aesthetically pleasing Consistency representation Compatible with other sources
Consistently formatted
Value added Add value to operation
Appropriate amount Amount of information
FLOOD RISK REDUCTION ASPECTS USED IN THE STUDY OF SELAYANG MUNICIPAL COUNCIL, SELANGOR, MALAYSIA
Table 3 Flood risk reduction aspects and elements Flood Risk Reduction Aspect Flood Risk Reduction Elements
Hazard Flood risk location
Frequencies of flood occurrence
Flood magnitude including duration time of flood occurrence, flood water depth, flood water velocity, rate of flood water rises and flood water quality
Factors influencing flood hazard
Vulnerability Total people exposed to flood
Total and value of property exposed to flood
Environmental effects due to flood
Vulnerability level of people to flood
Vulnerability level of property to flood
Factors influencing vulnerability of people and property to flood hazard
Source: Department for International Development, 2012; Hawkesbury-Nepean Floodplain Management Steering Committee 2006; Schanze, 2006; United Nations Development Programme, 2010; Wang, 2012; Yan, 2010
METHODOLOGY
This study adopted a quantitative approach where postal survey method was used to obtain data from respondents. This method was selected as it could easily reach respondents living in different geographical areas, protect the confidentiality of respondents and also give sufficient amount of time to respondents to think and make reference before completing the questionnaires (Creswell, 2014; Gray 2011; Lodico et al., 2010). Simple random sampling technique was used to select the respondents from the name list of town planners who prepared the selected DPR used in this study by using the aid of random number generator software by StatTrek.com. Sixty Malaysian Town Planners, whom their DPRs for lowland area developments and which received planning permissions from Selayang Municipal Council, Selangor, Malaysia from the year 2012 to 2014 were chosen as samples in this study.
Two academicians validated the questionnaire that was prepared by the researcher on the aspects of the questionnaire construct and content. A pilot study was conducted on six Malaysian Town Planners (not included as samples), equivalent to 10% of the total respondents as suggested by a previous study (Connelly, 2008). The pilot study was conducted to check the suitability of questionnaire and problems faced by the respondents during answering the questionnaire. Amendments on a few questions in the questionnaire, such as sentences style and addition of detailed definitions were done after feedbacks were received from four of the respondents.
56.7%. Even though the response rate of 50% is acceptable for postal survey method (Creswell, 2014), the researcher wanted to maximize the response rate for this study. A new questionnaire with a reminder was sent out to the balance of 26 respondents on day eleven and they were given seven days (2nd round with reminder) to complete and return it to the researcher. Fifteen out of 26 respondents returned the questionnaires. Altogether, the researcher managed to get back 49 questionnaires with a response rate of 81.7%.
The questionnaire consists of six parts namely Part A to Part F. For the purpose of this paper, only two parts in the questionnaire, which is Part A and Part E, will be discussed. Part A is related to town planners’ demographic background and Part E is related to town planners’ perception on information quality on the incorporation of flood risk reduction in site planning in five town planning reference instruments in helping them to prepare the DPR for planning permission in Selayang Municipal Council, Selangor, Malaysia.
Four (4) questions in Part A and one (1) question in Part E (with 24 sub-questions) were discussed in this paper. All questions in Part A discussed are close-ended questions using multiple choice answers and all questions in Part E are close-ended questions using 4 point likert scale, namely absolutely disagree, disagree, agree and absolutely agree. Because this is a 4-point likert scale, the data was analyzed as ordinal data (Bishop & Herron, 2015; Blaikie, 2003; Jamieson, 2004).
Internal consistency was sought for likert type questions to determine the reliability of the questions used and measured using Cronbach’s Alpha value. Cronbach’s Alpha value was calculated for each information quality dimension that has more than one attribute (Klein, 2001). Cronbach’s Alpha values that were obtained for the five town planning reference instruments are between 0.75 to 0.97, which are in category of acceptable to very good (George & Mallery, 2003). This means that the questions are reliable to measure information quality dimensions consistently.
Data was analysed using IBM SPSS Software Version 21. Descriptive statistical analysis has been employed to get the results.
RESULTS
Town Planners’ Demographic Background
experience in this area, followed by 18.3% with 11 to 15 years of working experience and 18.4% have more than 15 years of working experience.
Town Planners’ Perception on Information Quality on Incorporation of Flood Risk Reduction in Site Planning
The comparison between levels of agreement on information quality on the incorporation of flood risk reduction in site planning for five town planning reference instruments are shown in Table 4. Top three information quality attributes according to levels of agreement for each town planning reference instruments are as in Table 5.
All town planning reference instruments share the same absolutely agree responses for reputation of information and reputation of information sources. Other than that, top three information quality attributes stated with absolutely
agree responses for each town planning reference instruments include content
free-error, add value to operation and aesthetically pleasing (Table 5).
Four out of five town planning reference instruments share the same
agree responses for the same information quality attributes, the reputation of
information where the respondents felt confidence with the validity of related information in each document and reputation of information sources where they felt confidence from where the related information come from (Table 5).
Three town planning reference instruments namely Town and Country Planning Act 1976, Selangor Manual and Planning Guidelines 2nd Edition and DPR Manual 2nd Edition have the same disagree responses for they are easy to find where the respondents felt that the related information is hard to get from the town planning reference instruments. Other than that, top three information quality attributes stated with disagree responses for each town planning reference instruments are easily understood where the respondents felt that related information are not explained clearly; various scope where the respondents felt that related information are not variety enough; detail explanation where they felt that the information are not explained thoroughly; accurate in context where they felt that related information are not explained according to context, consistently formatted where they felt that related information are not presented in consistent format; compatible with other sources where they felt that related information are not suitable to be used together with other information from different sources; well-presented where they felt that related information are not presented properly; well formatted where they felt that related information are not presented using appropriate format; available where they felt that related information do not exist; and accessible format where they felt that related information are not prepared in easy form to use format (Table 5).
Four town planning reference instruments other than Town and Country Planning Act 1976 have the same top three information quality attributes with
respondents felt that related information is not sufficient; various scope where they felt that related information is not varied enough; and detail explanation where they felt that the related information is not explained thoroughly (Table 5). From the summary above, it can be seen that the information quality attributes that get the most positive responses (agree and absolutely agree) for all town planning reference instruments are reputation of information and reputation of information sources while information quality attributes that get the most negative responses (disagree and absolutely disagree) for all town planning reference instruments are that they are easy to find, amount of information, various scope and detail explanation (Table 4 and Table 5).
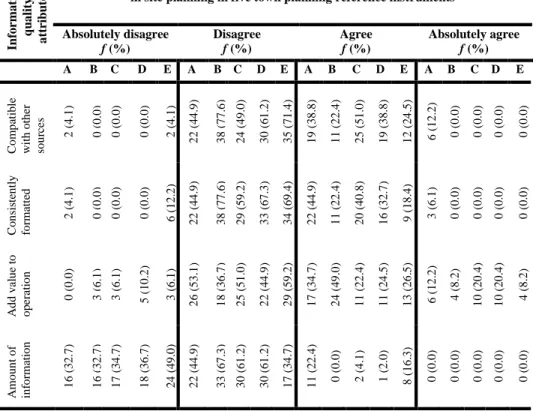
Table 4 Comparison of levels of agreement on information quality for incorporation of flood risk reduction in site planning in five town planning reference instruments
In fo r ma ti o n q u a li ty a tt ri b u te
s Levels of agreement onin site planning in five town planning reference instruments information quality for incorporation of flood risk reduction
Absolutely disagree
f (%)
Disagree
f (%)
Agree
f (%)
Absolutely agree
f (%)
A B C D E A B C D E A B C D E A B C D E
B el ie v ab le 0 ( 0 .0 ) 0 ( 0 .0 ) 0 ( 0 .0 ) 0 ( 0 .0 ) 1 ( 2 .0 ) 3 ( 6 .1 ) 3 3 ( 6 7 .3 ) 2 7 ( 5 5 .1 ) 3 0 ( 6 1 .2 ) 1 2 ( 2 4 .5 ) 2 8 ( 5 7 .1 ) 1 5 ( 3 0 .6 ) 2 1 ( 4 2 .9 ) 1 7 ( 3 4 .7 ) 3 6 ( 7 3 .5 ) 1 8 ( 3 6 .7 ) 1 ( 2 .0 ) 1 ( 2 .0 ) 2 ( 4 .1 ) 0 ( 0 .0 ) Th e re p u ta ti o n o f th e in fo rm at io n so u rc
e 0
In fo rma ti o n q u a li ty a tt ri b u te
s Levels of agreement onin site planning in five town planning reference instruments information quality for incorporation of flood risk reduction
Absolutely disagree
f (%)
Disagree
f (%)
Agree
f (%)
Absolutely agree
f (%)
A B C D E A B C D E A B C D E A B C D E
C o m p at ib le w it h o th er so u rc es 2 ( 4 .1 ) 0 ( 0 .0 ) 0 ( 0 .0 ) 0 ( 0 .0 ) 2 ( 4 .1 ) 2 2 ( 4 4 .9 ) 3 8 ( 7 7 .6 ) 2 4 ( 4 9 .0 ) 3 0 ( 6 1 .2 ) 3 5 ( 7 1 .4 ) 1 9 ( 3 8 .8 ) 1 1 ( 2 2 .4 ) 2 5 ( 5 1 .0 ) 1 9 ( 3 8 .8 ) 1 2 ( 2 4 .5 ) 6 ( 1 2 .2 ) 0 ( 0 .0 ) 0 ( 0 .0 ) 0 ( 0 .0 ) 0 ( 0 .0 ) C o n si st en tl y fo rmat te d 2 ( 4 .1 ) 0 ( 0 .0 ) 0 ( 0 .0 ) 0 ( 0 .0 ) 6 ( 1 2 .2 ) 2 2 ( 4 4 .9 ) 3 8 ( 7 7 .6 ) 2 9 ( 5 9 .2 ) 3 3 ( 6 7 .3 ) 3 4 ( 6 9 .4 ) 2 2 ( 4 4 .9 ) 1 1 ( 2 2 .4 ) 2 0 ( 4 0 .8 ) 1 6 ( 3 2 .7 ) 9 ( 1 8 .4 ) 3 ( 6 .1 ) 0 ( 0 .0 ) 0 ( 0 .0 ) 0 ( 0 .0 ) 0 ( 0 .0 ) A d d v al u e to o p er at io n 0 ( 0 .0 ) 3 ( 6 .1 ) 3 ( 6 .1 ) 5 ( 1 0 .2 ) 3 ( 6 .1 ) 2 6 ( 5 3 .1 ) 1 8 ( 3 6 .7 ) 2 5 ( 5 1 .0 ) 2 2 ( 4 4 .9 ) 2 9 ( 5 9 .2 ) 1 7 ( 3 4 .7 ) 2 4 ( 4 9 .0 ) 1 1 ( 2 2 .4 ) 1 1 ( 2 4 .5 ) 1 3 ( 2 6 .5 ) 6 ( 1 2 .2 ) 4 ( 8 .2 ) 1 0 ( 2 0 .4 ) 1 0 ( 2 0 .4 ) 4 ( 8 .2 ) A mo u n t o f in fo rmat io n 1 6 ( 3 2 .7 ) 1 6 ( 3 2 .7 ) 1 7 ( 3 4 .7 ) 1 8 ( 3 6 .7 ) 2 4 ( 4 9 .0 ) 2 2 ( 4 4 .9 ) 3 3 ( 6 7 .3 ) 3 0 ( 6 1 .2 ) 3 0 ( 6 1 .2 ) 1 7 ( 3 4 .7 ) 1 1 ( 2 2 .4 ) 0 ( 0 .0 ) 2 ( 4 .1 ) 1 ( 2 .0 ) 8 ( 1 6 .3 ) 0 ( 0 .0 ) 0 ( 0 .0 ) 0 ( 0 .0 ) 0 ( 0 .0 ) 0 ( 0 .0 ) n= 49
A= Town and Country Planning Act 1976; B= Selayang Municipal Council Local Plan 2020; C= Town and Country Planning Department Planning Guidelines; D= Selangor Manual and Planning Guidelines 2nd Edition;
E= DPR Manual 2nd Edition
Table 5 Top three information quality attributes according to levels of agreement for each town planning reference instrument
Levels of agreement Top three information quality
attributes Town and Country Planning Act 1976
Absolutely agree Reputation of information (63.3%),
reputation of information source (63.3%) and content free-error (59.2%)
Agree Accurate in context (69.4%), up to date
(63.3%) and believable (57.1%)
Disagree Various scope (69.4%), easy to find
(63.3%) and detail explanation (61.2%)
Absolutely disagree Amount of information (32.7%), usable
(26.5%)
Levels of agreement Top three information quality attributes
Absolutely agree Reputation of information (18.4%),
reputation of information source (18.4%) and add value to operation (8.2%)
Agree Reputation of information source
(77.6%), reputation of information (69.4%) and add value to operation (49.0%)
Disagree Accurate in context (83.7%),
consistently formatted (77.6%) and compatible with other sources (77.6%)
Absolutely disagree Detail explanation (42.9%), various
scope (36.7%)
and amount of information (32.7%) Town and Country Planning Department Planning Guidelines
Absolutely agree Reputation of information (20.4%), add
value to operation (20.4%) and reputation of information source (18.4%)
Agree Reputation of information source
(79.6%), reputation of information (77.6%) and format error-free (46.9%)
Disagree Well presented (77.6%), well formatted
(77.6%) and available (71.4%)
Absolutely disagree Amount of information (34.7%), various
scope (32.7%) and detail explanation (30.6%)
Selangor Manual and Planning Guidelines 2nd Edition
Absolutely agree Reputation of information (24.5%), add
value to operation (20.4%) and reputation of information source (16.3%)
Agree Reputation of information source
(81.6%), reputation of information (69.4%) and aesthetically pleasing (57.1%)
Disagree Well presented (75.5%), easy to find
(71.4%) and well formatted (71.4%)
Absolutely disagree Amount of information (36.7%), detail
explanation (26.5%) and various scope (20.4%)
DPR Manual 2nd Edition
Absolutely agree Reputation of information (16.3%),
reputation of information source (16.3%) and aesthetically pleasing (12.2%)
Agree Aesthetically pleasing (81.6%),
Levels of agreement Top three information quality attributes
and reputation of information source (69.4%)
Disagree Easily understood (79.6%), easy to find
(75.5%) and accessible format (75.5%)
Absolutely disagree Amount of information (49.0%), various
scope (36.7%) and detail explanation (34.7%)
n= 49
CONCLUSION
REFERENCES
Banzhaf, E. Kindler, A., Muller, A., Metz, K. Reyes-Paecke, S. & Weiland, U. (2012). Land-use change, risk and land-use management. In D. Heinrichs (Ed) Risk Habitat Megacity, (127-154). Berlin: Springer-Verlag.
Belkin, N. & Robertson, S. (1976). Information science and the phenomena of information. Journal of the American Society for Information Science, 27(4), 197-204.
Bishop, P. A. & Herron, R. L. (2015). Use and misuse of the likert item responses and other ordinal measures. International Journal of Exercise Science, 8(3), 297-302.
Blaikie, N. (2003). Analyzing Quantitative Data from Description to Explanation. London: SAGE Publications.
Bocij, P., Greasley, A., & Hickie, S. (2008). Business Information Systems: Technology, Development and Management for the e-Business. Harlow: Financial Times Prentice Hall.
Buckland, M. (1991). Information as thing. Journal of the American Society for Information Science, 42(5), 351-360.
Burch, J.G., Felix R.S. & Gary, G. (1979). Information Systems: Theory and Practice. New York: John Wiley & Sons.
Chengular-Smith, I. N., Ballou, D., & Pazer, H. L. (1999). The impact of data quality information on decision making: An exploratory analysis. IEEE Trans. Knowl Data Eng, 11, 6. Connelly, L. M. (2008). Pilot studies. Medsurg Nursing, 17(6), 411-413.
Cover, T. & Thomas, J. (1991). Elements of Information Theory. New York: Wiley.
Creswell, J. W. (2014). Educational Research: Planning, Conducting and Evaluating Quantitative and Qualitative Research. Harlow: Pearson Education Limited.
Department for International Development. (2012). Multi Hazard Disaster Risk Assessment (v2). United Kingdom: Department for International Development.
English, L. (1999). Improving Data Warehouse and Business Information Quality. New York: Wiley & Sons.
Eppler, M. (1999). Quality standard - An instrument for securing the information quality in multimedia productions, MERX, O. (Ed). In Multimedia Projects, Berlin: Springer-Verlag, 129-148.
Fisher, C., Chengular-Smith, I. N. & Ballou, D. P. (2003). The impact of experience and time on the use of data quality information in decision making. Inform Syst Res, 14(2), 170-188. Fisher, C., Lauria, E., Chengalur-Smith, S. & Wang, R. (2011). Introduction to Information Quality.
USA: Author House.
Foley, O. & Helfert, M. (2010). Information quality and accessibility. In T. Sobh (Ed) Innovations and Advances in Computer Sciences and Engineering, (477-481). Springer Science+Business Media B. V.
George, D. & Mallery, P. (2003). SPSS for Windows step by step: A simple guide and reference. 11.0 update (4th ed.). Boston: Allyn & Bacon.
Gray, D. E. (2011). Doing Research in the Real World. London: SAGE Publications.
Gustavsson, M. & Wanstrom, C. (2009). Assessing information quality in manufacturing planning and control processes. International Journal of Quality & Reliability Management, 26(4), 325-340.
Han, S.Y. & Kim T.J. (1990). Intelligent urban information systems: Review and prospects. In
Expert Systems: Applications to Urban Planning. New York: Springer-Verlag. 241-264. Hawkesbury-Nepean Floodplain Management Steering Committee. (2006). Managing Flood Risk Through Planning Opportunities: Guidance on Land Use Planning in Flood Prone Areas. New South Wales: Department of Natural Resources NSW.
Inness, J.E. (1998). Information in communicative planning. American Planning Association Journal, 64(1), 52-63.
Intan Afida Mohamad Amin & Halimaton Saadiah Hashim. (2014). Disaster risk reduction in Malaysian urban planning. Planning Malaysia: Journal of the Malaysian Institute of Planners, XII, 35-58.
Jamieson, S. (2004). Likert scale: how to (ab) use them. Medical Education, 38(12), 1212-1218. Kahn, B. K. & Strong, D. M. (1998). Product and service performance model for information
Quality: An update. In Chengalur-Smith, I. N and Pipino, L. L. Proceedings of the 1998 Conference on Information Quality, Cambridge: Massachusetts Institute of Technology. Kahn, B. K., Strong, D. M. & Wang, R. Y. (2002). Information quality benchmarks: Product and
service performance. Communications of the ACM, 45:4, 84-192.
Katerattanakul, P. & Siau, K. (1999). Measuring information quality of web sites: Development of an instrument. Proceedings of the 20th International Conference on Information Systems,
North Carolina, United States. 279-285.
Klein, B. D. (2001). User perceptions of data quality: Internet and traditional text sources. The Journal of Computer Information Systems, 41(4), 9-15.
Klein, B. D. (2002). When do users detect information quality problems on the World Wide Web?
American Conference in Information Systems, 2002. 1101.
Laudon, K. C. & Laudon, J. P. (2012). Management Information Systems Managing the Digital Firm. 12th Edition. Boston: Prentice Hall.
Leung, H. K. N. (2001). Quality metrics for intranet applications. Information & Management, 38:3, 137-152.
Lodico, M. G., Sapulding, D. T. & Voegtle, K. H. (2010). Methods in Educational Research: from Theory to Practice. New York: John Wiley & Sons.
Mai, J. E. (2013). The quality and qualities of information. Journal of the American Society for Information Science and Technology, 64(4), 675-688.
Naumann, F. & Rolker, C. (2000). Assessment methods for information quality criteria.
Proceedings of 5th International Conference on Information Quality. 148-162.
Redman, T. C. (2001). Data Quality The Field Guide. Digital Press.
Schanze, J. (2006). Flood Risk Management-A Basic Framework. In J. Schanze et al. (Eds). Flood Risk Management: Hazards, Vulnerability and Mitigation Measures, (1–20). Netherlands: Springer.
Shankar, G. & Watts, S. (2003). A relevant, believable approach for data quality assessment. Proceedings of 8th International Conference on Information Quality. 178-189.
Stvilia, B., Gasser, L., Twidale, M. B. & Smith, L. C. (2007). A framework for information quality assessment. Journal of the American Society for Information Science and Technology, 58(12), 1720-1733.
Taylor, R. (1986). Value-Added Processes in Information Systems. Norwood: Ablex Publishing. United Nations Development Programme. (2010). Disaster Risk Assessment. New York: Bureau for
Crisis Prevention and Recovery, United Nations for Development Programme.
Wagemans, M.C.H. (1990). Analysis of the role of information in planning: The case of town and country planning. Knowledge, Technology and Policy, 3(4), 72-90.
Wand, Y. & Wang, R. Y. (1996). Anchoring data quality dimensions in ontological foundations.
Communications of the ACM, 39(11), 86-95.
Wang, J. J. (2012). Integrated model combined land-use planning and disaster management: the structure, context and contents. Disaster Prevention and Management, 21(1), 110-123. Wang, R. Y. & Strong, D. M. (1996). Beyond accuracy: What data quality means to data consumers.
Journal of Management Information Systems, 12(4), 5-33.