Hungarian Association of Agricultural Informatics European Federation for Information Technology in Agriculture, Food and the Environment
Journal of Agricultural Informatics. Vol. 8, No. 1 journal.magisz.org
Assessment of the milking machine parameters using a computer driven test
system
Roşca Radu1, Ţenu Ioan2, Cârlescu Petru3
I N F O
Received 22 Aug. 2016 Accepted 5 Dec. 2016
Available on-line 15 Mar. 2017 Responsible Editor: M. Herdon
Keywords:
mechanical milking, teatcup, pressure sensor, force sensor, liner.
A B S T R A C T
The purpose of the paper is the development and evaluation of a computer driven system for the assessment of the mechanical milking machines. The tests were performed with the WestfaliaSurge Classic Pro liner and the WestfaliaSurge Classic liner, at pulsation rates of 50, 55 and 60 cycles/min and pulsation ratios of 60/40 and 50/50, at a vacuum level of 40 kPa (61.3 kPa absolute pressure). The recorded data was used to evaluate the durations of the pulsation phases, the teat-liner contact pressure, the pressure difference at which the liners starts to close and the time the liner is open and respectively closed. The experimental results confirmed the functionality of the system; differences were recorded between the theoretical (set) pulsation rates and the real ones (which are lower); for most of the regimes (10 of the 12 tested), the relative differences did not exceed 5%. As far as the pulsation ratio was concerned, the relative differences between the values prescribed by the computer software and the recorded ones were lower than 3% for 10 of the 12 variants. The results concerning the other pulsation characteristics were in accordance with the results reported by other authors, with the lowest contact pressures being recorded for the ClassicPro liner.
1. Introduction
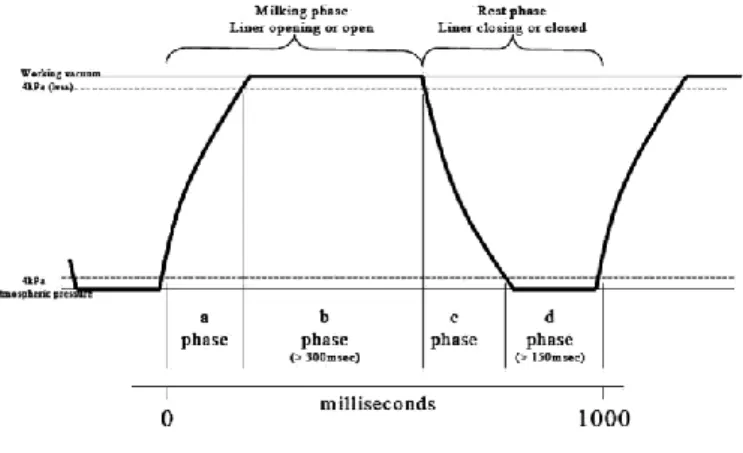
The principle of mechanic milking is based on the pressure difference between the udder and the vacuum applied to the teat. In order to limit the development of congestion and edema and provide relief to the teat from the milking vacuum, the pulsation principle is used (Mein, Williams, Thiel, 1987); the ISO 3918: 2007 standard defines pulsation as the cyclic opening and closing of the teatcup liner. Collapse of the teatcup liner beneath the teat is achieved when air at atmospheric pressure is admitted into the pulsation chamber of the teatcup; the liner opens, allowing the extraction of milk, when vacuum is applied to the pulsation chamber. Figure 1 presents the typical pulsation cycle and phases, defined according to the ISO 5707: 2007: a is the increasing vacuum phase, b is the maximum vacuum phase, c is the decreasing vacuum phase and d is the minimum vacuum phase. The pulsation ratio is defined as the ratio between the duration of the a + b phases and the duration of the entire cycle.
According to Bade, Reinemann, Zucali, Ruegg & Thompson (2009), the pulsation rate and ratio, the vacuum level and the compressive load applied to the teat when the liner collapses are the factors affecting the peak milk flow rate: the flow rate increases when the vacuum applied to the teat end and the duration of the b phase increases; in the meantime, the liner compression should increase in order
1 Roşca Radu
University of Agricultural Sciences and Veterinary Medicine Iaşi [email protected]
2 Ţenu Ioan
University of Agricultural Sciences and Veterinary Medicine Iaşi
3 Cârlescu Petru
to relieve tissue congestion due to the higher milking vacuum. Adley & Butler (1994) stated that inadequate liner collapse could lead to high infection levels. Mein & Reinemann (2009) also concluded that the liner compression should increase when the milking vacuum is increased, but also mentioned that an increased liner compression has a negative effect over the teat-end condition, leading to the development of teat-end hyperkeratosis; they also showed that an increased duration of the b phase led to a higher peak milk flow rate.
Figure 1. The pulsation cycle4
In a paper presented at the NMC 47th Annual Meeting by Kochman, Laney & Spencer the
importance of the c phase was emphasized; the authors stated that, for a shorter c phase, the increased closing speed of the liner could cause physical discomfort to the cow, with negative results over the milking performance.
Billon & Gaudin (2001) showed that the milking time and milk flow rates were affected by the duration of the a and c phases; shorter phases led to longer milking times and lower flow rates.
All these facts emphasize the importance of developing measuring systems in order to evaluate the vacuum level, the phases of the pulsation cycle and the liner-teat contact pressure. The ISO 6690:2006 standard imposes a minimum sample rate of 100 Hz for the test of pulsators.
Reinemann, Rasmussen & Mein (2001) used Px139 low cost, amplified output, absolute pressure transducers in order to measure the vacuum levels in milking machines. These sensors used the bending membrane principle for measuring pressure; a thin conductive layer was applied over the membrane and the resistance of the conductive layer changed when the membrane was bended. The response time of the sensors was less than one ms. In order to evaluate the pulsation characteristics, the pressure sensor was connected to the short pulse tube. The vacuum level was measured at the teat end and claw. The authors concluded that, because the claw is easy to access, for routine field investigations the milking vacuum should be measured here; for measuring the vacuum in the short milk tube, the vacuum sensor should be located very near to the measuring point. Sensors based on the same principle (MICRO SWITCH 141PC15GL, 1 ms response time) were used by Spencer & Jones (2000) for measuring vacuum in the milking system.
The measurement of the liner-teat contact pressure rises at least two problems: what type of teat (artificial or live excised teat) and what type of pressure transducer should be used. Davis, Reinemann & Mein (2001) used an excised teat tip and a load cell in order to measure the compressive load over a sensor with different coverings; Reinemann, Mein & Muthukumarappan (1994) used an extruded clay ribbon, a flat tube and an excised teat and also an artificial teat equipped with a pressure sensor in order to measure the compressive load applied by the collapsed liner; Adley & Butler (1994) also developed and artificial teat, equipped with a load cell, loaded by a free piston and covered with a thin latex tube; van der Toll, Schrader & Aernouts (2010) showed that artificial teat was subjected to higher compression loads compared with an actual teat, because of the rigidity of the former. From this point of view, excised live teats are expected to provide more realistic results when compared to
the artificial ones, because it is rather difficult to extrapolate the results from an artificial teat to a real one; on the other hand, even when an excised teat is used, due to the large variety of existing animals, it is also difficult to extrapolate the results obtained in this manner; moreover, in the every day life, the use of an excised teat can not be regarded as a common practice for field testing of the milking machines.
It is obvious that both these methods cannot be applied to live animals; in this case only the use of a specially prepared liner, containing a pressure sensor can be taken into account; Gates and Scott (1986) measured the compressive load with the help of a pressure transducer mounted inside the wall of the liner.
Referring to the pressure transducer, many researches consider that the maximum contact pressure is applied to the apex of the teat, but it is difficult to mount a pressure sensor in this area, so that the general practice is to place the sensor on the lateral surface of the teat. Mainly two types of devices were considered for measuring the liner-teat contact pressure: load cells and transducers based on a flexible pressure-sensitive layer. For the first type of sensor, the load cell is placed inside an artificial teat (covered with latex – Adley & Butler, 1994 - or even with an excised artificial teat – Davis, Reinemann & Mein, 2001) and the pressure from the liner-teat interface is applied to the load cell by the means of a circular piston (Adley & Butler, 1994) or of different sensor coverings (Davis, Reinemann & Mein, 2001). The friction forces between the piston and its bore affect the compressive load transmitted to the load cell; the relatively significant cost of the load cell is also a disadvantage. For the second type of sensors, while some authors (Reinemann, Mein & Muthukumarappan, 1994) concluded that the use of a flexible pressure-sensitive layer is not an accurate measuring method, others, like van der Toll, Schrader & Aernouts (2010), used it in order to measure the pressure at the teat-liner interface and concluded that the horizontal shear forces did not degrade the sensor’s pressure readings. This method has some advantages: the sensor is easily applied on the surface of the artificial teat and does not disturb the pressure distribution because it is thin; the sensors are relatively cheap; the signal conditioning circuit is a very simple one.
Demba, Elsholz, Ammon & Rose-Meierhöfer (2016) used pressure-indicating films in order to measure the contact pressure distribution. Under pressure red patches appear on the film and the density of the color indicates the pressure level. The films were applied on both rigid and flexibile artificial teats. A dedicated software was then used in order to analyze the pressure distribution. The authors reported significantly higher contact pressures (70 to 640 kPa) than those found in other investigations.
It is obvious that some of the above-mentioned methods (live excised teat, liner with pressure transducer, pressure-indicating films) are difficult to apply outside an adequate research laboratory. Taking into account this matter, the general objective of the study is to present and evaluate a relatively cheap computer driven test system, which can be used outside a specialized test laboratory in order to measure the working parameters of the mechanical milking system. The system may also be used in field conditions in order to study the effect of the pulsation characteristics (rate and ratio) over the cows’ health and milk yield.
2. DEVELOPMENT OF THE TEST SYSTEM
The developed system consists of two parts:
- a computer controlled impulses generator, completed with an electromagnetic pulsator, which can be used to test the teatcup liner in different working conditions (pulsation rates and ratios);
- a pressure recording system, used for monitoring the claw vacuum, the short pulse tube vacuum and the liner-teat contact pressure. An artificial teat, according to the specifications of the ISO 6690 standard, equipped with a force transducer, was used for recording the contact pressure between the collapsed teatcup liner and the artificial teat.
2.1. The computer controlled impulses generator
of the computer software and electronic hardware; a slider valve type electromagnetic pulsator was used in this study.
The electronic hardware consists of a control board with 14 ports, produced by PC Control Ltd.5,
connected to the USB port of the computer; only the first two ports were used for the command of the electromagnetic pulsator.
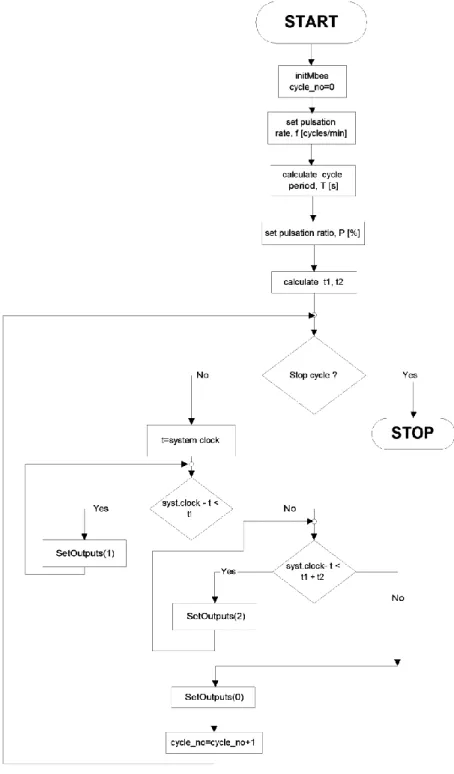
The computer software is written in Visual Basic 6 and allows the adjustment of the pulsation rate and ratio; the flowchart of the program is presented in Figure 2. The program uses a dynamic link library (mb.dll), which encapsulates the functions needed for the communication with the control board across the USB interface.
Figure 2. Flowchart of the computer program
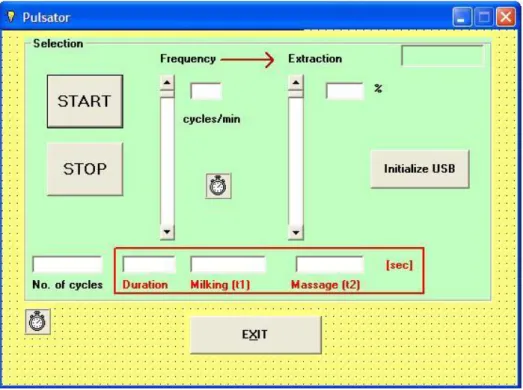
As shown in Figure 2, the program uses the system clock in order to calculate the milk extraction time and the duration of the rest phase, starting from the set pulsation rate and ratio. The graphical user interface (GUI, Figure 3) of the program is used to set the cycle rate f [cycles/min] and the pulsation ratio, P [%]. The pulsation ratio may be adjusted between 10 and 90% and the pulsation rate may be adjusted in the range 10 – 120 cycles/min.
Figure 3. The GUI of the computer program
It should be mentioned that the pulsation ratio defined here is the ratio between the time while the coil of the pulsator is energized and the pulsation cycle duration, T; as it will be shown later, differences were recorded between this value (also called pulsator ratio) and the one defined according to the ISO 5707:2007 standard, which takes into account the intermittent vacuum signal recorded into the pulsation chamber or short pulse tube.
2.2. The pressure recording system
The computer controlled pressure recording system consists of:
- absolute pressure transducers type SPD015AAsil (SMARTEC6), with analogical output and the
absolute pressure range between 15 and 102 kPa, which are used for sensing the claw vacuum inside and the intermittent vacuum into the short pulse tube of the teatcup. The sensors are based on the same principle as the ones used by Reinemann, Rasmussen & Mein (2001) and have the same response time – 1 ms.
- a data acquision board type USB6009 (National Instruments), with a sample rate of 48 ksamples/s and 4 differential analog input channels.
- an artificial teat, manufactured according to the specifications of the ISO 6690 standard (Figure 4), equipped with an A201 FlexiForce (Tekscan) type force transducer, with a diameter of the sensing area of 9.53 mm.
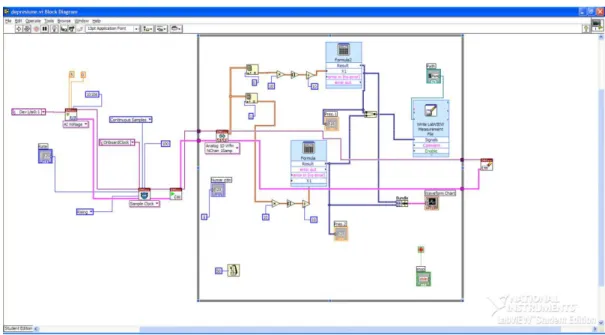
- a virtual instrument, designed with the LabView 7.1 software package, allowing both the visualization and the recording of the pressure signals.
Because force sensing is based on the modification of the electrical resistance of the transducer, a signal conditioning circuit was used in order to convert the variation of the electrical resistance into a
voltage signal. Bending of the force sensor over the round surface of the teat did not affect the readings (0 volts at output of the conditioning circuit when there was no force applied).
The block diagram of the virtual instrument created with LabView is presented in Figure 5; it uses a DAQmx virtual channel in order to read two physical channels (ai:0 and ai:1) of the USB 6009 device. The virtual channel measures voltages between zero and five volts; the differential terminal configuration (code 10106) is used for each physical channel. The sample clock allows the adjustment of the sampling rate, in samples per channel per second; during the tests, the sampling rate was set at 100 samples/s. A waveform chart was used to display the pressure signals on the computer screen; in the meantime, the signals were saved in a computer file.
Figure 4. View of the artificial teat:
1-force sensor; 2-artificial teat; 3-absolute pressure sensor
Figure 5. Block diagram of the virtual instrument
3. Assessment of the test system
In order to evaluate the system two types of teatcups were tested:
WestfaliaSurge Classic Pro silicone liner, part. no 7029-2725-010, for cow teats with the diameter between 21 and 28 mm, a mouthpiece diameter of 23 mm and the wall thickness of 2.5 mm; when mounted into the shell, the teatcup liner is elongated by 6.8%.
A low milk line type milking machine was used, the vacuum level in the main airline was set at of 40 kPa (61.32 kPa absolute pressure); the permanent vacuum level measured under the teat (inside the liner) was 38 kPa (63.32 kPa absolute pressure).
The artificial teat was mounted into the teatcup taking into account the shape of the collapsed liner, so that maximum contact pressure was applied upon the area where the force sensor was placed.
Two pulsation ratios (60/40 and 50/50) and three pulsation rates (50, 55 and 60 cycles/min) were used during the tests.
As shown by van der Toll, Schrader & Aernouts (2010) and in order to allow the liners to slide more readily around the teat, a lubricant was sprayed onto the surface of the artificial teat.
In order to obtain a high degree of repeatability for the same liner, the artificial teat was left undisturbed between the experiments (Adley & Butler, 1994).
Before performing any measurement, the liners were pulsated for at least 50 minutes; there were no significant variations of the environmental temperature during the experiments.
For each test, the following parameters were evaluated: - the pulsation ratio and rate;
- the duration of the cycle phases;
- the time the teatcup liner is completely open; - the time the liner is closed;
- the maximum contact pressure between the liner and the artificial teat; - the critical collapsing pressure difference.
The phases of the pulsation cycle were defined according to the requirements of the ISO 5707:2007 standard, using the pressure signal from the short pulse tube. The permanent vacuum was measured inside the liner, by the means of a channel drilled along the axis of the artificial teatcup
The pulsation cycle ratio and rate were calculated with the relations:
% Tt t
P a b
100
, (1)
cycles/min
T
f 60 , (2)
where T = ta + tb + tc + td is the cycle period [s], and ta, tb, tc and td are the durations of the respective
phases [s]. The relative differences between the set values of the pulsation rate and ratio and the measured ones were then calculated.
The force sensor mounted on the artificial teat was also used in order to evaluate the time the teatcup was completely open, o (Figure 6), considering the time when no force was applied to the teat.
The time the liner was closed was considered as the sum of the durations for the c and d phases.
The maximum contact pressure between the teatcup liner and the artificial teat was measured during the d phase of the pulsation cycle.
The critical collapsing pressure difference p was defined as the point at which the liner began to buckle because of the pressure difference across the walls, applying pressure over the teat (during the c phase of the pulsation cycle) and was evaluated with reference to the liner absolute pressure, as shown in Figure 6.
The critical collapsing pressure difference was measured for each type of liner and operating condition, after the liners were pulsated for about 50 minutes.
For each working condition (pulsation rate, pulsation ratio and type of teatcup) at least three tests were performed and then the average values were calculated.
the measured parameters in order to find out if the results were significantly different from a liner to another (p<0.05). The conclusion was that, except for the durations of the a and c phases, all the tested variants were significantly different.
Figure 6. Intermittent vacuum and contact pressure chart
3.1. Pulsation rate and ratio
The results concerning the pulsation rate and ratio are presented in Table 1; the values were obtained using the averaged values for the durations of the pulsation phases, with the formulae (1) and (2). According to the recorded data, differences were recorded between the theoretical (set) pulsation rates and the achieved (real) ones (which were lower), but, for most of the operating conditions (eleven of the twelve tested), the relative differences did not exceed 5% (for the rubber liner, at 50 cycles/min and 60/40 pulsation ratio, the recorded pulsation rate was with 5.96% lower than the set rate). As far as the pulsation ratio was concerned, the relative differences between the values prescribed by the computer software (pulsator ratios) and the recorded ones (pulsation ratios) were lower than 3% for ten of the twelve variants.
Table 1. Results concerning the pulsation ratio and rate (average values)
Set pulsation ratio [%] 60 50
Set pulsation rate [cycles/min] 50 55 60 50 55 60
WestfaliaSurge Classic Pro silicone liner
Measured ratio [%] 60.6 60.1 59.0 50.0 50.2 50.2
Measured rate [cycles/min] 47.7 53.6 57.2 48.6 52.8 58.3
WestfaliaSurge Classic rubber liner
Measured ratio [%] 56.1 59.0 58.7 48.2 48.8 49.4
3.2. Duration of the cycle phases
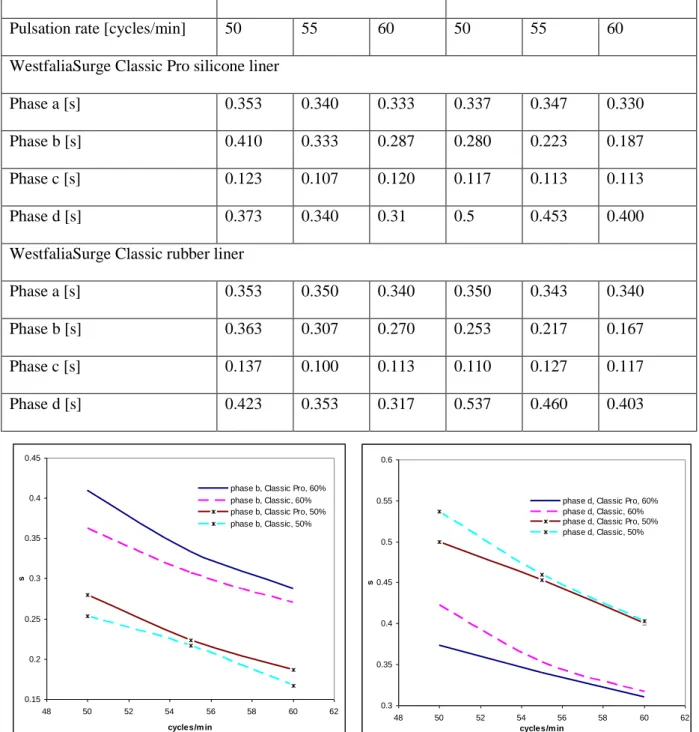
The results referring to the duration of the cycle phases are summarized in Table 2. The pulsation rate and ratio had little effect over the duration of the a phase (an average duration of 0.348±0.005 s), but higher pulsation ratios led to longer b phases and shorter d phases. Increasing the pulsation rate led to shorter b and d phases. Some differences between the two types of teatcup liners were recorded for the b and d phases: the Classic Pro liner led to longer b phases and shorter d phases compared to the Classic liner (Figures 7 and 8).
Table 2. Results concerning the duration of the pulsation phases
Pulsation ratio [%] 60 50
Pulsation rate [cycles/min] 50 55 60 50 55 60
WestfaliaSurge Classic Pro silicone liner
Phase a [s] 0.353 0.340 0.333 0.337 0.347 0.330
Phase b [s] 0.410 0.333 0.287 0.280 0.223 0.187
Phase c [s] 0.123 0.107 0.120 0.117 0.113 0.113
Phase d [s] 0.373 0.340 0.31 0.5 0.453 0.400
WestfaliaSurge Classic rubber liner
Phase a [s] 0.353 0.350 0.340 0.350 0.343 0.340
Phase b [s] 0.363 0.307 0.270 0.253 0.217 0.167
Phase c [s] 0.137 0.100 0.113 0.110 0.127 0.117
Phase d [s] 0.423 0.353 0.317 0.537 0.460 0.403
0.15 0.2 0.25 0.3 0.35 0.4 0.45
48 50 52 54 56 58 60 62
cycles/m in
s
phase b, Classic Pro, 60% phase b, Classic, 60% phase b, Classic Pro, 50% phase b, Classic, 50%
0.3 0.35 0.4 0.45 0.5 0.55 0.6
48 50 52 54 56 58 60 62
cycles/m in
s
phase d, Classic Pro, 60% phase d, Classic, 60% phase d, Classic Pro, 50% phase d, Classic, 50%
Figure 7. Duration of the b phase Figure 8. Duration of the d phase
accordance with the results obtained in an experiment conducted by Bade, Reinemann, Zucali, Ruegg & Thompson (2009), in which 77 Holstein cows were investigated; the conclusion was that the duration of the c phase was not affected when some of the working parameters were modified.
3.3. The maximum liner-teat contact pressure
The results concerning the maximum liner-teat contact pressure are displayed in Figure 9 (standard error bars are also shown). The Classic Pro teatcup liner achieved much lower contact pressures compared to the Classic liner. According to van der Toll, Schrader & Aernouts (2010), the lower liner tension of the Classic Pro liner (5.4 % stretch, compared to the 6.8 % stretch of the Classic liner) was one of the causes that led to lower maximum contact pressures; Davis, Reinemann & Mein (2001) also noticed that the compressive load over the teat increased with liner tension. The thicker wall and the softer material of the silicone liner were the other factors leading to the reduction of the compressive load over the teat (Muthukumarappan & Reinemann, 1993).
10 15 20 25 30 35 40 45 50
48 50 52 54 56 58 60 62
pulsation rate [cycles/m in]
m a x . c o n ta c t p re s s u re [ k P a ]
Classic Pro, 60% Classic, 60% Classic Pro, 50% Classic, 50%
Figure 9. Maximum teat-liner contact pressure
For the both types of teatcup liners, higher contact pressures were recorded for the 60% pulsation ratio than for the 50% pulsation ratio and the maximum contact pressure decreased when the pulsation rate was increased; this tendency was more clear for the Classic rubber liner, lower contact pressures being recorded at higher pulsation rates. In the case of the Classic Pro silicone liner, the pulsation rate had a less important effect over the maximum contact pressure.
3.4. The critical collapsing pressure difference
It was found that the collapsing pressure difference was not significantly affected by the pulsation rate and ratio, but was influenced by the type of liner; the average values were 10.06±0.12 kPa for the Classic rubber liner and 14.21±0.47 kPa for the Classic Pro silicone liner. It should be mentioned that, in a “static” test (no pulsation, vacuum applied inside the liner), the pressure difference needed to close the liners was 12.7 kPa for the rubber one and 18.6 kPa for the silicone liner. This result is probably due to the different elastic properties and the thicker wall of the silicone liner, because, should only the mounting tension be considered, the lower mounting tension of silicone liner (5.4 % elongation, compared to 6.8 % for the Classic liner) would normally result in lower pressure differences (Mein, Williams & Thiel, 1987).
It should be noted that the recorded values of the critical collapsing pressure difference were within the range of values reported by other authors - 11.9 kPa pressure difference according to Spencer & Jones (2000).
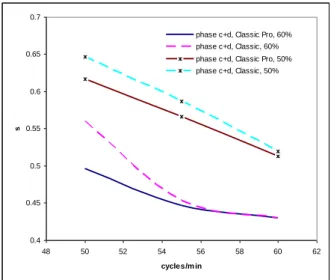
3.5. The time the teatcup liner is completely open and respectively closed
As mentioned before, the time while the teatcup liner is completely open was considered to be the time during which no force was applied to the teat; the results concerning this item are summarized in Table 3, together with the durations of the b phase of the pulsation cycle.
Table 3. Results concerning the time the teatcup liner is completely open
Pulsation ratio [%] 60 50
Pulsation rate [cycles/min] 50 55 60 50 55 60
WestfaliaSurge Classic Pro silicone liner
Phase b [s] 0.410 0.333 0.287 0.280 0.223 0.187
Time the liner is open [s] 0.520 0.417 0.390 0.363 0.320 0.273
WestfaliaSurge Classic rubber liner
Phase b [s] 0.363 0.307 0.270 0.253 0.217 0.167
Time the liner is open [s] 0.477 0.370 0.363 0.377 0.330 0.263
As expected, increased pulsation rates and decreased pulsation ratios led to shorter periods of time during which the liner was completely open.
For both liners the time the liner was completely open was longer than the duration of the b phase of the pulsation cycle, for all the operating conditions; this means that the liner was already opened before the end of the a phase and remained opened at the beginning of the c phase.
At 60% pulsation ratio, the silicone liner was completely open for a longer time than the rubber one; at 50% pulsation ratio, the rubber liner was opened for a longer period. This results are correlated with the ones regarding the duration of the b phase (Figure 7): at 60/40 pulsation ratio, the b phase for the silicone liner was significantly longer than for the rubber liner, and, as a consequence, the Classic Pro liner was completely open for a longer time; at the 50/50 pulsation ratio, lower differences were recorded between the two liners in the terms of the duration of the b phase.
0.4 0.45 0.5 0.55 0.6 0.65 0.7
48 50 52 54 56 58 60 62
cycles/m in
s
phase c+d, Classic Pro, 60% phase c+d, Classic, 60%
phase c+d, Classic Pro, 50% phase c+d, Classic, 50%
Figure 10. Duration of the c+d phases
For all the tested variants, the Classic liner was closed for a longer period than the Classic Pro liner, which is in accordance with the results recorded for the duration of the d phase (Figure 8); taking into account the findings of Adley & Butler (1994), this behavior might have also contributed to the higher liner-teat contact pressures (see Figure 9).
4. Conclusions
A computer controlled system for the evaluation of the mechanical milking machines; the system contains a computer driven pulses generator and a computer controlled pressure recording system. The system is a relatively low cost one and can be used for real life testing of milking machines.
Two types of teatcups were tested in order to evaluate the performances of the system, at different pulsation rates and ratios. The experimental results showed that for a prescribed pulsation ratio, the achieved pulsation ratio could be considered constant, as only minor variations were recorded. The recorded pulsation rate was also constant, although the achieved values were lower than the set ones. These results confirm the functionality of the computer driven pulses generator.
The results concerning the maximum liner-teat contact pressure showed that lower contact pressures were achieved by the silicone liner compared to the rubber one, due to the different properties of the material; the results concerning the critical collapsing pressure difference and the time the teatcup liner is completely open and respectively closed were consistent with the findings of other researchers, thus confirming the functionality of the pressure recording system.
References
Adley, NJD, & Butler, C 1994 ’Evaluation of the use of an artificial teat to measure the forces applied by a milking machine teatcup liner. Journal of Dairy Research, vol. 61, no 4, pp. 467-472.
doi: 10.1017/S0022029900028399
ASAE EP445.1 1996, Test equipment and its application for measuring milking machine operating characteristics. American Society of Agricultural Engineers, St. Joseph, MI, USA
Bade, RD, Reinemann, DJ, Zucali, M, Ruegg, PL, & Thompson, PD 2009 ’Interactions of vacuum, b-phase duration and liner compression on milk flow rates in dairy cows. Journal of Dairy Science, vol. 92, no. 3, pp. 913-921. doi: 10.3168/jds.2008-1180
Billon, P, & Gaudin, V 2001 ’Influence of the duration of the a and c phases of pulsation on the milking characteristics and on udder health of dairy cows. ICAR Technical Series, no. 7, pp. 105-111.
Davis, MA, Reinemann, DJ, & Mein, GA 2001 ’Development and testing of a device to measure the compressive teat load applied to a bovine teat by the closed teatcup liner. ASAE Paper Number 013007, presented at the 2001 ASAE Annual International Meeting, Sacramento, California. Available from:
doi: 10.13031/2013.7407.
Demba, S, Elsholz, S, Ammon C, & Rose-Meierhöfer, S 2016 ’The usability of a pressure-indicating film to measure the teat load caused by a collapsing liner. Sensors, vol. 16, no. 10, 1597. doi:10.3390/s16101597
Gates, RS, & Scott, NR 1986 ’Measurements of effective teat load during machine milking. Transactions of the ASAE, vol. 29, no. 4, pp. 1124-1130.
ISO 3918:2007, Milking machine installations – Vocabulary, International Organization for Standardization, Geneva, Switzerland.
ISO 5707:2007, Milking machine installations - Construction and performance, International Organization for Standardization, Geneva, Switzerland.
ISO 6690:2006, Milking machine installations – Mechanical tests, International Organization for Standardization, Geneva, Switzerland.
Kochman AK, Laney C, & Spencer SB 2008 ’Effect of the duration of the c phase of pulsation on milking performance. Presented at the 47thNational Mastitis Council Conference. Available from:
http://www.laurenagrisystems.com/PDF/Research/EffectsOfDurationOfCPhaseOfPulsation.pdf [10 September 2014].
Mein, GA, Williams, DM, & Thiel, CC 1987 ’Compressive load applied by the teatcup liner to the bovine teat.
Journal of Dairy Research, vol. 54, no. 3, pp. 327-337. doi: 10.1017/S0022029900025504
Mein GA, & Reineman, DJ 2009’ Biomechanics of Milking: Teat-Liner Interactions. ASABE Paper Number
09743, presented at the 2009 ASABE Annual International Meeting, St. Joseph, Michigan. Available from:
www.uwex.edu/uwmril/pdf/MilkMachine/Liners/09 ASABE Mein-Reinemann teat Liner.pdf [10 September 2014]. doi: 10.13031/2013.27436
Muthukumarappan, K, & Reinemann, DJ 1993 ’Compressive load applied by the teatcup liner to the bovine teat.
ASAE Paper no. 933538 presented at the 1993 International Winter Meeting of ASAE, Chicago, Illinois, ASAE,
2950 Niles Rd., St. Joseph, Michigan.
Reinemann, DJ, Mein, GA, & Muthukumarappan, K 1994 ’Forces applied to the bovine teat by the teatcup liner during machine milking. Report n. 94-D-052, presented at the XII CIGR World Congress and AGENG’94
Conference on agricultural engineering, Milano, Italy. Available from:
www.uwex.edu/uwmril/pdf/milkmachne/liners/94cigr_teat_load.pdf [10 September 2014].
Reinemann, DJ, Rasmussen, MD, & Mein, GA 2001 ’Instrument requirements and methods for measuring vacuum in milking machines. Transactions of ASAE, vol. 44, no. 4, pp. 975-981.
Spencer, SB, & Jones, RL 2000 ’Liner wall movement and vacuum measured by data aquision. Journal of Dairy Science, vol. 83, no. 5, pp. 1110-1114. doi: 10.3168/jds.S0022-0302(00)74976-9
Spencer, SB, Shin, J-W, Rogers, GW, & Cooper, JB 2007 ’Effect of vacuum and ratio on the performance of a monobloc silicone milking liner. Journal of Dairy Science, vol. 90, no. 4, pp. 1725-1728. doi: 10.3168/jds.2006-493